# AgenaTrader Online Help

To help you build your knowledge step by step, we strive to provide the most detailed information possible. Here, you will be guided through the extensive functionality of AgenaTrader and find comprehensive product descriptions.&#x20;

Additionally, related documentation pages are available to support your learning process. The **Indicators** section provides a complete list and descriptions of all AgenaTrader indicators. The **AgenaScript** section offers advanced scripting knowledge to help you create and customize your trading strategies. Lastly, the **Release Notes** section details all version updates and changes, ensuring you stay informed about the latest improvements and features.

<table data-view="cards"><thead><tr><th></th><th></th><th></th><th data-hidden data-card-cover data-type="files"></th><th data-hidden data-card-target data-type="content-ref"></th></tr></thead><tbody><tr><td><a href="https://indicators.agenatrader.com/"><strong>Indicators</strong></a></td><td><img src="/files/MiHUU1cAySHg6aqGHZDw" alt="" data-size="original"></td><td></td><td><a href="/files/VoswoYLlAUCgokpsDOnM">/files/VoswoYLlAUCgokpsDOnM</a></td><td><a href="https://indicators.agenatrader.com/">https://indicators.agenatrader.com/</a></td></tr><tr><td><a href="https://script.agenatrader.com/"><strong>AgenaScript</strong></a></td><td><img src="/files/PGn1cRPsVhb57XjwpTeE" alt="" data-size="original"></td><td></td><td><a href="/files/ygQqflpnEMhW7BDH3qzC">/files/ygQqflpnEMhW7BDH3qzC</a></td><td></td></tr><tr><td><a href="https://release.agenatrader.com/"><strong>Release Notes</strong></a></td><td><img src="/files/jDGDzhC9mJ92X7kGTdNp" alt="" data-size="original"></td><td></td><td><a href="/files/lp6oVqsZlP90F5wCJuAF">/files/lp6oVqsZlP90F5wCJuAF</a></td><td><a href="https://release.agenatrader.com/v/german-2">https://release.agenatrader.com/v/german-2</a></td></tr></tbody></table>


# Overview

**AgenaTrader** is a sophisticated trading platform designed to cater to both beginner and professional traders. Built with flexibility and efficiency in mind, it offers a wide range of tools and features to streamline trading processes, enhance decision-making, and support advanced strategies.

## Get professional with our powerful tools

### Signal Builder

With the **Signal Builder**, you can very simply create your signals using Drag\&Drop, without the need for any programming knowledge.

With the right idea, there are almost no limits to your imagination. You have practically all the possibilities of real programming, but do not have to know any programming language.

### **Strategy Builder**

The **Strategy Builder (SetupBuilder)** helps you to equip the signals you have created with stop/trailing or TakeProfit functions.

Based on your setups or your ideas, AgenaTrader’s semi-automatism then takes charge of the management of your trades.

### **Risk and money management**

**Risk and money management** ensures that you have a firm grip on your trading risk for each and every trade.

The position size is automatically calculated, and simultaneously to this, your risk are continuously taken into account.

### Backtest

Our **Backtesting Tool** was developed in collaboration with the renowned University of Aachen.

This tool helps you to validate your signals. A comprehensive evaluation visualizes how successful your idea was.

### Advanced Scanner

The **Advanced Scanner** makes it possible for you to scan hundreds of values in real time.

If one of your signals occurs, the relevant symbol is marked. With a click on the signal, the corresponding strategy is placed in the chart with active risk management.

### ChartGroups

The **ListChartGroups** and the **TabChartGroups** will help you to completely focus on the market.

A ListChartGroup is a chart container that includes a real-time scanner and a charting area. Within these charting areas, you can select 1-4 charts with different timeframes that are connected to the scanner list.

A TabChartGroup is a chart container that opens charts in different timeframes for hundreds of instruments at the same time, in order to visually analyse a large variety of symbols within a very short time, enabling you, for example, to efficiently form long and short lists from these symbols.

### News Feed Reader

With the **integrated feed reader**, you have the possibility to conveniently receive aggregated news in near-time from out of the platform.

The feed reader enables you to react to important events such as analyst opinions / profit warnings or game changers. Our news aggregator keeps you up-to-date on the latest market events.

You receive near-time news on almost all values traded in official stock exchanges.

### Trading Journal

Our top priority is to help you trade with more success and stability.

We want to achieve this by providing a structured approach for setting up your trades, determining the position size and the risk and money management, in combination with a simple, user-friendly trading diary.

The diary makes it easy for you to check trades that have been executed and use them to learn how you can improve your trading skills each day.

The trading diary has a logical structure and offers you the most important figures for evaluation.

### **EOD** Screener

Use our integrated **EOD Screener** to discover potential trading and investment opportunities across the US stock market.

With a wide range of user-defined filters and market data, you can screen thousands of stocks based on your preferred criteria, helping you quickly identify instruments that match your trading strategy. Whether you are looking for growth stocks, value opportunities, specific sectors, or technical setups, the EOD Screener allows you to narrow down the market efficiently.

All screening configurations can be saved as templates, making it easy to reuse your favorite scans whenever needed.

The EOD Screener combines powerful filtering capabilities with a broad selection of fundamental and market data, helping you make more informed trading decisions.

## Trade with confidentiality

AgenaTrader gives you complete peace of mind!

As trades are executed locally on your PC or private cloud, no 3rd party is able to access or view your trades, indicators or strategies except you! Not even your broker!

Why would you waste your time programming your strategies, putting in hours, days and weeks to make your trading profitable, only for someone else to copy-paste your valuable work and pull the rug from underneath you?

We want to make an end to insider trading and big companies and brokers selling your data on to make a profit. We understand that for traders, their strategies and setups are more valuable than gold, so we do everything in our hands so that traders can trade with confidentiality.

## Your one-stop solution

AgenaTrader allows you connect to different brokers and datafeeds simultaneously. No more switching between tools! Everything is accessible via AgenaTrader.

Whether you would like to scan, analyze, automate in your personalized way, all of this can be done from AgenaTrader itself without any 3rd party software.

**Everything is ready, even if you only use one monitor!**

You do not need more than one monitor. We understand that many traders are on the go, and a laptop can be more convenient at times and there is no doubt that a multiscreen setup is the preferred way of any trader, however AgenaTrader has been designed and programmed with our [Docking Tabs Technology](https://docs.agenatrader.com/v/master/main/set-up-your-workspace#docking-tabs) - meaning, even if you only use one single monitor, it would be more than enough! The AgenaTrader workspace design and grouping is highly flexible, and can be customized to adapt the layout to suit your needs to have all of your desired tools in one place!


# Supported Instruments and Order Processing

## Supported Instruments and Order Processing

AgenaTrader supports a wide range of asset classes, including:

* Stocks
* CFDs
* Futures
* Forex
* Options
* Indices

However, the specific instrument types available for trading depend on your broker. Make sure to check with your broker to see which asset classes are supported.

## Supported order connections <a href="#supported_order_connections" id="supported_order_connections"></a>

Order connections are mechanisms that link your entry orders with target(s) and stop(s), allowing for automated order management. There are three main types of order connections:

* **OCO (One Cancels the Other):** If your stop order is executed, the target order is automatically canceled, and vice versa.
* **IfDone:** Once your entry order is executed, the associated stop and target orders are automatically placed.
* **ORO (One Reduces the Other):** If one of your target orders is executed, the size of your stop order is reduced by the executed amount to match the remaining position size.

It's important to note that handling and support for these order connection types may vary depending on your broker. For more details, refer to the specific broker pages in this Wiki or consult the relevant FAQ article.

## Order execution <a href="#order_execution" id="order_execution"></a>

AgenaTrader itself does not execute orders. Instead, brokers handle the execution and inform AgenaTrader about filled orders and their execution prices.

If the data from your data feed provider does not match the quotes on your broker's platform for a specific instrument, the entry and exit prices may not display correctly on your chart.

***


# License Versions

## **Andromeda & Andromeda SIM** <a href="#agenatrader-license-versions-andromeda-and-andromeda-sim" id="agenatrader-license-versions-andromeda-and-andromeda-sim"></a>

AgenaTrader is available in **two license versions** to accommodate different user needs: **Andromeda** and **Andromeda SIM**.

### ⚙️ What's the difference? <a href="#whats-the-difference" id="whats-the-difference"></a>

Both versions offer **identical functionality**, including full access to the platform’s professional charting, trading, and automation features. The **only difference** lies in **where and how you can place trades**.

## 💻 **Andromeda SIM (Free)** <a href="#andromeda-sim-free" id="andromeda-sim-free"></a>

**Andromeda SIM** is the **default license** assigned to all users **after their first-time setup** of AgenaTrader. It is **completely free** and offers full platform access, but is limited to the following trading environments:

* [**SimAccount**](/main/broker-and-datafeeds-connections/simulated-account) (paper trading)
* ​[**AgenaBroker**](https://broker.agenatrader.com/) accounts

✅ Ideal for traders who want to test strategies or participate in competitions&#x20;

❌ Does not allow connections to external brokers

Additionally, you can still connect to [**data feed providers**](/main/broker-and-datafeeds-connections/datafeed) (only if they are not brokers). They are listed in the [**Data Feeds**](/main/broker-and-datafeeds-connections/datafeed) **section** of the documentation.

## 🚀 **Andromeda (Full License)** <a href="#andromeda-full-license" id="andromeda-full-license"></a>

With a full **Andromeda license**, you unlock **full** [**multibroker capabilities**](/main/broker-and-datafeeds-connections/connections#multi-account-settings), allowing you to trade with a wide variety of brokers. You can connect to:

* Any broker that supports one of our [**technology provider**](/main/broker-and-datafeeds-connections/technology-provider) **connection types**
* All brokers listed on our [**Supported Brokers**](/main/broker-and-datafeeds-connections/broker) **list**

The Andromeda license can be **rented directly from our** [**AgenaTrader Shop**](https://shop.agenatrader.com/).

✅ Designed for professional and active traders

✅ Supports live trading with multiple brokers and custom setups

## 🧾 Summary

| Feature                 | Andromeda SIM (Free) | Andromeda (Full License)       |
| ----------------------- | -------------------- | ------------------------------ |
| SimAccount trading      | ✅                    | ✅                              |
| AgenaBroker trading     | ✅                    | ✅                              |
| External brokers        | ❌                    | ✅                              |
| Multibroker support     | ❌                    | ✅                              |
| Datafeeds (non-brokers) | ✅                    | ✅                              |
| License cost            | Free                 | Subscription available in Shop |


# Hardware and system requirements

|                              | **Minimum**                                                                                     | **Recommended**                                                                                 |
| ---------------------------- | ----------------------------------------------------------------------------------------------- | ----------------------------------------------------------------------------------------------- |
| **Operating system**         | Windows 10, 11                                                                                  | Windows 10, 11                                                                                  |
|                              | (Apple IOS in virtualisierter Umgebung)                                                         | (Apple IOS in virtualisierter Umgebung)                                                         |
| **Screen resolution**        | 1024 x 768 pixel                                                                                | 1920 x 1080 pixel                                                                               |
|                              |                                                                                                 | max. resolution 4.096 x 2.160 pixel                                                             |
| **Processor**                | Dual Core 2 GHz+                                                                                | Hz+ Quad Core 3 GHz+                                                                            |
| **RAM memory**               | 8 GB                                                                                            | 16 GB and higher                                                                                |
| **Hard drive**               | Standard SATA                                                                                   | SSD                                                                                             |
|                              | (Memory required: The setup file is \~340 MB, and \~400 MB for additional programm data)        | (Memory required: The setup file is \~340 MB, and \~400 MB for additional programm data)        |
| **System type**              | [64-bit operating system](http://windows.microsoft.com/de-at/windows/32-bit-and-64-bit-windows) | [64-bit operating system](http://windows.microsoft.com/de-at/windows/32-bit-and-64-bit-windows) |
| **Internet connection**      | 16 Mbit/s                                                                                       | 32 Mbit/s or more                                                                               |
| **Microsoft .NET Framework** | 4.7.2 (2020 onwards)                                                                            | Newest version                                                                                  |

**Note**: Please check your energy settings and turn off the sleep mode!

{% hint style="info" %}
Windows 7 / 8 / 8.1 are no longer listed as supported, because they are no longer supported by Microsoft: [Link](https://www.microsoft.com/en-us/windows/end-of-support?r=1)
{% endhint %}


# Licensing, Programming, Costs, and Support Overview

## **License: ownership and right of use**

Ownership of the software always remains with the manufacturer. With the purchase of an AgenaTrader license, the customer acquires the right to use the software. You can find more detailed information in our [Terms & Conditions](https://agenatrader.com/terms-and-conditions/).

## **Programming and language**

AgenaTrader was programmed in C Sharp.NET and uses a PlugIn Architecture.\
AgenaScript, our internal scripting language, is also based on C#. You can find a more detailed explanation of AgenaScript in the [script help](https://script.agenatrader.com/) or in our [Discord-Channel](https://discord.gg/UemeccwT)\
AgenaScript is very similar to the programming language of NinjaTrader, and it is possible to import NinjaScript to a certain degree.

## **Possible extra costs**

With each AgenaTrader version, you receive a lifetime license. This means that there are no further costs for you when "updates" are released within this version. Costs are only incurred if you would like to upgrade to a higher version of AgenaTrader (e.g. from Basic to Andromeda).\
For data feed, broker connections, AddOns and Add-Ins, however, additional costs are incurred.\
You can find further information about this in our [Shop](https://shop.agenatrader.com/).

## **Changing product or version**

Online products have to be manually ordered or terminated by the customer, using our [online shop](https://shop.agenatrader.com/). For a product change, the old one must be cancelled/terminated and the new one ordered via the normal ordering process.

Each product license key is sent to you from the online shop: With the order of your current product, you receive an invoice with your license key by email (please also check your spam file). You can also find the invoice with your key in your customer account in the shop.\
When you log in there, you have the option to edit your products (terminate, cancel, place new orders).

## **AgenaTrader online media and support**

You will find all the links to our online media (tutorials, module videos, wiki, webinars, partner offers and much more). [Here](broken://pages/-MPdT6_rCvmHSCsZPHx_#Report_errors) you can find instructions about how to contact our sales or support team. For general requests about how to use the software, we invite you to use our [Discord-Channel](https://discord.gg/UemeccwT) where users as well as AgenaTrader staff will help you and give answers to your questions.\
In addition, our [YouTube channel](https://www.youtube.com/user/AgenaTrader) is also available for you, with webinars on trading education, software training sessions and more for your advanced education.


# Download and Installation TBD

AgenaTrader can be downloaded via the following link:

{% embed url="<https://agenatrader.com/download/AgenaTrader_Setup.exe>" %}
Click the link to download AgenaTrader
{% endembed %}

After downloading, you can start the installation process of AgenaTrader by double-clicking on the .exe file. Follow this video on how to install AgenaTrader:

{% embed url="<https://youtu.be/KSUyEmLd1fU>" %}

<details>

<summary>Recommendations for Installing the AgenaTrader Software</summary>

**1. Firewall / Antivirus Software**

When starting the application, AgenaTrader performs a license key validation by contacting our license server. Please ensure that this process is permitted by your firewall, antivirus software, or any other security tools. If blocked, you may encounter a "License Key Expired" message, which restricts your AgenaTrader access to the free license features.

After completing the installation, refer to the relevant [**Connection Guide**](https://app.gitbook.com/o/-MVa4bg-WPt0s_0Xpv-A/s/Sb9KiaeLmZhUGHJdWN19/main/broker-and-datafeeds-connections/connection-guides) to establish a connection with your broker or data feed provider.

**2. TCP Ports Used by AgenaTrader**

For AgenaTrader to function correctly, the following TCP ports must remain unused by other applications:

* **7778:** Main AgenaTrader service for licensing
* **7779:** Connection to the instrument database
* **7780:** Service for sending support user data

**3. Clearing Browser Cache**

If you are downloading or upgrading to a new version of AgenaTrader, you may need to clear your browser cache to avoid issues such as "Cabinet File Errors" or problems with temporary files.

In case of such errors, please follow these steps:

1. Open your web browser.
2. Clear your browsing history/cache.
3. Attempt the download again.

If the issue persists, try using a different web browser (e.g., Firefox, Chrome, Internet Explorer).

</details>

## **License key TBD** <a href="#license-key" id="license-key"></a>

In order to be able to use AgenaTrader, you need a license key.

Your license key was sent to you via email by our online shop provider. Please keep this email in a safe place and save the license key securely on a storage medium. The email also contains the access data for your online shop account, where you can quickly and easily revise your products and cancel or order new subscriptions.

If you have not received this email, please check in your spam folder - occasionally, regular emails get lost there too. If you have no email from us there either, please get in contact with our support.

### **License activation** <a href="#license-activation" id="license-activation"></a>

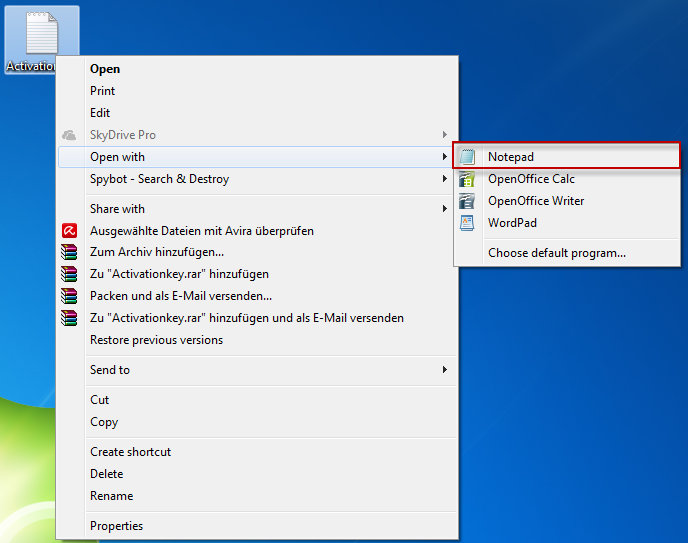
Open the file key.dat using the program Editor or Notepad in Windows. Apple also offers text editing programs with which you can open this file.

<figure><img src="/files/IwuhHpFmZ40pJLrFBMFg" alt=""><figcaption></figcaption></figure>

Enter the license key in the AgenaTrader licensing setup. You will find this in the main menu bar under the button "Licensing". The main key (Basic, Andromeda, etc.) must be entered in the top field "Activation Key"; then, click on the button "Activate". The message box below then shows you whether your license has successfully been activated.

<figure><img src="/files/bezlmF0Ez4t4DClxmzZn" alt=""><figcaption></figcaption></figure>

### **Demo Request** <a href="#demo-request" id="demo-request"></a>

The demo version is a complete application, equipped with all the necessary features for trading. To get demo version please click on **Request Demo Key** button. In open dialog filled forms: First Name, Last Name, E-Mail, Language and activate checkboxes. After click **Request Demo Key** button. You will get the demo key via emails you entered.

![](https://docs.agenatrader.com/~gitbook/image?url=https%3A%2F%2F2805764894-files.gitbook.io%2F%7E%2Ffiles%2Fv0%2Fb%2Fgitbook-legacy-files%2Fo%2Fassets%252F-MKZSsJBtSP9L4sqIe_q%252F-MQwPCScTa47vxWsw7R-%252F-MQwQhrQ6GhghLBFeTcU%252FDemo%2520Request.png%3Falt%3Dmedia%26token%3Dad813a8c-cedf-4f0a-9891-39e9d2551668\&width=768\&dpr=4\&quality=100\&sign=e593f648\&sv=1)

**Please note that the only limitation is the usage time of 4 weeks.** If you are interessted in data: it is possible to select a demo datafeed from our partners Lenz+Partner (Tai-Pan). The selected feed is then installed automatically. You can alsoe request a trial account from [our other partners](https://agenatrader.com/de/marktdaten-echtzeit/).

Now all you need to do is create a [simulated account](https://agenatrader.com/broker/) and you can start using the AgenaTrader platform.

You can also request your free of charge AgenaTrader demo version through our [Website](https://agenatrader.com/agenatrader-free-trial/)!

You will NOT be under ANY obligations, DO NOT have to cancel anything and there is also NO transfer to an automatic purchase.

### AgenaTrader on Multiple Devices

With an activation key, you can work from multiple devices (PC, laptop, etc.). However, it is not possible to access the AgenaTrader license key from multiple devices simultaneously. The license key permits only one instance/access at a time.

### Resetting AgenaTrader to Previous Settings: Backup

To protect your privacy, we do not store customer data on our servers. AgenaTrader is purely client-side software. Therefore, we strongly recommend you back up your data!

### Does AgenaTrader Support MAC OSX (Apple)?

AgenaTrader is developed for Windows and cannot be installed on Mac (Apple). Many customers successfully use virtual machines on Mac (Apple) to run Windows (e.g., Parallels).

### Will My Data Be Preserved During an Update?

You will be notified via a popup when a new update is available, and we recommend installing it. Only system data will be updated; your personal data (e.g., user directory, workspace, instruments, conditions) will be preserved.

### Download the Latest AgenaTrader Release

Downloads are available 24/7 on our homepage. Generally, you will be prompted to update via a popup upon restarting if an update is available. Additionally, AgenaTrader will show an update notification at the bottom right of the screen.

![](https://docs.agenatrader.com/~gitbook/image?url=https%3A%2F%2F1347375179-files.gitbook.io%2F%7E%2Ffiles%2Fv0%2Fb%2Fgitbook-legacy-files%2Fo%2Fassets%252F-MKZSsJBtSP9L4sqIe_q%252F-MPEsNvvtjP2k0b1-L-6%252F-MPEvzdGw3YxJg_eV0ph%252FUpdate%2520%281%29.png%3Falt%3Dmedia%26token%3Dae1f783e-e496-4410-8ad8-77658d1a741f\&width=768\&dpr=4\&quality=100\&sign=39f27889\&sv=1)


# Education Mode

For a new user in AgenaTrader, and all those who want to learn more, or need information about a functionality quickly, we implemented an Education Mode feature. It helps in understanding each function in AgenaTrader even faster and better. It provides quick access to Wiki without using a browser.

When you hover on each feature, a short text tooltip will be shown:

![](https://docs.agenatrader.com/~gitbook/image?url=https%3A%2F%2F2805764894-files.gitbook.io%2F%7E%2Ffiles%2Fv0%2Fb%2Fgitbook-legacy-files%2Fo%2Fassets%252F-MKZSsJBtSP9L4sqIe_q%252F-MPhn7zlMCA093nNUSJf%252F-MPi4JCJyG11O-3qISX0%252Feducation.png%3Falt%3Dmedia%26token%3D6824e86f-5c8a-41de-86ee-8fdca33631be\&width=768\&dpr=4\&quality=100\&sign=28745e35\&sv=1)

In order to switch to Education Mode please click on <img src="/files/AX1Knr6DpUKtm3peOX0k" alt="" data-size="line"> button on the main toolbar. Once done, a Bulb button will appear next to each function name.

Clicking on this button will lead to an explanation of the function Wiki article in a small extra window.

<figure><img src="/files/MICflVhKoFGEdPAuU05K" alt=""><figcaption></figcaption></figure>

If several articles describe function, you may navigate through them via buttons:

<figure><img src="/files/RW6EFTBkZ39kOC9kyqRs" alt=""><figcaption></figcaption></figure>

To deactivate **Education Mode**, simply click on the Icon in the main toolbar again.


# Video Guide

In order to save your time, we create the summary table for each educational video. It includes most common questions. Left click on video player opposite selected question will lead you YouTube video on exact second the answer is. Now you have no need to watch the full video. In addition, you may find the link to the wiki article with answers.\
&#x20;

## Download and Installation

### **Where should I download Agenatrader?**

[Download and installation](broken://pages/-MPcgzfmlLsGmSLX7SDt)

{% embed url="<https://youtu.be/KSUyEmLd1fU>" %}

### **System Requierements**

[Hardware and system requirements](broken://pages/-MPEwe4UYw1Lnh6lPZer)

{% embed url="<https://youtu.be/KSUyEmLd1fU>" %}

### **How to install Agenatrader**

[Download and installation](broken://pages/-MPcgzfmlLsGmSLX7SDt)

{% embed url="<https://youtu.be/KSUyEmLd1fU>" %}

### **How to check type of operation system**

[Hardware and system requirements](broken://pages/-MPEwe4UYw1Lnh6lPZer)

{% embed url="<https://youtu.be/KSUyEmLd1fU>" %}

### **How to activate AgenaTrader**

[License activation](broken://pages/-MPEzQWdkhcxXamZjMQ_)

{% embed url="<https://youtu.be/KSUyEmLd1fU>" %}

### **How to get demo key**

[Demo Request](broken://pages/-MPEzQWdkhcxXamZjMQ_#demo-request)

{% embed url="<https://youtu.be/KSUyEmLd1fU>" %}

### **How to setup demo datafeed /broker**

[Simulated account](broken://pages/-MPF1MzVr5xVoyQXva--)

{% embed url="<https://youtu.be/KSUyEmLd1fU>" %}

### **How to connect/ disconnect datafeed or broker**

[Connections](broken://pages/-MPcpf2L-P2RSWvzhUdy)

{% embed url="<https://youtu.be/KSUyEmLd1fU>" %}

### **Do we sell market data or brokerage services**

[Opening a trading account through us](broken://pages/-MPF1MovtaX6SndWUwsm)

{% embed url="<https://youtu.be/27qFmB8dN_s>" %}

### **History length you can get from datafeed vendor**

[Show All History](broken://pages/-MPK0TeMLV3pvaCjagwA)

{% embed url="<https://youtu.be/27qFmB8dN_s>" %}

### **Brokers we support**

[Broker and Datafeeds Connections](broken://pages/-MPF0msd9y2o4KRfNV5Y)

{% embed url="<https://youtu.be/27qFmB8dN_s>" %}

### **Datafeed we support**

[Broker and Datafeeds Connections](broken://pages/-MPF0msd9y2o4KRfNV5Y)

{% embed url="<https://youtu.be/27qFmB8dN_s>" %}

### **How to add new Account**

[Account connections](broken://pages/-MPFCtSwvGJXBK0xZrei)

{% embed url="<https://youtu.be/27qFmB8dN_s>" %}

### **How to connect two datafeeds simultaneosly**

[Account connections](broken://pages/-MPFCtSwvGJXBK0xZrei)

{% embed url="<https://youtu.be/27qFmB8dN_s>" %}

## Chart Types

### **How to open Simple Chart**

[Single Chart](broken://pages/-MPJumhVpmqKhmX1nKZ1#single-chart)

{% embed url="<https://youtu.be/UKh3viLMTys>" %}

### **How to open Single Chart Group**

[Single Chart Group](broken://pages/-MPJumhVpmqKhmX1nKZ1#single-chart-group)

{% embed url="<https://youtu.be/JAmHD_MzpzE>" %}

### &#x20;**How to open TabChart Group**

[Tab Chart Group](broken://pages/-MPJumhVpmqKhmX1nKZ1#Chart_Container__Tab_Chart_Group)

{% embed url="<https://youtu.be/JAmHD_MzpzE>" %}

### **How to open Chart Gallery**

[Chart Gallery](broken://pages/-MPJumhVpmqKhmX1nKZ1#Chart_Container__Chart_Gallery)

{% embed url="<https://youtu.be/JAmHD_MzpzE>" %}

### **Dynamic Scanner**

[Dynamic Scanner](broken://pages/-MPJumhVpmqKhmX1nKZ1#dynamic-scanner)

{% embed url="<https://youtu.be/JAmHD_MzpzE>" %}

### **How to add new symbol to List Chart Group**

[Dynamic Scanner](broken://pages/-MPJumhVpmqKhmX1nKZ1#dynamic-scanner)

{% embed url="<https://youtu.be/UKh3viLMTys>" %}

## Chart Toolbar

### **How to create own workspace**

[Workspace menu](broken://pages/-MPci1XGOKBuHT7PG8Ao)

{% embed url="<https://youtu.be/UKh3viLMTys>" %}

### **How to add Alerts on a chart**

[Add Alerts](broken://pages/-MPK3MCnZkRIpwS6FLQq#add-price-alert)

{% embed url="<https://youtu.be/UKh3viLMTys>" %}

### **How to open Instrument Editor**

[Instrument Editor](broken://pages/-MPJz72-bK6stB3N6EOm)

{% embed url="<https://youtu.be/UKh3viLMTys>" %}

### **How to change TimeFrame**

[Time frame](broken://pages/-MPJz85NZ_B05wI8CmSn)

{% embed url="<https://youtu.be/UKh3viLMTys>" %}

### **How to add more instruments into one chart**

[Multidata](broken://pages/-MPJz82fR6P3Am5SIAdb)

{% embed url="<https://youtu.be/UKh3viLMTys>" %}

### **How to change Chart style**

[Price style](broken://pages/-MPJz801FkqQlVVeBSpk)

{% embed url="<https://youtu.be/UKh3viLMTys>" %}

### **How to add Drawing Object**

[Drawing objects](broken://pages/-MPJz7xtkmvtPjDRkXKo)

{% embed url="<https://youtu.be/UKh3viLMTys>" %}

### **How to add Indicators**

[Indicators](broken://pages/-MPK0P1r4ZzCNp0OxNnZ)

{% embed url="<https://youtu.be/UKh3viLMTys>" %}

### **How to start strategy**

[Start AgenaTrader (plusplus)](broken://pages/-MPK0TkY8Q88x3_SDMz3)

{% embed url="<https://youtu.be/UKh3viLMTys>" %}

### **How to add symbol to instrument list**

[Add to instrument list](broken://pages/-MPK22L55lPYMuuWgDkK)

{% embed url="<https://youtu.be/UKh3viLMTys>" %}

### **How to add Price Markers and Lines**

[Price markers and spread markers](broken://pages/-MPK22FsKIEFfj2iAEp7)

{% embed url="<https://youtu.be/UKh3viLMTys>" %}

### **How to show/hide traderbars**

[Trade visualization](broken://pages/-MPK22D6ur2Hz7Qu_2yL)

{% embed url="<https://youtu.be/UKh3viLMTys>" %}

### **How to change chart color**

[Color](broken://pages/-MPK21z4c7F0Ug-RS-5w)

{% embed url="<https://youtu.be/UKh3viLMTys>" %}

**How to change ActionBar**

[ActionBar](broken://pages/-MPd1sZL_g4LxWTwMSwB#actionbar)

{% embed url="<https://youtu.be/UKh3viLMTys>" %}

**General Chart Settings**

[Chart](broken://pages/-MPd1sZL_g4LxWTwMSwB#chart)

{% embed url="<https://youtu.be/UKh3viLMTys>" %}

## Chart Trading Strategies

### **How see symbol information**

[Creating and editing of instruments](broken://pages/-MPcs8Jypm_X7vpI3lhM#creating-and-editing-of-instruments)

{% embed url="<https://youtu.be/UKh3viLMTys>" %}

### **How to use Chart Trading Pad**

[Standard chart trading pad](broken://pages/-MPK21lKJCujeNjOpdc3)

{% embed url="<https://youtu.be/ghxFIE6y-nI>" %}

### **How to open Trading Manager**

[Trades Manager](broken://pages/-MPcqVdVk6ZtVpIGFoCI#trades-manager)

{% embed url="<https://youtu.be/ghxFIE6y-nI>" %}

### **How to create order directly on a chart**

[Chart Trading](broken://pages/-MPK3MCnZkRIpwS6FLQq#Chart_Context_Menu__Chart_Trading)

{% embed url="<https://youtu.be/qoHlRWgTTyc>" %}

### **How to create IFDone connection**

[IfDone orders](broken://pages/-MPK3MCnZkRIpwS6FLQq#ifdone-orders)

{% embed url="<https://youtu.be/qoHlRWgTTyc>" %}

### **How to create OCO connection**

[OCO orders](broken://pages/-MPK3MCnZkRIpwS6FLQq#oco-orders)

{% embed url="<https://youtu.be/qoHlRWgTTyc>" %}

### **How to create ORO connection**

[ORO orders](broken://pages/-MPK3MCnZkRIpwS6FLQq#oro-orders)

{% embed url="<https://youtu.be/qoHlRWgTTyc>" %}

### **How to save order template**

[Orders templates](broken://pages/-MPK1no5ECi9bxUNE6HS)

{% embed url="<https://youtu.be/qoHlRWgTTyc>" %}

## Automated Trading Setup

### **Order Rounding**

[Order Rounding](broken://pages/-MPdPrRC4sY9NJ_OWOi5#at-plus-plus-order-rounding)

{% embed url="<https://youtu.be/F5M24O5DVb8>" %}

### **How to use Risk Management?**

[Risk Management](broken://pages/-MPdPrRC4sY9NJ_OWOi5#at-plus-plus-risk-management)

{% embed url="<https://youtu.be/F5M24O5DVb8>" %}

### **How to create analyzer session?**

[Analyzer session](broken://pages/-MPdPm7DhOQdB0qSBK1o#create-a-new-analyzer-session)

{% embed url="<https://youtu.be/F5M24O5DVb8?t=1780>" %}

### **How to activate signals?**

[Activation tab](broken://pages/-MPdPm7DhOQdB0qSBK1o#Setup_Escort__Activation_tab)

{% embed url="<https://youtu.be/F5M24O5DVb8>" %}

### **How to configure signals?**

[Configuration tab](broken://pages/-MPdPm7DhOQdB0qSBK1o#Setup_Escort__Configuration_tab)

{% embed url="<https://youtu.be/F5M24O5DVb8>" %}

### **Additional signal parameters**

[Parameters tab](broken://pages/-MPdPm7DhOQdB0qSBK1o#Setup_Escort__Parameters_tab)

{% embed url="<https://youtu.be/F5M24O5DVb8>" %}

### **How to set automated strategy?**

[Parameters tab](broken://pages/-MPdPm7DhOQdB0qSBK1o#Setup_Escort__Parameters_tab)

{% embed url="<https://youtu.be/F5M24O5DVb8>" %}

### **How to add analyzer?**

[Add Analyzer](broken://pages/-MPK5xJX39M__5srt4UD#add-analyzer)

{% embed url="<https://youtu.be/F5M24O5DVb8?t=2666>" %}

### **HardTrail and Softrail stops**

[Automatic stop movement](broken://pages/-MPF-Kq_WY8zI_kn104N)

{% embed url="<https://youtu.be/F5M24O5DVb8?t=2886>" %}

### **How to add Trading Setups on an Actionbar?**

[Action bar](broken://pages/-MPKBiP6g6FrQI0S8YoX)

{% embed url="<https://youtu.be/F5M24O5DVb8?t=3624>" %}

## DOM/QuickTrader

### **DOM Requirements**

[DOM](broken://pages/-MPci25oppircYmzHlvT)

{% embed url="<https://youtu.be/JXdJRELCmDU>" %}

### **How to open DOM**

[DOM](broken://pages/-MPci25oppircYmzHlvT)

{% embed url="<https://youtu.be/JXdJRELCmDU>" %}

### **What kind of orders display in Order Book**

[Submission of orders via DOM](broken://pages/-MPci25oppircYmzHlvT#Submission_of_orders_via_DOM)

{% embed url="<https://youtu.be/JXdJRELCmDU>" %}

### **How to change DOM Properties**

[DOM - context menu](broken://pages/-MPci25oppircYmzHlvT#dom-context-menu)

{% embed url="<https://youtu.be/JXdJRELCmDU>" %}

### **How to change Time & Sales Properties**

&#x20;[Times & Sales](broken://pages/-MPci2-tPszIffEIboa5)

{% embed url="<https://youtu.be/JXdJRELCmDU>" %}

### **How to add quantity Alerts**

[Quantity Alerts](broken://pages/-MPci25oppircYmzHlvT#dom-context-menu)

{% embed url="<https://youtu.be/JXdJRELCmDU>" %}

### **How to set discretionary orders via DOM**

[Orders via DOM](broken://pages/-MPci25oppircYmzHlvT#Submission_of_orders_via_DOM)

{% embed url="<https://youtu.be/JXdJRELCmDU>" %}

### **How to set AT++ orders via DOM**

[AT++ orders via DOM](broken://pages/-MPci25oppircYmzHlvT#Submission_of_orders_via_DOM)

{% embed url="<https://youtu.be/JXdJRELCmDU>" %}

### **How to open Quick Trader**

[QuickTrade](broken://pages/-MPKBiP6g6FrQI0S8YoX#ActionBar__Quick_Trader__en_)

{% embed url="<https://youtu.be/JXdJRELCmDU>" %}

### **How to change Quick Trader color**

[QuickTrader settings](broken://pages/-MPKBiP6g6FrQI0S8YoX#quicktrader-settings)

{% embed url="<https://youtu.be/JXdJRELCmDU>" %}

## Chart Trading Strategies

### **How see symbol information**

[Creating and editing of instruments](broken://pages/-MPcs8Jypm_X7vpI3lhM#creating-and-editing-of-instruments)

{% embed url="<https://youtu.be/UKh3viLMTys>" %}

### **How to use Chart Trading Pad**

[Standard chart trading pad](broken://pages/-MPK21lKJCujeNjOpdc3)

{% embed url="<https://youtu.be/ghxFIE6y-nI>" %}

### **How to open Trading Manager**

[Trades Manager](broken://pages/-MPcqVdVk6ZtVpIGFoCI#trades-manager)

{% embed url="<https://youtu.be/ghxFIE6y-nI>" %}

### **How to create order directly on a chart**

[Chart Trading](broken://pages/-MPK3MCnZkRIpwS6FLQq#Chart_Context_Menu__Chart_Trading)

{% embed url="<https://youtu.be/qoHlRWgTTyc>" %}

### **How to create IFDone connection**

[IfDone orders](broken://pages/-MPK3MCnZkRIpwS6FLQq#ifdone-orders)

{% embed url="<https://youtu.be/qoHlRWgTTyc>" %}

### **How to create OCO connection**

[OCO orders](broken://pages/-MPK3MCnZkRIpwS6FLQq#oco-orders)

{% embed url="<https://youtu.be/qoHlRWgTTyc>" %}

### **How to create ORO connection**

[ORO orders](broken://pages/-MPK3MCnZkRIpwS6FLQq#oro-orders)

{% embed url="<https://youtu.be/qoHlRWgTTyc>" %}

### **How to save order template**

[Orders templates](broken://pages/-MPK1no5ECi9bxUNE6HS)

{% embed url="<https://youtu.be/qoHlRWgTTyc>" %}

## Automated Trading Setup

### **Order Rounding**

[Order Rounding](broken://pages/-MPdPrRC4sY9NJ_OWOi5#at-plus-plus-order-rounding)

{% embed url="<https://youtu.be/F5M24O5DVb8>" %}

### **How to use Risk Management?**

[Risk Management](broken://pages/-MPdPrRC4sY9NJ_OWOi5#at-plus-plus-risk-management)

{% embed url="<https://youtu.be/F5M24O5DVb8>" %}

### **How to create analyzer session?**

[Analyzer session](broken://pages/-MPdPm7DhOQdB0qSBK1o#create-a-new-analyzer-session)

{% embed url="<https://youtu.be/F5M24O5DVb8?t=1780>" %}

### **How to activate signals?**

[Activation tab](broken://pages/-MPdPm7DhOQdB0qSBK1o#Setup_Escort__Activation_tab)

{% embed url="<https://youtu.be/F5M24O5DVb8>" %}

### **How to configure signals?**

[Configuration tab](broken://pages/-MPdPm7DhOQdB0qSBK1o#Setup_Escort__Configuration_tab)

{% embed url="<https://youtu.be/F5M24O5DVb8>" %}

### **Additional signal parameters**

[Parameters tab](broken://pages/-MPdPm7DhOQdB0qSBK1o#Setup_Escort__Parameters_tab)

{% embed url="<https://youtu.be/F5M24O5DVb8>" %}

### **How to set automated strategy?**

[Parameters tab](broken://pages/-MPdPm7DhOQdB0qSBK1o#Setup_Escort__Parameters_tab)

{% embed url="<https://youtu.be/F5M24O5DVb8>" %}

### **How to add analyzer?**

[Add Analyzer](broken://pages/-MPK5xJX39M__5srt4UD#add-analyzer)

{% embed url="<https://youtu.be/F5M24O5DVb8?t=2666>" %}

### **HardTrail and Softrail stops**

[Automatic stop movement](broken://pages/-MPF-Kq_WY8zI_kn104N)

{% embed url="<https://youtu.be/F5M24O5DVb8?t=2886>" %}

### **How to add Trading Setups on an Actionbar?**

[Action bar](broken://pages/-MPKBiP6g6FrQI0S8YoX)

{% embed url="<https://youtu.be/F5M24O5DVb8?t=3624>" %}

## DOM/QuickTrader

### **DOM Requirements**

[DOM](broken://pages/-MPci25oppircYmzHlvT)

{% embed url="<https://youtu.be/JXdJRELCmDU>" %}

### **How to open DOM**

[DOM](broken://pages/-MPci25oppircYmzHlvT)

{% embed url="<https://youtu.be/JXdJRELCmDU>" %}

### **What kind of orders display in Order Book**

[Submission of orders via DOM](broken://pages/-MPci25oppircYmzHlvT#Submission_of_orders_via_DOM)

{% embed url="<https://youtu.be/JXdJRELCmDU>" %}

### **How to change DOM Properties**

[DOM - context menu](broken://pages/-MPci25oppircYmzHlvT#dom-context-menu)

{% embed url="<https://youtu.be/JXdJRELCmDU>" %}

### **How to change Time & Sales Properties**

&#x20;[Times & Sales](broken://pages/-MPci2-tPszIffEIboa5)

{% embed url="<https://youtu.be/JXdJRELCmDU>" %}

### **How to add quantity Alerts**

[Quantity Alerts](broken://pages/-MPci25oppircYmzHlvT#dom-context-menu)

{% embed url="<https://youtu.be/JXdJRELCmDU>" %}

### **How to set discretionary orders via DOM**

[Orders via DOM](broken://pages/-MPci25oppircYmzHlvT#Submission_of_orders_via_DOM)

{% embed url="<https://youtu.be/JXdJRELCmDU>" %}

### **How to set AT++ orders via DOM**

[AT++ orders via DOM](broken://pages/-MPci25oppircYmzHlvT#Submission_of_orders_via_DOM)

{% embed url="<https://youtu.be/JXdJRELCmDU>" %}

### **How to open Quick Trader**

[QuickTrade](broken://pages/-MPKBiP6g6FrQI0S8YoX#ActionBar__Quick_Trader__en_)

{% embed url="<https://youtu.be/JXdJRELCmDU>" %}

### **How to change Quick Trader color**

[QuickTrader settings](broken://pages/-MPKBiP6g6FrQI0S8YoX#quicktrader-settings)

{% embed url="<https://youtu.be/JXdJRELCmDU>" %}


# AgenaTrader Docs

[![](https://docs.agenatrader.com/~gitbook/image?url=https%3A%2F%2F3673777109-files.gitbook.io%2F%7E%2Ffiles%2Fv0%2Fb%2Fgitbook-legacy-files%2Fo%2Fspaces%252F-MKZSsJBtSP9L4sqIe_q%252Favatar-1603708754963.png%3Fgeneration%3D1603708755243547%26alt%3Dmedia\&width=32\&dpr=4\&quality=100\&sign=6945c896\&sv=2)![](https://docs.agenatrader.com/~gitbook/image?url=https%3A%2F%2F3673777109-files.gitbook.io%2F%7E%2Ffiles%2Fv0%2Fb%2Fgitbook-legacy-files%2Fo%2Fspaces%252F-MKZSsJBtSP9L4sqIe_q%252Favatar-1603708754963.png%3Fgeneration%3D1603708755243547%26alt%3Dmedia\&width=32\&dpr=4\&quality=100\&sign=6945c896\&sv=2)AgenaTrader Docs](https://docs.agenatrader.com/)English[English](https://docs.agenatrader.com/introduction/video-guide?fallback=true)[German](https://docs.agenatrader.com/german/introduction/video-guide?fallback=true)[Home](https://docs.agenatrader.com/)[Indicators](https://indicators.agenatrader.com/)[AgenaScript](https://script.agenatrader.com/)[Release Notes](https://release.agenatrader.com/)[Home](https://docs.agenatrader.com/)[Indicators](https://indicators.agenatrader.com/)[AgenaScript](https://script.agenatrader.com/)[Release Notes](https://release.agenatrader.com/)

1. INTRODUCTION

### Video Guide

In order to save your time, we create the summary table for each educational video. It includes most common questions. Left click on video player opposite selected question will lead you YouTube video on exact second the answer is. Now you have no need to watch the full video. In addition, you may find the link to the wiki article with answers.

### Download and Installation <a href="#download-and-installation" id="download-and-installation"></a>

#### **Where should I download Agenatrader?** <a href="#where-should-i-download-agenatrader" id="where-should-i-download-agenatrader"></a>

Download and installation

#### **System Requierements** <a href="#system-requierements" id="system-requierements"></a>

Hardware and system requirements

#### **How to install Agenatrader** <a href="#how-to-install-agenatrader" id="how-to-install-agenatrader"></a>

Download and installation

#### **How to check type of operation system** <a href="#how-to-check-type-of-operation-system" id="how-to-check-type-of-operation-system"></a>

Hardware and system requirements

#### **How to activate AgenaTrader** <a href="#how-to-activate-agenatrader" id="how-to-activate-agenatrader"></a>

License activation

#### **How to get demo key** <a href="#how-to-get-demo-key" id="how-to-get-demo-key"></a>

[Demo Request](about:/faq/frequently-asked-questions/license-activation#demo-request)

#### **How to setup demo datafeed /broker** <a href="#how-to-setup-demo-datafeed-broker" id="how-to-setup-demo-datafeed-broker"></a>

Simulated account

#### **How to connect/ disconnect datafeed or broker** <a href="#how-to-connect-disconnect-datafeed-or-broker" id="how-to-connect-disconnect-datafeed-or-broker"></a>

Connections

#### **Do we sell market data or brokerage services** <a href="#do-we-sell-market-data-or-brokerage-services" id="do-we-sell-market-data-or-brokerage-services"></a>

Opening a trading account through us

#### **History length you can get from datafeed vendor** <a href="#history-length-you-can-get-from-datafeed-vendor" id="history-length-you-can-get-from-datafeed-vendor"></a>

Show All History

#### **Brokers we support** <a href="#brokers-we-support" id="brokers-we-support"></a>

Broker and Datafeeds Connections

#### **Datafeed we support** <a href="#datafeed-we-support" id="datafeed-we-support"></a>

Broker and Datafeeds Connections

#### **How to add new Account** <a href="#how-to-add-new-account" id="how-to-add-new-account"></a>

Account connections

#### **How to connect two datafeeds simultaneosly** <a href="#how-to-connect-two-datafeeds-simultaneosly" id="how-to-connect-two-datafeeds-simultaneosly"></a>

Account connections

### Chart Types <a href="#chart-types" id="chart-types"></a>

#### **How to open Simple Chart** <a href="#how-to-open-simple-chart" id="how-to-open-simple-chart"></a>

[Single Chart](about:/main/chart-area/chart-container/chart-container#single-chart)

#### **How to open Single Chart Group** <a href="#how-to-open-single-chart-group" id="how-to-open-single-chart-group"></a>

[Single Chart Group](about:/main/chart-area/chart-container/chart-container#single-chart-group)

#### **How to open List Chart Group** <a href="#how-to-open-list-chart-group" id="how-to-open-list-chart-group"></a>

[List Chart Group](about:/main/chart-area/chart-container/chart-container#Chart_Container__List_Chart_Group)

#### **How to open TabChart Group** <a href="#how-to-open-tabchart-group" id="how-to-open-tabchart-group"></a>

[Tab Chart Group](about:/main/chart-area/chart-container/chart-container#Chart_Container__Tab_Chart_Group)

#### **How to open Chart Gallery** <a href="#how-to-open-chart-gallery" id="how-to-open-chart-gallery"></a>

[Chart Gallery](about:/main/chart-area/chart-container/chart-container#Chart_Container__Chart_Gallery)

#### **Dynamic Scanner** <a href="#dynamic-scanner" id="dynamic-scanner"></a>

[Dynamic Scanner](about:/main/chart-area/chart-container/chart-container#dynamic-scanner)

#### **How to add new symbol to List Chart Group** <a href="#how-to-add-new-symbol-to-list-chart-group" id="how-to-add-new-symbol-to-list-chart-group"></a>

[Dynamic Scanner](about:/main/chart-area/chart-container/chart-container#dynamic-scanner)

### Chart Toolbar <a href="#chart-toolbar" id="chart-toolbar"></a>

#### **How to create own workspace** <a href="#how-to-create-own-workspace" id="how-to-create-own-workspace"></a>

Workspace menu

#### **How to add Alerts on a chart** <a href="#how-to-add-alerts-on-a-chart" id="how-to-add-alerts-on-a-chart"></a>

[Add Alerts](about:/main/chart-area/untitled/chart-context-menu#add-price-alert)

#### **How to open Instrument Editor** <a href="#how-to-open-instrument-editor" id="how-to-open-instrument-editor"></a>

Instrument Editor

#### **How to change TimeFrame** <a href="#how-to-change-timeframe" id="how-to-change-timeframe"></a>

Time frame

#### **How to add more instruments into one chart** <a href="#how-to-add-more-instruments-into-one-chart" id="how-to-add-more-instruments-into-one-chart"></a>

Multidata

#### **How to change Chart style** <a href="#how-to-change-chart-style" id="how-to-change-chart-style"></a>

Price style

#### **How to add Drawing Object** <a href="#how-to-add-drawing-object" id="how-to-add-drawing-object"></a>

Drawing objects

#### **How to add Indicators** <a href="#how-to-add-indicators" id="how-to-add-indicators"></a>

Indicators

#### **How to start strategy** <a href="#how-to-start-strategy" id="how-to-start-strategy"></a>

Start AgenaTrader (plusplus)

#### **How to add symbol to instrument list** <a href="#how-to-add-symbol-to-instrument-list" id="how-to-add-symbol-to-instrument-list"></a>

Add to instrument list

#### **How to add Price Markers and Lines** <a href="#how-to-add-price-markers-and-lines" id="how-to-add-price-markers-and-lines"></a>

Price markers and spread markers

#### **How to show/hide traderbars** <a href="#how-to-show-hide-traderbars" id="how-to-show-hide-traderbars"></a>

Trade visualization

#### **How to change chart color** <a href="#how-to-change-chart-color" id="how-to-change-chart-color"></a>

Color

**How to change ActionBar**

[ActionBar](about:/tools/configuration-escort#actionbar)

**General Chart Settings**

[Chart](about:/tools/configuration-escort#chart)

### Chart Trading Strategies <a href="#chart-trading-strategies" id="chart-trading-strategies"></a>

#### **How see symbol information** <a href="#how-see-symbol-information" id="how-see-symbol-information"></a>

[Creating and editing of instruments](about:/tools/instrument-escort#creating-and-editing-of-instruments)

#### **How to use Chart Trading Pad** <a href="#how-to-use-chart-trading-pad" id="how-to-use-chart-trading-pad"></a>

Standard chart trading pad

#### **How to open Trading Manager** <a href="#how-to-open-trading-manager" id="how-to-open-trading-manager"></a>

[Trades Manager](about:/tools/trading-information#trades-manager)

#### **How to create order directly on a chart** <a href="#how-to-create-order-directly-on-a-chart" id="how-to-create-order-directly-on-a-chart"></a>

[Chart Trading](about:/main/chart-area/untitled/chart-context-menu#Chart_Context_Menu__Chart_Trading)

#### **How to create IFDone connection** <a href="#how-to-create-ifdone-connection" id="how-to-create-ifdone-connection"></a>

[IfDone orders](about:/main/chart-area/untitled/chart-context-menu#ifdone-orders)

#### **How to create OCO connection** <a href="#how-to-create-oco-connection" id="how-to-create-oco-connection"></a>

[OCO orders](about:/main/chart-area/untitled/chart-context-menu#oco-orders)

#### **How to create ORO connection** <a href="#how-to-create-oro-connection" id="how-to-create-oro-connection"></a>

[ORO orders](about:/main/chart-area/untitled/chart-context-menu#oro-orders)

#### **How to save order template** <a href="#how-to-save-order-template" id="how-to-save-order-template"></a>

Orders templates

### Automated Trading Setup <a href="#automated-trading-setup" id="automated-trading-setup"></a>

#### **Order Rounding** <a href="#order-rounding" id="order-rounding"></a>

[Order Rounding](about:/create-your-own-trading-strategy/at-plusplus-manager#at-plus-plus-order-rounding)

#### **How to use Risk Management?** <a href="#how-to-use-risk-management" id="how-to-use-risk-management"></a>

[Risk Management](about:/create-your-own-trading-strategy/at-plusplus-manager#at-plus-plus-risk-management)

#### **How to create analyzer session?** <a href="#how-to-create-analyzer-session" id="how-to-create-analyzer-session"></a>

[Analyzer session](about:/create-your-own-trading-strategy/setup-escort#create-a-new-analyzer-session)

#### **How to activate signals?** <a href="#how-to-activate-signals" id="how-to-activate-signals"></a>

[Activation tab](about:/create-your-own-trading-strategy/setup-escort#Setup_Escort__Activation_tab)

#### **How to configure signals?** <a href="#how-to-configure-signals" id="how-to-configure-signals"></a>

[Configuration tab](about:/create-your-own-trading-strategy/setup-escort#Setup_Escort__Configuration_tab)

#### **Additional signal parameters** <a href="#additional-signal-parameters" id="additional-signal-parameters"></a>

[Parameters tab](about:/create-your-own-trading-strategy/setup-escort#Setup_Escort__Parameters_tab)

#### **How to set automated strategy?** <a href="#how-to-set-automated-strategy" id="how-to-set-automated-strategy"></a>

[Parameters tab](about:/create-your-own-trading-strategy/setup-escort#Setup_Escort__Parameters_tab)

#### **How to add analyzer?** <a href="#how-to-add-analyzer" id="how-to-add-analyzer"></a>

[Add Analyzer](about:/main/chart-area/realtime-scanner/scanner-settings#add-analyzer)

#### **HardTrail and Softrail stops** <a href="#hardtrail-and-softrail-stops" id="hardtrail-and-softrail-stops"></a>

Automatic stop movement

#### **How to add Trading Setups on an Actionbar?** <a href="#how-to-add-trading-setups-on-an-actionbar" id="how-to-add-trading-setups-on-an-actionbar"></a>

Action bar

### DOM/QuickTrader <a href="#dom-quicktrader" id="dom-quicktrader"></a>

#### **DOM Requirements** <a href="#dom-requirements" id="dom-requirements"></a>

DOM

#### **How to open DOM** <a href="#how-to-open-dom" id="how-to-open-dom"></a>

DOM

#### **What kind of orders display in Order Book** <a href="#what-kind-of-orders-display-in-order-book" id="what-kind-of-orders-display-in-order-book"></a>

[Submission of orders via DOM](about:/main/main-menu/dom#Submission_of_orders_via_DOM)

#### **How to change DOM Properties** <a href="#how-to-change-dom-properties" id="how-to-change-dom-properties"></a>

[DOM - context menu](about:/main/main-menu/dom#dom-context-menu)

#### **How to change Time & Sales Properties** <a href="#how-to-change-time-and-sales-properties" id="how-to-change-time-and-sales-properties"></a>

Times & Sales

#### **How to add quantity Alerts** <a href="#how-to-add-quantity-alerts" id="how-to-add-quantity-alerts"></a>

[Quantity Alerts](about:/main/main-menu/dom#dom-context-menu)

#### **How to set discretionary orders via DOM** <a href="#how-to-set-discretionary-orders-via-dom" id="how-to-set-discretionary-orders-via-dom"></a>

[Orders via DOM](about:/main/main-menu/dom#Submission_of_orders_via_DOM)

#### **How to set AT++ orders via DOM** <a href="#how-to-set-at-orders-via-dom" id="how-to-set-at-orders-via-dom"></a>

[AT++ orders via DOM](about:/main/main-menu/dom#Submission_of_orders_via_DOM)

#### **How to open Quick Trader** <a href="#how-to-open-quick-trader" id="how-to-open-quick-trader"></a>

[QuickTrade](about:/main/chart-area/actionbar#ActionBar__Quick_Trader__en_)

#### **How to change Quick Trader color** <a href="#how-to-change-quick-trader-color" id="how-to-change-quick-trader-color"></a>

[QuickTrader settings](about:/main/chart-area/actionbar#quicktrader-settings)

**How to set orders via QuickTrader**

[QuickTrader](about:/main/chart-area/actionbar#ActionBar__Quick_Trader__en_)

Last updated 1 month ago

***


# Glossary

### **Common terms** <a href="#common_terms" id="common_terms"></a>

| Name                           | Definition                                                                                                                                                                                                                                                                                       | Url                                                                                                                        |
| ------------------------------ | ------------------------------------------------------------------------------------------------------------------------------------------------------------------------------------------------------------------------------------------------------------------------------------------------ | -------------------------------------------------------------------------------------------------------------------------- |
| Ask                            | Ask price, also called offer price, offer, asking price, or simply ask, is the price a seller states they will accept.                                                                                                                                                                           | [**Link**](https://en.wikipedia.org/wiki/Ask_price)                                                                        |
| Asset                          | Fixed assets, capital investment                                                                                                                                                                                                                                                                 | [**Link**](https://en.wikipedia.org/wiki/Asset)                                                                            |
| Bearish                        | Investors expect downward price movement                                                                                                                                                                                                                                                         | [**Link**](https://en.wikipedia.org/wiki/Market_sentiment)                                                                 |
| Bid                            | A bid price is the highest price that a buyer (i.e., bidder) is willing to pay for a good                                                                                                                                                                                                        | [**Link**](https://en.wikipedia.org/wiki/Bid_price)                                                                        |
| Bullish                        | Investors expect upward price movement in the stock market                                                                                                                                                                                                                                       | [**Link**](https://en.wikipedia.org/wiki/Market_sentiment)                                                                 |
| CFD ( contract for difference) | The contract between two parties, typically described as "buyer" and "seller", stipulating that the seller will pay to the buyer the difference between the current value of an asset and its value at contract time (if the difference is negative, then the buyer pays instead to the seller). | [**Link**](https://en.wikipedia.org/wiki/Contract_for_difference)                                                          |
| Closing price                  | The last level at which asset was traded on any given day.                                                                                                                                                                                                                                       | [**Link**](https://www.investopedia.com/terms/c/closingprice.asp)                                                          |
| Commission                     | Commission is the charge levied by an investment broker for making trades on a trader’s behalf.                                                                                                                                                                                                  | [**Link**](https://www.investopedia.com/terms/c/commission.asp?ad=dirN\&qo=investopediaSiteSearch\&qsrc=0\&o=40186)        |
| Currency                       | Money in any form when in actual use or circulation as a medium of exchange, especially circulating banknotes and coins.                                                                                                                                                                         | [**Link**](https://en.wikipedia.org/wiki/Stock)                                                                            |
| Derivative                     | Contract that derives its value from the performance of an underlying entity.                                                                                                                                                                                                                    | [**Link**](https://en.wikipedia.org/wiki/Derivative_\(finance\))                                                           |
| Dividend                       | Payment made by a corporation to its shareholders, usually as a distribution of profits                                                                                                                                                                                                          | [**Link**](https://en.wikipedia.org/wiki/Dividend)                                                                         |
| Dow Jones Index                | Reflects the performance of 30 of the most significant stocks on the American stock exchanges.                                                                                                                                                                                                   | [**Link**](https://en.wikipedia.org/wiki/Dow_Jones_index)                                                                  |
| ETF                            | The investment fund traded on stock exchanges, much like stocks.                                                                                                                                                                                                                                 | [**Link**](https://en.wikipedia.org/wiki/Exchange-traded_fund)                                                             |
| Exchange                       | The marketplace in which securities, commodities, derivatives and other financial instruments are traded.                                                                                                                                                                                        | [**Link**](https://en.wikipedia.org/wiki/Stock_exchange)                                                                   |
| Expiry date                    | The point when a trading position automatically closes is known as the expiry date                                                                                                                                                                                                               | [**Link**](https://docs.agenatrader.com/tools/instrument-escort#Instrument_Escort__Futures_contract_rollover)              |
| Forex                          | The market in which currencies are traded                                                                                                                                                                                                                                                        | [**Link**](https://en.wikipedia.org/wiki/Foreign_exchange_market)                                                          |
| Futures contract               | The contract between two parties where both parties agree to buy and sell a particular asset of specific quantity and at a predetermined price, at a specified date in future.                                                                                                                   | [**Link**](https://docs.agenatrader.com/tools/instrument-escort#Instrument_Escort__Futures_contract_rollover)              |
| Index                          | Statistical composite that measures changes in the economy or in financial markets, often expressed in percentage changes from a base year or from the previous month.                                                                                                                           | [**Link**](http://www.nasdaq.com/investing/glossary/i/index)                                                               |
| Inflation                      | General increase in prices and fall in the purchasing value of money                                                                                                                                                                                                                             | [**Link**](https://en.wikipedia.org/wiki/Leverage_\(finance\))                                                             |
| Investors                      | The person that allocates capital with the expectation of a future financial return                                                                                                                                                                                                              | [**Link**](https://en.wikipedia.org/wiki/Investor)                                                                         |
| Leverage                       | The ratio of a company's loan capital (debt) to the value of its ordinary shares                                                                                                                                                                                                                 | [**Link**](https://en.wikipedia.org/wiki/Investor)                                                                         |
| Mappings                       | Symbol name which can be different for different datafeeds and brokers                                                                                                                                                                                                                           | [**Link**](https://docs.agenatrader.com/tools/instrument-escort#creating-and-editing-of-instruments)                       |
| Margin                         | The sum deposited with a broker to cover the risk of loss on a transaction or account                                                                                                                                                                                                            | [**Link**](https://docs.agenatrader.com/tools/instrument-escort#Inconsistent_information_from_a_broker_data_feed_provider) |
| Market data                    | Is price and trade-related data for a financial instrument reported by a trading venue such as a stock exchange.                                                                                                                                                                                 | [**Link**](https://en.wikipedia.org/wiki/Market_data)                                                                      |
| Option                         | Contract which gives the buyer (the owner or holder of the option) the right, but not the obligation, to buy or sell an underlying asset or instrument at a specified strike price on a specified date, depending on the form of the option.                                                     | [**Link**](https://en.wikipedia.org/wiki/Option_\(finance\))                                                               |
| Risk                           | Possibility that shareholders will lose money on a trade                                                                                                                                                                                                                                         | [**Link**](https://docs.agenatrader.com/create-your-own-trading-strategy/at-plusplus-manager#at-plus-plus-risk-management) |
| Rollover                       | Means keeping a position open beyond its expiry.                                                                                                                                                                                                                                                 | [**Link**](https://docs.agenatrader.com/tools/instrument-escort#Instrument_Escort__Futures_contract_rollover)              |
| Stock                          | The stock (also capital stock) of a corporation is constituted of the equity stock of its owners.                                                                                                                                                                                                | [**Link**](https://en.wikipedia.org/wiki/Stock)                                                                            |
| Trading Strategy               | Fixed plan that is designed to achieve a profitable return by going long or short in markets.                                                                                                                                                                                                    | [**Link**](https://en.wikipedia.org/wiki/Trading_strategy)                                                                 |
| ISIN                           | The International Securities Identification Number (ISIN) is a code that uniquely identifies a specific securities issue.                                                                                                                                                                        | [**Link**](https://docs.agenatrader.com/tools/instrument-escort#creating-and-editing-of-instruments)                       |
| Workspace                      | Current display of all tabs, charts and further content you have arranged in a specific template                                                                                                                                                                                                 | [**Link**](https://docs.agenatrader.com/main/main-menu/workspace-menu)                                                     |

### **AgenaTrader functions** <a href="#agenatrader_functions" id="agenatrader_functions"></a>

| Name                      | Definition                                                                                                                                                    | Url                                                                                                           |
| ------------------------- | ------------------------------------------------------------------------------------------------------------------------------------------------------------- | ------------------------------------------------------------------------------------------------------------- |
| ActionBar                 | Function which located on the right hand side of the chart and is equipped with various functions to improve trading management.                              | [**Link**](https://docs.agenatrader.com/main/chart-area/actionbar)                                            |
| Alerts                    | Allow User to set criteria and be notified that criteria has been met immediately                                                                             | [**Link**](https://docs.agenatrader.com/tools/tools#Alerts)                                                   |
| Analyzer Column           | Advanced scanner column that searches for conditions/signals that were activated via the Setup Builder in hundreds of instruments simultaneously.             | [**Link**](https://docs.agenatrader.com/create-your-own-trading-strategy/setup-escort#analyzer-escort-column) |
| Backtest                  | The key feature for analyzing the performance of a strategy on a historical basis.                                                                            | [**Link**](https://docs.agenatrader.com/main/main-menu/backtest)                                              |
| Signal Builder            | Allows you to create complex conditions/signals for scans with the scanner and Analyzer Column.                                                               | [**Link**](https://docs.agenatrader.com/create-your-own-trading-strategy/condition-escort)                    |
| Correlation Matrix        | Compare the performance of individual instruments and even whole instrument lists in real-time.timeframe.                                                     | [**Link**](https://docs.agenatrader.com/main/main-menu/correlation-matrix)                                    |
| Part Trades               | Means trading setup which includes more than one stop or target                                                                                               | [**Link**](https://docs.agenatrader.com/tools/trading-information#part-trades)                                |
| Price Style               | Bars style on a chart                                                                                                                                         | [**Link**](https://docs.agenatrader.com/main/chart-area/untitled/price-styles)                                |
| Quick Trader              | Allows the user to quickly enter orders and strategies directly on the chart.                                                                                 | [**Link**](https://docs.agenatrader.com/main/chart-area/actionbar#ActionBar__Quick_Trader__en_)               |
| Bid/Ask Spread            | The difference between the bid and offer price, and the most widely used measure of liquidity.                                                                | [**Link**](https://docs.agenatrader.com/main/chart-area/untitled/price-markers-and-spread-markers)            |
| Record and Replay Escort  | Record market data from a currently ongoing operation and replay later when necessary.                                                                        | [**Link**](https://docs.agenatrader.com/tools/tools#record-and-replay-escort)                                 |
| Instrument Editor         | Feature that helps you to manage instruments and instrument lists.                                                                                            | [**Link**](https://docs.agenatrader.com/tools/instrument-escort)                                              |
| Stock EOD Screener        | Use to scan for around 7000 US stocks according to the fundamental and technical criteria                                                                     | [**Link**](https://docs.agenatrader.com/main/main-menu/fundamental-screener#Stock_EOD_screener)               |
| Scripted                  | Self programmed Indicator, condition, etc                                                                                                                     | [**Link**](https://docs.agenatrader.com/create-your-own-trading-strategy/scripting)                           |
| DOM (Depth of the market) | Provides insights of current market depth provides by your data-feed provider/broker if level 2 data is enabled. It allows you to place orders in the market. | [**Link**](https://docs.agenatrader.com/main/main-menu/dom)                                                   |
| Dynamic Scanner           | Automatically collects all available signals that are active in one of your opened watch lists and charts as well as Analyzer Column columns.                 | [**Link**](https://docs.agenatrader.com/main/chart-area/chart-container/chart-container#dynamic-scanner)      |

#### **Order types and setups** <a href="#order_types_and_setups" id="order_types_and_setups"></a>

| Name                    | Definition                                                                                                                                               | Url                                                                                                                    |
| ----------------------- | -------------------------------------------------------------------------------------------------------------------------------------------------------- | ---------------------------------------------------------------------------------------------------------------------- |
| Order                   | Purchase or sell a security through the broker                                                                                                           | [**Link**](https://en.wikipedia.org/wiki/Order_\(business\))                                                           |
| Long                    | OrderBuy a security through the broker                                                                                                                   | [**Link**](https://docs.agenatrader.com/main/chart-area/untitled/chart-context-menu#Chart_Context_Menu__Chart_Trading) |
| Short                   | orderSell a security through the broker                                                                                                                  | [**Link**](https://docs.agenatrader.com/main/chart-area/untitled/chart-context-menu#Chart_Context_Menu__Chart_Trading) |
| Market                  | orderA market order is a buy or sell order to be executed immediately at current market prices.                                                          | [**Link**](https://docs.agenatrader.com/main/chart-area/order-escort#Order_types)                                      |
| Limit                   | orderA limit order is an order to buy a security at no more than a specific price, or to sell a security at no less than a specific price                | [**Link**](https://docs.agenatrader.com/main/chart-area/order-escort#Order_types)                                      |
| Stop order              | Buy or Sell becomes active only after a specified price level has been reached                                                                           | [**Link**](https://docs.agenatrader.com/main/chart-area/order-escort#Order_types)                                      |
| Stop Limit order        | Characterized by automatic submission of the limit order (market) to the market (order book) as far as the predefined stop limit price level is reached. | [**Link**](https://docs.agenatrader.com/main/chart-area/order-escort#Order_types)                                      |
| OCO (One cancels Other) | Once any order of a group is executed, the other orders belonging to this group will be deleted.                                                         | [**Link**](https://docs.agenatrader.com/main/chart-area/untitled/chart-context-menu#oco-orders)                        |
| IfDone Order            | Once any order of a group is executed, other orders belonging to this group will be submitted.                                                           | [**Link**](https://docs.agenatrader.com/main/chart-area/untitled/chart-context-menu#ifdone-orders)                     |
| ORO (One reduces Other) | Once any order of a group is executed, the size of the second order in this group will be reduced by the order volume of the first order.                | [**Link**](https://docs.agenatrader.com/main/chart-area/untitled/chart-context-menu#oro-orders)                        |
| Direct orders           | Direct orders are submitted to the broker. Once a direct order is placed on the market it will be located on the exchange.                               | [**Link**](https://docs.agenatrader.com/main/chart-area/order-escort#Direct_orders)                                    |
| Synthetic orders        | Synthetic orders are not forwarded to the exchange and remain locally placed on your computer.                                                           | [**Link**](https://docs.agenatrader.com/main/chart-area/order-escort#Synthetic_orders)                                 |
| Dynamic orders          | Dynamic order is a synthetic order that is only submitted when a „suspicion“ arises.                                                                     | [**Link**](https://docs.agenatrader.com/main/chart-area/order-escort#Dynamic_orders)                                   |
| Scale-in orders         | A scale-in order sends multiple orders (tranches) to the market until the desired position size is reached.                                              | [**Link**](https://docs.agenatrader.com/main/chart-area/order-escort#Scale-in_orders)                                  |
| GTC (Good til Cancel )  | "This order remains active until it is either rescinded by the investor or the trade is executed                                                         | [**Link**](https://docs.agenatrader.com/main/chart-area/untitled/standard-chart-trading-pad)                           |
| GTD (Good til Cancel)   | Order remains active until a user-specified date, unless it has been filled or canceled.                                                                 | [**Link**](https://docs.agenatrader.com/main/chart-area/untitled/standard-chart-trading-pad)                           |
| Day                     | This order automatically expires at the end of the regular trading session if it has not been executed.                                                  | [**Link**](https://docs.agenatrader.com/main/chart-area/untitled/standard-chart-trading-pad)                           |
| Out RTH                 | Allow execution of orders outside the regular trading hours                                                                                              | [**Link**](https://docs.agenatrader.com/main/chart-area/untitled/standard-chart-trading-pad)                           |

### **AT plus-plus** <a href="#at_plus-plus" id="at_plus-plus"></a>

| Name             | Definition                                                                                                                              | Url                                                                                                                        |
| ---------------- | --------------------------------------------------------------------------------------------------------------------------------------- | -------------------------------------------------------------------------------------------------------------------------- |
| AT++             | Semi-automated trading with trading setups                                                                                              | [**Link**](https://docs.agenatrader.com/create-your-own-trading-strategy/at-plusplus-manager)                              |
| Setup Builder    | Used to define, activate and deactivate fully functional setups with signals/conditions or manual setups.                               | [**Link**](https://docs.agenatrader.com/create-your-own-trading-strategy/setup-escort)                                     |
| Analyzer Session | Used to manage multiple trading strategies in different sessions.                                                                       | [**Link**](https://docs.agenatrader.com/create-your-own-trading-strategy/setup-escort#analyzer-sessions-1)                 |
| Entry Order      | Used to enter a trade at a specified price level.                                                                                       | [**Link**](https://docs.agenatrader.com/create-your-own-trading-strategy/at-plusplus-manager#at-plus-plus-entries)         |
| HardStop         | Hard stops are the stop methods that are applied to the stop orders.                                                                    | [**Link**](https://docs.agenatrader.com/create-your-own-trading-strategy/setup-escort#Hard_Trail_stop)                     |
| SoftStop         | Soft stops do not close a trade immediately after being crossed by a closing price.                                                     | [**Link**](https://docs.agenatrader.com/create-your-own-trading-strategy/setup-escort#Soft_Trail)                          |
| Target           | Predetermined point at which an investor will exit a trade in a profitable position.                                                    | [**Link**](https://docs.agenatrader.com/create-your-own-trading-strategy/setup-escort#targetescorts)                       |
| Buying Power     | The total cash held in the brokerage account plus maximum margin available                                                              | [**Link**](https://docs.agenatrader.com/create-your-own-trading-strategy/at-plusplus-manager#at-plus-plus-risk-management) |
| Cash Value       | User cash held in the brokerage account                                                                                                 | [**Link**](https://docs.agenatrader.com/create-your-own-trading-strategy/at-plusplus-manager#at-plus-plus-risk-management) |
| Initial Stop     | In calculation this stop use initial stop method setting                                                                                | [**Link**](https://docs.agenatrader.com/create-your-own-trading-strategy/setup-escort#Initial_stop)                        |
| Risk/Trade       | Option allows you to set the percentage of the account that you wish to risk during the trade.                                          | [**Link**](https://docs.agenatrader.com/create-your-own-trading-strategy/at-plusplus-manager#at-plus-plus-risk-management) |
| Initial risk     | Used to predetermine maximum downside potential, which is usually the initial amount invested.                                          | [**Link**](https://docs.agenatrader.com/create-your-own-trading-strategy/at-plusplus-manager#at-plus-plus-risk-management) |
| Risk Amount      | Sets the absolute value that you are prepared to risk per trade                                                                         | [**Link**](https://docs.agenatrader.com/create-your-own-trading-strategy/at-plusplus-manager#at-plus-plus-risk-management) |
| Max. Invested %  | Define the maximum amount of buying power or cash value to be invested per trade                                                        | [**Link**](https://docs.agenatrader.com/create-your-own-trading-strategy/at-plusplus-manager#at-plus-plus-risk-management) |
| Daily Loss Limit | Sets the maximum amount of loss allowed for trades per day                                                                              | [**Link**](https://docs.agenatrader.com/create-your-own-trading-strategy/at-plusplus-manager#at-plus-plus-risk-management) |
| InitialStopOnly  | Allows you to submit an initial stop to the market. Select this if you do not want to use HardTrail StopEscort or SoftTrail StopEscort. | [**Link**](https://docs.agenatrader.com/create-your-own-trading-strategy/setup-escort#InitialStopOnly)                     |
| Risk             | In trading setup one risk is initial distance between Stop and Entry Order. Can be set to show your P\&L on chart trader bar            | [**Link**](https://docs.agenatrader.com/main/chart-area/untitled/chart-context-menu#Chart_traders_bars)                    |
| Strategies       | A set of objective rules defining the conditions that must be met for a trade entry and exit to occur.                                  | [**Link**](https://www.investopedia.com/terms/t/trading-strategy.asp?ad=dirN\&qo=investopediaSiteSearch\&qsrc=0\&o=40186)  |

### **Chart Container** <a href="#chart_container" id="chart_container"></a>

| Name                 | Definition                                                                                                                                    | Url                                                                                                                        |
| -------------------- | --------------------------------------------------------------------------------------------------------------------------------------------- | -------------------------------------------------------------------------------------------------------------------------- |
| Single Chart         | Displays one chart in one tab                                                                                                                 | [**Link**](https://docs.agenatrader.com/main/chart-area/chart-container/chart-container#single-chart)                      |
| Single Chart Group   | Displays multiple (up to four) charts of the same specified instrument in a charting area                                                     | [**Link**](https://docs.agenatrader.com/main/chart-area/chart-container/chart-container#single-chart-group)                |
| List Chart Group     | Allows you create a list based chart group includes a scanner and a charting area.                                                            | [**Link**](https://docs.agenatrader.com/main/chart-area/chart-container/chart-container#Chart_Container__List_Chart_Group) |
| Tab Chart Group      | Chart container that simultaneously opens multiple charts for various instruments and shows the symbols for instruments in the bottom tab bar | [**Link**](https://docs.agenatrader.com/main/chart-area/chart-container/chart-container#Chart_Container__Tab_Chart_Group)  |
| Single Chart Gallery | Allows to view one symbol in numerous time frames.                                                                                            | [**Link**](https://docs.agenatrader.com/main/chart-area/chart-container/chart-container#single-chart-gallery)              |
| List Chart Gallery   | Allows you create a list based chart gallery where you can view multiple symbols in numerous time periods                                     | [**Link**](https://docs.agenatrader.com/main/chart-area/chart-container/chart-container#list-chart-gallery)                |
| Tab Chart Gallery    | Allows you to create a tab based chart gallery where you can view multiple symbols in numerous time periods                                   | [**Link**](https://docs.agenatrader.com/main/chart-area/chart-container/chart-container#tab-chart-gallery)                 |

### **Chart Types** <a href="#chart_types" id="chart_types"></a>

| Name                    | Definition                                                                                                                  | Url                                                                                                         |
| ----------------------- | --------------------------------------------------------------------------------------------------------------------------- | ----------------------------------------------------------------------------------------------------------- |
| Candle chart            | Display the following information within the selected interval: open price, highest price, lowest price, close price        | [**Link**](https://docs.agenatrader.com/main/chart-area/untitled/price-styles#candle-chart)                 |
| Line chart              | Connects closing prices with each other for the specified time frame.                                                       | [**Link**](https://docs.agenatrader.com/main/chart-area/untitled/price-styles#line-chart)                   |
| Mountain chart          | Connects closing prices from a certain time period with each other. The area below this line is filled with color.          | [**Link**](https://docs.agenatrader.com/main/chart-area/untitled/price-styles#mountain-chart)               |
| Bar chart               | Graphical representation of the lowest, highest and final price                                                             | [**Link**](https://docs.agenatrader.com/main/chart-area/untitled/price-styles#bar-chart)                    |
| EquiVolume chart        | Display price movements, taking into consideration the volume, time and price components.                                   | [**Link**](https://docs.agenatrader.com/main/chart-area/untitled/price-styles#equivolume-chart)             |
| EquiVolume Shadow chart | Measures the relationship between price, volume and the shadow.                                                             | [**Link**](https://docs.agenatrader.com/main/chart-area/untitled/price-styles#equivolume-shadow-chart)      |
| Candle volume chart     | Similar to the candle chart, yet it analyses not only price movements but also the corresponding trading volume.            | [**Link**](https://docs.agenatrader.com/main/chart-area/untitled/price-styles#candle-volume-chart)          |
| Point\&Figure           | plots an 'X' when the price rises and an 'O' when the price falls.                                                          | [**Link**](https://docs.agenatrader.com/main/chart-area/chart-container/chart-types#Point_amp_Figure)       |
| Renko                   | Black bricks are plotted when the price falls, and white bricks, when the price rises.                                      | [**Link**](https://docs.agenatrader.com/main/chart-area/chart-container/chart-types#Renko_chart)            |
| Kagi                    | Kagi charts can be useful for trend analysis and making buy or sell decisions.                                              | [**Link**](https://docs.agenatrader.com/main/chart-area/chart-container/chart-types#Kagi_chart)             |
| Three line break        | Responds to the dynamic of price changes (without regard to time) and is considered to be able to show changes in the trend | [**Link**](https://docs.agenatrader.com/main/chart-area/chart-container/chart-types#Three_line_break_chart) |
| Heikin AshiVisual       | technique that eliminates irregularities from a normal chart, offering a better picture of trends and consolidation.        | [**Link**](https://docs.agenatrader.com/main/chart-area/chart-container/chart-types#Heikin_Ashi)            |
| Volume                  | Each bar will be drawn when a certain amount of volume was reached                                                          | [**Link**](https://docs.agenatrader.com/main/chart-area/chart-container/chart-types#Volume)                 |
| Range                   | Range bars take only price into consideration; therefore, each bar represents a specified movement of price.                | [**Link**](https://docs.agenatrader.com/main/chart-area/chart-container/chart-types#Range)                  |

### **Drawing objects** <a href="#drawing_objects" id="drawing_objects"></a>

| Name                        | Definition                                                                                                                                                                                           | Url                                                                                                                                  |
| --------------------------- | ---------------------------------------------------------------------------------------------------------------------------------------------------------------------------------------------------- | ------------------------------------------------------------------------------------------------------------------------------------ |
| Fibonacci retracement       | Indicate areas of support or resistance at the key Fibonacci levels before the trend continues in the original direction.                                                                            | [**Link**](https://docs.agenatrader.com/main/chart-area/untitled/drawing-objects/types-of-drawing-objects#fibonacci-shapes)          |
| Fibonacci arcs              | Advanced version of Fibonacci retracement. Use circles instead of lines.                                                                                                                             | [**Link**](https://docs.agenatrader.com/main/chart-area/untitled/drawing-objects/types-of-drawing-objects#fibonacci-shapes)          |
| Fibonacci Time zones        | Used to highlight periods of time on stock charts when the stock's (index's or other tradable commodity's) price trend is vulnerable to changes.                                                     | [**Link**](https://docs.agenatrader.com/main/chart-area/untitled/drawing-objects/types-of-drawing-objects#fibonacci-shapes)          |
| Gann Fan Up / Gann Fan Down | Display how prices that have originated from significant highs or lows have developed over time, and can help to identify potential trend reversals or to predict price movements.                   | [**Link**](https://docs.agenatrader.com/main/chart-area/untitled/drawing-objects/types-of-drawing-objects#gann-fan-up-gann-fan-down) |
| Andrew's Pitchfork          | Uses three parallel trendlines to identify possible levels of support and resistance.                                                                                                                | [**Link**](https://docs.agenatrader.com/main/chart-area/untitled/drawing-objects/types-of-drawing-objects#andrews-pitchfork)         |
| Tirone Levels               | Tirone levels (developed by John Tirone) are a series of three horizontal lines that, like the Fibonacci levels or quadrant lines, represent support or resistance levels.                           | [**Link**](https://docs.agenatrader.com/main/chart-area/untitled/drawing-objects/types-of-drawing-objects#tirone-levels)             |
| Quadrant Lines              | Quadrant lines divide the price area into four equally sized areas.                                                                                                                                  | [**Link**](https://docs.agenatrader.com/main/chart-area/untitled/drawing-objects/types-of-drawing-objects#quadrant-lines)            |
| Raff Regression Channel     | Linear regression tool consisting of a line fitting the price series as closely as possible, as estimated by the ordinal least squares (OLS) method, and two lines of equal distance from this line. | [**Link**](https://docs.agenatrader.com/main/chart-area/untitled/drawing-objects/types-of-drawing-objects#raff-regression-channel)   |
| Trend Line                  | is a bounding line for the price movement of a security. The opposite parallel line will be adjusted accordingly.                                                                                    | [**Link**](https://docs.agenatrader.com/main/chart-area/untitled/drawing-objects/types-of-drawing-objects#trend-line-advanced)       |
| Free Hand Drawing           | Used to make various markings on a chart.                                                                                                                                                            | [**Link**](https://docs.agenatrader.com/main/chart-area/untitled/drawing-objects/types-of-drawing-objects#free-hand-drawing)         |
| Chart distance meter        | With this tool user may increase or decrease the distance from price, bars & percent.                                                                                                                | [**Link**](https://docs.agenatrader.com/main/chart-area/untitled/drawing-objects/types-of-drawing-objects#chart-distance-meter)      |
| Text                        | Used to apply text to the chart.                                                                                                                                                                     | [**Link**](https://docs.agenatrader.com/main/chart-area/untitled/drawing-objects/types-of-drawing-objects#text)                      |


# FAQ

## Download and Installation

<details>

<summary>Does AgenaTrader Support MAC OSX (Apple)?</summary>

AgenaTrader is developed for Windows and cannot be installed on Mac (Apple). Many customers successfully use virtual machines on Mac (Apple) to run Windows (e.g., Parallels).

</details>

<details>

<summary>Will My Data Be Preserved During an Update?</summary>

We are continuously working to improve AgenaTrader and address any issues. You will be notified via a popup when a new update is available, and we recommend installing it. Only system data will be updated; your personal data (e.g., user directory, workspace, instruments, conditions) will be preserved.

You can easily back up this data. Here you can find information on where your user data is stored and how to back up the user directory.

</details>

<details>

<summary>Correctly establishing a connection to a broker or data feed</summary>

Once in a while, problems may occur with the connection to a broker or data feed. In most cases, this is due to the connection to the broker or data feed not being correctly established.

It is recommended to check whether you are subscribed to the corresponding service or have opened an account with the relevant provider. Here - depending on the provider - there are often several important tips to take into account (e.g. activating certain functions in the TWS, synchronized settings of the ports and so on). You can find all these notes in the connection guides that we make available for you online.

</details>

<details>

<summary>Download the Latest AgenaTrader Release</summary>

Downloads are available 24/7 on our [homepage](https://agenatrader.com/download_area/). Generally, you will be prompted to update via a popup upon restarting if an update is available. Additionally, AgenaTrader will show an update notification at the bottom right of the screen. Updates are free of charge.

</details>


# Top FAQ


# Chart is ticking without displaying candles

**Most probable reasons and solutions**

* If trading hours of an instrument in the Instrument Editor are not adjusted to the real world trading hours of the exchange.

-> We strongly advise against changing trading hours as long as you does not have advanced knowledge about AgenaTrader.

* If the trading hours of a complete exchange of the marketplace escort are not adjusted to the real world trading hours of the exchange.

-> We strongly advise against changing trading hours as long as you does not have advanced knowledge about AgenaTrader.

* If the settings "exclude weekends" in GlobalConfiguration/Chart is active, then no new candles are drawn during the weekend. If the From/To settings of this feature are changed this could lead to the problem that other days like Monday or Friday are excluded on the chart.

-> We advise against changing "Exclude Weekends" settings. Find default settings below:

<figure><img src="https://docs.agenatrader.com/~gitbook/image?url=https%3A%2F%2F2805764894-files.gitbook.io%2F%7E%2Ffiles%2Fv0%2Fb%2Fgitbook-legacy-files%2Fo%2Fassets%252F-MKZSsJBtSP9L4sqIe_q%252F-MQwPCScTa47vxWsw7R-%252F-MQwQzQc0Fg3y-5jbCcu%252FFromToDefault.png%3Falt%3Dmedia%26token%3Daf885945-58c3-4cd1-aedc-027b9a578583&#x26;width=768&#x26;dpr=4&#x26;quality=100&#x26;sign=e8a5f592&#x26;sv=2" alt=""><figcaption></figcaption></figure>


# How to display P\&L on Tradebar

**Profit/loss** shows the current profit or loss of the position (estimated but not yet realized). If you left click in this field, you will see the following display options in the drop-down list Amount Percent Risks (AgenaTrader++) Ticks

![](https://docs.agenatrader.com/~gitbook/image?url=https%3A%2F%2F2805764894-files.gitbook.io%2F%7E%2Ffiles%2Fv0%2Fb%2Fgitbook-legacy-files%2Fo%2Fassets%252F-MKZSsJBtSP9L4sqIe_q%252F-MQwPCScTa47vxWsw7R-%252F-MQwR_SCVrzgXw4HLKf9%252FOpenPL.png%3Falt%3Dmedia%26token%3Df2d1461f-581f-4382-a62c-aa930b539358\&width=768\&dpr=4\&quality=100\&sign=ffe358b5\&sv=2)![](https://docs.agenatrader.com/~gitbook/image?url=https%3A%2F%2F2805764894-files.gitbook.io%2F%7E%2Ffiles%2Fv0%2Fb%2Fgitbook-legacy-files%2Fo%2Fassets%252F-MKZSsJBtSP9L4sqIe_q%252F-MQwPCScTa47vxWsw7R-%252F-MQwRdKyy3c9S9VaGWEI%252FPL%2520Anzeige.png%3Falt%3Dmedia%26token%3Dd0bad945-99d6-4150-895a-a213d06c39a5\&width=768\&dpr=4\&quality=100\&sign=93ecef4b\&sv=2)

**Important:** Outside market trading hours the ask/bid prices can differ from regular ask/bid prices. This influences the display of the current open P/L. Usually when the markets are open this resolves itself automatically. We do not want to ignore this ask/bid prices since it is possible that the market opens with a gap and this P/L become realized.


# Connecting to more than one CFD-Broker simultaneously

**Issue:**

You want to connect to more than one broker simultanoeusly, yet every time you try, you get an error message like this:

<figure><img src="https://docs.agenatrader.com/~gitbook/image?url=https%3A%2F%2F2805764894-files.gitbook.io%2F%7E%2Ffiles%2Fv0%2Fb%2Fgitbook-legacy-files%2Fo%2Fassets%252F-MKZSsJBtSP9L4sqIe_q%252F-MQwPCScTa47vxWsw7R-%252F-MQwRo2UCJOQSpwjDJSK%252FErrorMultiBroker.png%3Falt%3Dmedia%26token%3D6098ed24-5e31-492e-bba3-43d11b330caa&#x26;width=768&#x26;dpr=4&#x26;quality=100&#x26;sign=692b211f&#x26;sv=2" alt=""><figcaption></figcaption></figure>

**Solution:**

We have implemented "virtual CFD-exchanges" for InstrumentEditor ("CFD1" - "CFD10"). From now on you can assign broker-specific CFDs to each of those exchanges.

Therefore you need to go to your Account connection settings / Accounts and chose "Markets only" for each broker in question. Then assign a different virtual exchange to each broker and confirm. Now you can connect to several CFD-brokers simultaneously.

<figure><img src="https://docs.agenatrader.com/~gitbook/image?url=https%3A%2F%2F2805764894-files.gitbook.io%2F%7E%2Ffiles%2Fv0%2Fb%2Fgitbook-legacy-files%2Fo%2Fassets%252F-MKZSsJBtSP9L4sqIe_q%252F-MQwPCScTa47vxWsw7R-%252F-MQwRs40Tx5enyEDEZCV%252FVirtualExchanges2.png%3Falt%3Dmedia%26token%3Dcd1a42bc-7cde-43a7-94d6-1f1c6756a4b9&#x26;width=768&#x26;dpr=4&#x26;quality=100&#x26;sign=f7d86bb8&#x26;sv=2" alt=""><figcaption></figcaption></figure>


# Hard and Soft stops: Automatic stop movement

## Hard and Soft stops <a href="#hard_and_soft_stops" id="hard_and_soft_stops"></a>

The user can define, activate and deactivate fully functional trading setups via the Setup Builder.

*You can find further details about trading setups in the* [***Setup Builder***](https://docs.agenatrader.com/create-your-own-trading-strategy/setup-escort) *section.*

For each setup, the user should adjust the hard and soft stops.

*You can find further find details on the page* [***Setup Builder: Configuration Tab***](https://docs.agenatrader.com/create-your-own-trading-strategy/setup-escort#Setup_Escort__Configuration_tab)*.*

### **Hard stops**&#x20;

Are the stop methods that are applied to the stop orders. Basically, a hard stop is intended to be used for catastrophic scenarios. The HardTrail stop is always connected to the actual stop order as soon as the position is opened. This means that once the HardTrail stop level is crossed, the entire position is closed.

*You can find further details about the hard stop on the page* [***Hard Trail Stop***](https://docs.agenatrader.com/create-your-own-trading-strategy/setup-escort#Hard_Trail_stop)*.*

### **Soft stops**&#x20;

Do not close a trade immediately after being crossed by a closing price. Once the soft stop is crossed by the closing price, the hard stop is triggered and moved accordingly.

*You can find further details about the soft stop on the page* [***Soft Trail Stop***](https://docs.agenatrader.com/create-your-own-trading-strategy/setup-escort#Soft_Trail)*.*

### Example <a href="#example" id="example"></a>

We configure trading setup as on picture below:

<figure><img src="https://docs.agenatrader.com/~gitbook/image?url=https%3A%2F%2F2805764894-files.gitbook.io%2F%7E%2Ffiles%2Fv0%2Fb%2Fgitbook-legacy-files%2Fo%2Fassets%252F-MKZSsJBtSP9L4sqIe_q%252F-MQwPCScTa47vxWsw7R-%252F-MQwRx1H378TTaqbonUY%252Fconfiguration.png%3Falt%3Dmedia%26token%3Dcb350897-47cc-48fc-b87b-fec060f9a3d7&#x26;width=768&#x26;dpr=4&#x26;quality=100&#x26;sign=4a8920f6&#x26;sv=2" alt=""><figcaption></figcaption></figure>

* **Initial Stop Escort** is set as a Pivot Slow. It means stop use Swing (30) indicator as a stop.
* **HardTrail Stop** is set as Keltner Channel. This stop use Keltner lines as a stop (lower for a long and upper for the short position)
* **SoftTrail Stop** is set as SuperTrend. This stop uses SuperTrend indicator as a stop.
* **Target Escort** is set as No Target. It means we don't use targets in this setup

You can find more details about stop setups on the page [**Setup Builder: Stop Escorts**](https://docs.agenatrader.com/create-your-own-trading-strategy/setup-escort#stopescort).

First, stop starts at **Initial Stop** position (Pivot Slow). After the first bar was closed, stop automatically moves the same way as Keltner lower line (according to **HardTrail Stop** setting). On a chart, **HardTrail** **Stop** looks like a solid line. **SoftTrail** stop also starts after the first bar is closed. It moves similar to SuperTrend indicator (according to **SoftTrail Stop** settings). SoftTrail stop displayed as dot line on a chart.

<figure><img src="https://docs.agenatrader.com/~gitbook/image?url=https%3A%2F%2F2805764894-files.gitbook.io%2F%7E%2Ffiles%2Fv0%2Fb%2Fgitbook-legacy-files%2Fo%2Fassets%252F-MKZSsJBtSP9L4sqIe_q%252F-MQwPCScTa47vxWsw7R-%252F-MQwS-ufk6D821X11KjG%252Fchart.png%3Falt%3Dmedia%26token%3Dd30d5a9e-10e1-48c1-bcaf-f565c327b85e&#x26;width=768&#x26;dpr=4&#x26;quality=100&#x26;sign=a9675ff0&#x26;sv=2" alt=""><figcaption></figcaption></figure>

In case User wants to switch off automated stop movements just configure trading setup as on picture below. After Stop will be placed according to Initial Stop settings and may be moved only manually by User.

<figure><img src="https://docs.agenatrader.com/~gitbook/image?url=https%3A%2F%2F2805764894-files.gitbook.io%2F%7E%2Ffiles%2Fv0%2Fb%2Fgitbook-legacy-files%2Fo%2Fassets%252F-MKZSsJBtSP9L4sqIe_q%252F-MQwPCScTa47vxWsw7R-%252F-MQwS4ORGEQLJvYRQjWH%252Fstop.png%3Falt%3Dmedia%26token%3D46c66c05-cd09-4460-b0ef-38eb07138284&#x26;width=768&#x26;dpr=4&#x26;quality=100&#x26;sign=7e12279&#x26;sv=2" alt=""><figcaption></figcaption></figure>

**Attention!** Hard and soft stops are moved automatically according to your stop setups. You can find more details about stop setups on the page [**Setup Builder: Stop Escorts**](https://docs.agenatrader.com/create-your-own-trading-strategy/setup-escort#stopescort).


# Which order connections does my broker support

## **Overview order connections**

In AgenaTrader, you have the option to map out complex order constructs. For this, the [order connections](https://docs.agenatrader.com/main/chart-area/untitled/chart-context-menu#order-groups) "IfDone", "OCO" (one cancels other) and "ORO" (one reduces other) are available for you.

IfDone is created using "ALT" and clicks on the first and the second order. OCO is created using "CTRL" and clicks on the first and second order. ORO is created using "CTRL" + "ALT" and clicks on the first and second order.

### **Supported versus locally simulated connections**

**Note:**&#x49;fDone and ORO are only simulated locally in AgenaTrader, which means that the software must be running and connected to the broker in order to be able to send second order to the broker!

OCO connections are supported by several brokers - you can find the corresponding information on this in the online help under the [respective broker](https://docs.agenatrader.com/main/broker-and-datafeed-connections/broker). This has restrictions that should be taken into account, however: this only applies to single target orders. Order connections in multi-target settings are ORO connections and are therefore only simulated locally as displayed in log:

<figure><img src="https://docs.agenatrader.com/~gitbook/image?url=https%3A%2F%2F2805764894-files.gitbook.io%2F%7E%2Ffiles%2Fv0%2Fb%2Fgitbook-legacy-files%2Fo%2Fassets%252F-MKZSsJBtSP9L4sqIe_q%252F-MQwPCScTa47vxWsw7R-%252F-MQwSEjjp6FW7ry25uYw%252FMultiTargetOCO.png%3Falt%3Dmedia%26token%3D43358783-842d-499e-85e4-1e9a7c6830d3&#x26;width=768&#x26;dpr=4&#x26;quality=100&#x26;sign=f50e5d2&#x26;sv=2" alt=""><figcaption></figcaption></figure>

You will find information about which broker does support OCO, here in the online help under the [respective broker](https://docs.agenatrader.com/main/broker-and-datafeed-connections/broker) was well as in Essential Informations-window, that pops up, when you create a new account connection. You need to read and accept this disclaimer:

<figure><img src="https://docs.agenatrader.com/~gitbook/image?url=https%3A%2F%2F2805764894-files.gitbook.io%2F%7E%2Ffiles%2Fv0%2Fb%2Fgitbook-legacy-files%2Fo%2Fassets%252F-MKZSsJBtSP9L4sqIe_q%252F-MQwPCScTa47vxWsw7R-%252F-MQwSJM1IxYemswEyP_w%252FDisclaimerOrderConnections.png%3Falt%3Dmedia%26token%3D3ee8a3a5-3b02-40f1-9fe0-c40f382bb7ce&#x26;width=768&#x26;dpr=4&#x26;quality=100&#x26;sign=3800783d&#x26;sv=2" alt=""><figcaption></figcaption></figure>


# Сonditions and Scripts disappeared

There are several ways to solve this issue:

* Download and install the latest release of AgenaTrader. Download link [**here**](https://agenatrader.com/download/AgenaTrader_Setup.exe)
* Please go to **Strategie Handling->Scripting** and click on **Compile** button

<figure><img src="https://docs.agenatrader.com/~gitbook/image?url=https%3A%2F%2F2805764894-files.gitbook.io%2F%7E%2Ffiles%2Fv0%2Fb%2Fgitbook-legacy-files%2Fo%2Fassets%252F-MKZSsJBtSP9L4sqIe_q%252F-MQwPCScTa47vxWsw7R-%252F-MQwSPttYe-vLXDqb4wR%252Fcompile.png%3Falt%3Dmedia%26token%3D311797e0-68a8-475e-8f2e-b0f805d221f5&#x26;width=768&#x26;dpr=4&#x26;quality=100&#x26;sign=a1a5bb32&#x26;sv=2" alt=""><figcaption></figcaption></figure>

**Important!** In some cases, User can get compiling errors. Please find details about how to solve this on page [**Compile Errors**](https://docs.agenatrader.com/create-your-own-trading-strategy/scripting#Compile_Errors)

* Please check the destination of script files. They should be located: **C:\Users\\'User\_name'\Documents\AgenaTrader\UserCode\ folders: Indicators, Scanns, ScriptedConditions, Strategies or AlertHandlers** (depends on Script type). In case you find them in other location, just copy them to the destination folder and click **Compile** button.

<figure><img src="https://docs.agenatrader.com/~gitbook/image?url=https%3A%2F%2F2805764894-files.gitbook.io%2F%7E%2Ffiles%2Fv0%2Fb%2Fgitbook-legacy-files%2Fo%2Fassets%252F-MKZSsJBtSP9L4sqIe_q%252F-MQwPCScTa47vxWsw7R-%252F-MQwSWK4SBrzzYyYCWzy%252FUserCode.png%3Falt%3Dmedia%26token%3D642aec75-d030-42b9-9941-2f2a80b1943b&#x26;width=768&#x26;dpr=4&#x26;quality=100&#x26;sign=8a9b76c&#x26;sv=2" alt=""><figcaption></figcaption></figure>

* Conditions might disappear because your packages were not updated to the latest version. In this case please select **Tools -> Packages -> Imported Packages** from the main menu.

<figure><img src="https://docs.agenatrader.com/~gitbook/image?url=https%3A%2F%2F2805764894-files.gitbook.io%2F%7E%2Ffiles%2Fv0%2Fb%2Fgitbook-legacy-files%2Fo%2Fassets%252F-MKZSsJBtSP9L4sqIe_q%252F-MQwPCScTa47vxWsw7R-%252F-MQwSaeyb9-W5KlGufP6%252FPAckage.png%3Falt%3Dmedia%26token%3D384a26ca-f4ee-4e2a-8938-e9f6a2ad4ea8&#x26;width=768&#x26;dpr=4&#x26;quality=100&#x26;sign=a8067279&#x26;sv=2" alt=""><figcaption></figcaption></figure>

In open tab please check version of your add on. **Up-to-date** button means that your addon is already updated.

<figure><img src="https://docs.agenatrader.com/~gitbook/image?url=https%3A%2F%2F2805764894-files.gitbook.io%2F%7E%2Ffiles%2Fv0%2Fb%2Fgitbook-legacy-files%2Fo%2Fassets%252F-MKZSsJBtSP9L4sqIe_q%252F-MQwPCScTa47vxWsw7R-%252F-MQwSl293RFC8DJc-JDz%252F1.png%3Falt%3Dmedia%26token%3D8a1c5d78-7cd0-4278-96d4-1880241546a3&#x26;width=768&#x26;dpr=4&#x26;quality=100&#x26;sign=b7afd05f&#x26;sv=2" alt=""><figcaption></figcaption></figure>

**Update Available** means that you add on version is obsolete.

<figure><img src="https://docs.agenatrader.com/~gitbook/image?url=https%3A%2F%2F2805764894-files.gitbook.io%2F%7E%2Ffiles%2Fv0%2Fb%2Fgitbook-legacy-files%2Fo%2Fassets%252F-MKZSsJBtSP9L4sqIe_q%252F-MQwPCScTa47vxWsw7R-%252F-MQwSpp-WmkFnvcFC3zs%252Fupdate.png%3Falt%3Dmedia%26token%3D19ccea19-5675-4ec3-9286-5090a5018de0&#x26;width=768&#x26;dpr=4&#x26;quality=100&#x26;sign=304d23dd&#x26;sv=2" alt=""><figcaption></figcaption></figure>

To update add on please click on **Update Available** button and in open dialog click button **Yes**

<figure><img src="https://docs.agenatrader.com/~gitbook/image?url=https%3A%2F%2F2805764894-files.gitbook.io%2F%7E%2Ffiles%2Fv0%2Fb%2Fgitbook-legacy-files%2Fo%2Fassets%252F-MKZSsJBtSP9L4sqIe_q%252F-MQwPCScTa47vxWsw7R-%252F-MQwSuTucB9H3XV1ht-U%252FUpdate_routine.png%3Falt%3Dmedia%26token%3Dbb2aca7d-541b-4d37-952b-5af1ba490a82&#x26;width=768&#x26;dpr=4&#x26;quality=100&#x26;sign=84fcd1e9&#x26;sv=2" alt=""><figcaption></figcaption></figure>


# Trading Functions Are Disabled

## Trading not possible

**Issue:**

The **trading function** in the **chart context menu** and/or **QuickSetup buttons** are disabled.

<figure><img src="/files/bHpVNJzV3ew9lj7xGK3b" alt=""><figcaption></figcaption></figure>

**Possible Causes & Solutions:**

✅ **Incorrect Multi-Brokerage Settings**

* Go to **Tools → Settings → Account Connections** and check if your **broker, asset classes, and markets** are correctly activated.

✅ **Not Connected to Your Broker Account**

* Go to **Main → Connections → Connect** and establish the **broker connection**.

✅ **Incorrect Trading Hours or Pauses**

* Check your **trading hours and breaks** in the **Instrument Editor** and **General Settings**.

✅ **Pre- & Post-Market Trading Activated**

* If enabled, adjust **off-market price movements** in **Marketplace Escort** and disable them via the **chart toolbar button**.

***

## **Error When Submitting an Order**

**Issue:**

Your **order is not being sent** to the broker.

**Possible Causes & Solutions:**

✅ **Missing or Incorrect Mappings**

<figure><img src="/files/xARQ8wDVVCNADZJNEQap" alt=""><figcaption></figcaption></figure>

* If you get a **mapping error**, **re-import mappings**.
* If the **instrument mapping is missing or incorrect**, request it via the **Instrument Editor → Feedback button**.

✅ **Incorrect Tick Size**

<figure><img src="/files/FSeiqiaUbkTlKB76jYBI" alt=""><figcaption></figcaption></figure>

* If you get a **tick size error**, adjust the **tick size** to match your **broker's settings**.
* Check your **broker's website or reference platform** for correct tick size details.

✅ **Insufficient Account Balance**

* If your **order size exceeds your funds**, deposit money into your **broker account** or **reduce the order size**.

✅ **Unmet Margin Requirements**

* If **margin requirements aren’t met**, deposit funds or **close open positions**.


# IB Charts Not Displayed Correctly or Contain Incorrect Data

**What Happened?**

AgenaTrader displays a **warning popup** indicating:

* **Charts are partially incorrect or contain faulty data.**
* **Historical data is missing, and charts are not updating (ticking).**

**What Does This Mean?**

✅ **IB API Limitations on Historical Data Requests**

* The **maximum number of simultaneous historical data requests** via the **IB API is 50**.
* You should ensure that you have **fewer simultaneous requests** to avoid issues.

✅ **Pacing Violations for Small Bars (≤ 30 Seconds)**

* A **pacing violation** occurs if you exceed one of the following limits:
  * **Identical historical data request within 15 seconds.**
  * **Six or more historical data requests for the same contract, exchange, and tick type within two seconds.**
  * **More than 60 requests within 10 minutes.**

⚠ **Warning:** If too many historical data requests are made, **you may be disconnected from the IB API**.\
➡ **For more details on IB pacing violations for small bars, refer to this IB article.**

***

#### **Important Notes**

📌 **1 instrument across 3 time frames = 3 historical requests**\
📌 **1 Analyzer Escort column = 1 historical request**\
📌 **Watchlists, backtest lists, indicators, and alerts also require historical data.**

***

#### **Possible Solutions**

✅ **Reduce the number of instruments and historical requests sent to the IB server.**

* Monitor the **green connection bar in the lower left** corner of AgenaTrader.

✅ **Wait 10 minutes before requesting additional historical data.**

* Be cautious: **Reloading data may cause another historical overflow.**

✅ **Consider an external data feed (often paid services).**

* **Check the data feed overview here.**

📌 **This also applies to CapTrader, Banx, Lynx, and other brokers using the TWS API connection.**


# Can I Connect an Additional Data Feed While Using IB as a Broker?

✅ **Yes, you can use Interactive Brokers (IB) as a broker and add an external professional data feed** (e.g., **Teletrader, Taipan, Barchart, IQFeed**).

⚠ **However, IB has limitations on historical data requests.**\
➡ Read more about **historical request overflow** and other essential details in the **Interactive Brokers Essential Information** section.

***

#### **How to Add an External Data Feed in AgenaTrader**

1️⃣ **Open AgenaTrader** and go to:\
**Main → Connections → Add New Account**

2️⃣ **Select Your Data Feed Provider**

* Assign a **connection name** (we recommend using the **data feed name** as the connection name).
* Enter your **login credentials** in the context window.

***

#### **Important: Configuring Data Sources**

📌 **Define which data comes from your external data feed vs. IB** in **Account Connections**.\
⚠ This is critical because **IB Index CFDs cannot be requested from an external data feed** – they must come **directly from IB**.

**Example: Using Taipan as a Data Feed Provider**

1️⃣ **In "Connections" (under Account Connections tab):**

* **Enable IB as both a broker and data feed.**
* **Enable Taipan only as a data feed.**

2️⃣ **In the "Data Feeds" tab:**

* Define **instrument types** to avoid conflicts.
* ❌ **Do not select the same instrument types for both IB and Taipan.**
* ✅ **For IB:** Select **only "CFD".**
* ✅ **For Taipan:** Select all **instrument types you have subscribed to** (but do not select CFDs).

⚠ **If you select the same instrument types for both IB and Taipan, you will receive an error when connecting AgenaTrader to both providers simultaneously.**


# Contact Support

## Efficient Troubleshooting Before Contacting Support

If you encounter an issue while using AgenaTrader, we encourage you to take a moment to investigate possible causes before reaching out to our support team. Our **technical support** is specifically dedicated to resolving **system errors and technical shortcomings** within the software. Since they do not provide **individual tutoring or assistance with general settings and platform handling**, submitting such requests may lead to **longer response times** for all users, including yourself.

In many cases, issues can be resolved through **a quick review of settings, configurations, or known solutions**. Even experienced developers sometimes realize that the source of an issue lies in **a specific setup rather than the software itself,** so taking a moment to check for potential causes can often lead to a quick fix.

To help you troubleshoot effectively, we provide **detailed documentation, FAQs, tutorials, and a community on Discord** where both users and our team are available to assist you. These resources are designed to help you get the most out of AgenaTrader while minimizing waiting times for support responses.

### **If problems arise...** <a href="#if-problems-arise" id="if-problems-arise"></a>

...or something does not work as expected, please follow our recommendations:

1. First try to ensure that you have updated your program to the latest version as is described in the release notes.
2. We kindly ask you to look for the answers to your question in our online media
3. Only after this should you contact the support team.

*In 9 of 10 cases you will find help in our* [*FAQ*](/introduction/faq)*.*&#x20;

## Submitting a Support Ticket Efficiently

To submit a support request, please click on the **small arrow next to "Support"** in the **Toolbar** and select **"Create Sales/Support Ticket"** from the dropdown menu.

* Choose the **appropriate category and subcategory**
* Provide a **detailed description** of your request
* Attach **screenshots** if relevant

Once we receive your request and data, we will **forward it to our testing team** or handle it directly, depending on the nature of your inquiry.

**Important Information on Further Communication**

* All **further communication** with our support team will take place via **email**.
* For **new issues, inquiries, or technical problems**, please **always create a new ticket**. This ensures a **smooth and complete resolution** of your request.

We understand that waiting for a solution may sometimes require patience. Our team works as quickly as possible, but **analyzing, troubleshooting, and testing a technical issue** requires diligence and can take time.

While we appreciate your eagerness for updates, **multiple follow-ups do not speed up the process**—in fact, they can **cause delays**. This is because once a ticket is forwarded to the test department, it is no longer visible to the support team. Unnecessary follow-ups may **push tickets between departments**, delaying the resolution process.

Therefore, to ensure a **fast and efficient response**, we kindly ask you **not to send follow-ups** or open a **new ticket for the same issue** unless absolutely necessary (e.g., if you have essential new information relevant to the solution).

Thank you for your understanding and cooperation!

<figure><img src="/files/cBnUDkIU7pCDF9lmhgO9" alt=""><figcaption></figcaption></figure>

{% hint style="info" %}
**Please note:**

Support requests can only be sent via this function in the AgenaTrader platform. Only for the - extremely rare - case that the platform cannot be restarted, we set up an emergency contact address on our website, through which the support team can be reached in these exceptional cases.
{% endhint %}

| Name                     | Definition                                                                                         |
| ------------------------ | -------------------------------------------------------------------------------------------------- |
| Log files                | If activated complete logs files are sent (for last 14 days by default. User may increase history) |
| Orders Log               | If activated order logs file is sent (for last 30 days by default. User may increase history)      |
| Active workspace         | If activated active user workspace is sent                                                         |
| Configs                  | If activated Config file is sent (TE\_Config.xml).                                                 |
| Current Open Instruments | If activated all open instrument data are sent (Tick Size, Point Value, etc)                       |
| Complete UserDirectory   | If activated the complete User Directory is sent                                                   |
| Complete DataDirectory   | If activated the complete Data Directory is sent.                                                  |

#### **Unhandled Exception (Error report to the support)** <a href="#unhandled-exception-error-report-to-the-support" id="unhandled-exception-error-report-to-the-support"></a>

Should an internal error occur, AgenaTrader will display a popup in which you can see the so-called stack trace and recognize where this error has occurred. This information is very important for us to stabilize AgenaTrader. If you receive such a popup, please submit this information to us by clicking the **Send Error** button. We will subsequently receive an email with the stack trace information. You *will not receive any response* from our support team. In case a bug is detected, it will most likely be fixed in one of the next updates.

![](https://docs.agenatrader.com/~gitbook/image?url=https%3A%2F%2F2805764894-files.gitbook.io%2F%7E%2Ffiles%2Fv0%2Fb%2Fgitbook-legacy-files%2Fo%2Fassets%252F-MKZSsJBtSP9L4sqIe_q%252F-MQwaBAfMfkSUH6IVZlQ%252F-MQwf0Or5DyCj-OHn745%252Fbug.png%3Falt%3Dmedia%26token%3Dac3c1eb1-553e-4c04-8117-5d5bad92b32e\&width=768\&dpr=4\&quality=100\&sign=48964f4f\&sv=1)

{% hint style="warning" %}
**Important!**

*You have reached XX% of your RAM memory. If possible, please close any memory-intensive applications or modify your AgenaTrader workspace by closing some List/Tab Chart Groups, Analyzer Columns, etc.*

This indicates that AgenaTrader is utilizing the maximum available RAM on your PC. Please follow the instructions below:

-> Close any memory-intensive applications running on your system.&#x20;

-> Alternatively, consider modifying your AgenaTrader workspace to reduce memory usage.
{% endhint %}


# Broker and Datafeeds Connections

## Brokers and Data Feeds <a href="#brokers_and_data_feeds" id="brokers_and_data_feeds"></a>

Selecting the appropriate broker and data feed is a crucial step that depends on your specific trading needs and objectives. Before diving into the details of the AgenaTrader Online Help, we will address this topic in the following section to help guide your decision.

If you haven’t yet chosen a broker or data feed, consider the following questions:

* What time frames will you trade in? (For example, do you need access to tick data?)
* How are the broker's spreads and fees structured?
* What types of instruments does the broker support? (e.g., CFDs, forex, stocks, futures, etc.)

Understanding these factors will help you choose a broker and data feed that align with your trading strategy and goals.

**The supported data feed providers and brokerage services are displayed in the table below:**

|                     | Broker                                                                                                                                                                                                                                | Data Feed                                                                                                                                                                                                                              | Tick data                                                                                                                                                                                                                             | Intraday                                                                                                                                                                                                                              | End of Day                                                                                                                                                                                                                            | CFDs                                                                                                                                                                                                                                   | Forex                                                                                                                                                                                                                                 | Shares                                                                                                                                                                                                                                | Futures                                                                                                                                                                                                                               |
| ------------------- | ------------------------------------------------------------------------------------------------------------------------------------------------------------------------------------------------------------------------------------- | -------------------------------------------------------------------------------------------------------------------------------------------------------------------------------------------------------------------------------------- | ------------------------------------------------------------------------------------------------------------------------------------------------------------------------------------------------------------------------------------- | ------------------------------------------------------------------------------------------------------------------------------------------------------------------------------------------------------------------------------------- | ------------------------------------------------------------------------------------------------------------------------------------------------------------------------------------------------------------------------------------- | -------------------------------------------------------------------------------------------------------------------------------------------------------------------------------------------------------------------------------------- | ------------------------------------------------------------------------------------------------------------------------------------------------------------------------------------------------------------------------------------- | ------------------------------------------------------------------------------------------------------------------------------------------------------------------------------------------------------------------------------------- | ------------------------------------------------------------------------------------------------------------------------------------------------------------------------------------------------------------------------------------- |
| Interactive Brokers | ![Blue Checkmark Ms](https://files.gitbook.com/v0/b/gitbook-legacy-files/o/assets%2F-MKZSsJBtSP9L4sqIe_q%2F-MPcdoF_aq80xKbOxNil%2F-MPcgrVqXQ0BHVq78Gxx%2Fblue_checkmark_ms.png?alt=media\&token=29bb30d2-ce12-4579-b668-a655cbadf491) | ![Blue Checkmark Ms](https://files.gitbook.com/v0/b/gitbook-legacy-files/o/assets%2F-MKZSsJBtSP9L4sqIe_q%2F-MPcdoF_aq80xKbOxNil%2F-MPcgrVqXQ0BHVq78Gxx%2Fblue_checkmark_ms.png?alt=media\&token=29bb30d2-ce12-4579-b668-a655cbadf491)1 | -                                                                                                                                                                                                                                     | ![Blue Checkmark Ms](https://files.gitbook.com/v0/b/gitbook-legacy-files/o/assets%2F-MKZSsJBtSP9L4sqIe_q%2F-MPcdoF_aq80xKbOxNil%2F-MPcgrVqXQ0BHVq78Gxx%2Fblue_checkmark_ms.png?alt=media\&token=29bb30d2-ce12-4579-b668-a655cbadf491) | ![Blue Checkmark Ms](https://files.gitbook.com/v0/b/gitbook-legacy-files/o/assets%2F-MKZSsJBtSP9L4sqIe_q%2F-MPcdoF_aq80xKbOxNil%2F-MPcgrVqXQ0BHVq78Gxx%2Fblue_checkmark_ms.png?alt=media\&token=29bb30d2-ce12-4579-b668-a655cbadf491) | ![Blue Checkmark Ms](https://files.gitbook.com/v0/b/gitbook-legacy-files/o/assets%2F-MKZSsJBtSP9L4sqIe_q%2F-MPcdoF_aq80xKbOxNil%2F-MPcgrVqXQ0BHVq78Gxx%2Fblue_checkmark_ms.png?alt=media\&token=29bb30d2-ce12-4579-b668-a655cbadf491)2 | ![Blue Checkmark Ms](https://files.gitbook.com/v0/b/gitbook-legacy-files/o/assets%2F-MKZSsJBtSP9L4sqIe_q%2F-MPcdoF_aq80xKbOxNil%2F-MPcgrVqXQ0BHVq78Gxx%2Fblue_checkmark_ms.png?alt=media\&token=29bb30d2-ce12-4579-b668-a655cbadf491) | ![Blue Checkmark Ms](https://files.gitbook.com/v0/b/gitbook-legacy-files/o/assets%2F-MKZSsJBtSP9L4sqIe_q%2F-MPcdoF_aq80xKbOxNil%2F-MPcgrVqXQ0BHVq78Gxx%2Fblue_checkmark_ms.png?alt=media\&token=29bb30d2-ce12-4579-b668-a655cbadf491) | ![Blue Checkmark Ms](https://files.gitbook.com/v0/b/gitbook-legacy-files/o/assets%2F-MKZSsJBtSP9L4sqIe_q%2F-MPcdoF_aq80xKbOxNil%2F-MPcgrVqXQ0BHVq78Gxx%2Fblue_checkmark_ms.png?alt=media\&token=29bb30d2-ce12-4579-b668-a655cbadf491) |
| AgenaBroker         | ![Blue Checkmark Ms](https://files.gitbook.com/v0/b/gitbook-legacy-files/o/assets%2F-MKZSsJBtSP9L4sqIe_q%2F-MPcdoF_aq80xKbOxNil%2F-MPcgrVqXQ0BHVq78Gxx%2Fblue_checkmark_ms.png?alt=media\&token=29bb30d2-ce12-4579-b668-a655cbadf491) | ![Blue Checkmark Ms](https://files.gitbook.com/v0/b/gitbook-legacy-files/o/assets%2F-MKZSsJBtSP9L4sqIe_q%2F-MPcdoF_aq80xKbOxNil%2F-MPcgrVqXQ0BHVq78Gxx%2Fblue_checkmark_ms.png?alt=media\&token=29bb30d2-ce12-4579-b668-a655cbadf491)1 | -                                                                                                                                                                                                                                     | ![Blue Checkmark Ms](https://files.gitbook.com/v0/b/gitbook-legacy-files/o/assets%2F-MKZSsJBtSP9L4sqIe_q%2F-MPcdoF_aq80xKbOxNil%2F-MPcgrVqXQ0BHVq78Gxx%2Fblue_checkmark_ms.png?alt=media\&token=29bb30d2-ce12-4579-b668-a655cbadf491) | ![Blue Checkmark Ms](https://files.gitbook.com/v0/b/gitbook-legacy-files/o/assets%2F-MKZSsJBtSP9L4sqIe_q%2F-MPcdoF_aq80xKbOxNil%2F-MPcgrVqXQ0BHVq78Gxx%2Fblue_checkmark_ms.png?alt=media\&token=29bb30d2-ce12-4579-b668-a655cbadf491) | ![Blue Checkmark Ms](https://files.gitbook.com/v0/b/gitbook-legacy-files/o/assets%2F-MKZSsJBtSP9L4sqIe_q%2F-MPcdoF_aq80xKbOxNil%2F-MPcgrVqXQ0BHVq78Gxx%2Fblue_checkmark_ms.png?alt=media\&token=29bb30d2-ce12-4579-b668-a655cbadf491)2 | ![Blue Checkmark Ms](https://files.gitbook.com/v0/b/gitbook-legacy-files/o/assets%2F-MKZSsJBtSP9L4sqIe_q%2F-MPcdoF_aq80xKbOxNil%2F-MPcgrVqXQ0BHVq78Gxx%2Fblue_checkmark_ms.png?alt=media\&token=29bb30d2-ce12-4579-b668-a655cbadf491) | ![Blue Checkmark Ms](https://files.gitbook.com/v0/b/gitbook-legacy-files/o/assets%2F-MKZSsJBtSP9L4sqIe_q%2F-MPcdoF_aq80xKbOxNil%2F-MPcgrVqXQ0BHVq78Gxx%2Fblue_checkmark_ms.png?alt=media\&token=29bb30d2-ce12-4579-b668-a655cbadf491) | ![Blue Checkmark Ms](https://files.gitbook.com/v0/b/gitbook-legacy-files/o/assets%2F-MKZSsJBtSP9L4sqIe_q%2F-MPcdoF_aq80xKbOxNil%2F-MPcgrVqXQ0BHVq78Gxx%2Fblue_checkmark_ms.png?alt=media\&token=29bb30d2-ce12-4579-b668-a655cbadf491) |
| CapTrader           | ![Blue Checkmark Ms](https://files.gitbook.com/v0/b/gitbook-legacy-files/o/assets%2F-MKZSsJBtSP9L4sqIe_q%2F-MPcdoF_aq80xKbOxNil%2F-MPcgrVqXQ0BHVq78Gxx%2Fblue_checkmark_ms.png?alt=media\&token=29bb30d2-ce12-4579-b668-a655cbadf491) | ![Blue Checkmark Ms](https://files.gitbook.com/v0/b/gitbook-legacy-files/o/assets%2F-MKZSsJBtSP9L4sqIe_q%2F-MPcdoF_aq80xKbOxNil%2F-MPcgrVqXQ0BHVq78Gxx%2Fblue_checkmark_ms.png?alt=media\&token=29bb30d2-ce12-4579-b668-a655cbadf491)1 | -                                                                                                                                                                                                                                     | ![Blue Checkmark Ms](https://files.gitbook.com/v0/b/gitbook-legacy-files/o/assets%2F-MKZSsJBtSP9L4sqIe_q%2F-MPcdoF_aq80xKbOxNil%2F-MPcgrVqXQ0BHVq78Gxx%2Fblue_checkmark_ms.png?alt=media\&token=29bb30d2-ce12-4579-b668-a655cbadf491) | ![Blue Checkmark Ms](https://files.gitbook.com/v0/b/gitbook-legacy-files/o/assets%2F-MKZSsJBtSP9L4sqIe_q%2F-MPcdoF_aq80xKbOxNil%2F-MPcgrVqXQ0BHVq78Gxx%2Fblue_checkmark_ms.png?alt=media\&token=29bb30d2-ce12-4579-b668-a655cbadf491) | ![Blue Checkmark Ms](https://files.gitbook.com/v0/b/gitbook-legacy-files/o/assets%2F-MKZSsJBtSP9L4sqIe_q%2F-MPcdoF_aq80xKbOxNil%2F-MPcgrVqXQ0BHVq78Gxx%2Fblue_checkmark_ms.png?alt=media\&token=29bb30d2-ce12-4579-b668-a655cbadf491)2 | ![Blue Checkmark Ms](https://files.gitbook.com/v0/b/gitbook-legacy-files/o/assets%2F-MKZSsJBtSP9L4sqIe_q%2F-MPcdoF_aq80xKbOxNil%2F-MPcgrVqXQ0BHVq78Gxx%2Fblue_checkmark_ms.png?alt=media\&token=29bb30d2-ce12-4579-b668-a655cbadf491) | ![Blue Checkmark Ms](https://files.gitbook.com/v0/b/gitbook-legacy-files/o/assets%2F-MKZSsJBtSP9L4sqIe_q%2F-MPcdoF_aq80xKbOxNil%2F-MPcgrVqXQ0BHVq78Gxx%2Fblue_checkmark_ms.png?alt=media\&token=29bb30d2-ce12-4579-b668-a655cbadf491) | ![Blue Checkmark Ms](https://files.gitbook.com/v0/b/gitbook-legacy-files/o/assets%2F-MKZSsJBtSP9L4sqIe_q%2F-MPcdoF_aq80xKbOxNil%2F-MPcgrVqXQ0BHVq78Gxx%2Fblue_checkmark_ms.png?alt=media\&token=29bb30d2-ce12-4579-b668-a655cbadf491) |
| Dukascopy           | ![Blue Checkmark Ms](https://files.gitbook.com/v0/b/gitbook-legacy-files/o/assets%2F-MKZSsJBtSP9L4sqIe_q%2F-MPcdoF_aq80xKbOxNil%2F-MPcgrVqXQ0BHVq78Gxx%2Fblue_checkmark_ms.png?alt=media\&token=29bb30d2-ce12-4579-b668-a655cbadf491) | ![Blue Checkmark Ms](https://files.gitbook.com/v0/b/gitbook-legacy-files/o/assets%2F-MKZSsJBtSP9L4sqIe_q%2F-MPcdoF_aq80xKbOxNil%2F-MPcgrVqXQ0BHVq78Gxx%2Fblue_checkmark_ms.png?alt=media\&token=29bb30d2-ce12-4579-b668-a655cbadf491)  | ![Blue Checkmark Ms](https://files.gitbook.com/v0/b/gitbook-legacy-files/o/assets%2F-MKZSsJBtSP9L4sqIe_q%2F-MPcdoF_aq80xKbOxNil%2F-MPcgrVqXQ0BHVq78Gxx%2Fblue_checkmark_ms.png?alt=media\&token=29bb30d2-ce12-4579-b668-a655cbadf491) | ![Blue Checkmark Ms](https://files.gitbook.com/v0/b/gitbook-legacy-files/o/assets%2F-MKZSsJBtSP9L4sqIe_q%2F-MPcdoF_aq80xKbOxNil%2F-MPcgrVqXQ0BHVq78Gxx%2Fblue_checkmark_ms.png?alt=media\&token=29bb30d2-ce12-4579-b668-a655cbadf491) | ![Blue Checkmark Ms](https://files.gitbook.com/v0/b/gitbook-legacy-files/o/assets%2F-MKZSsJBtSP9L4sqIe_q%2F-MPcdoF_aq80xKbOxNil%2F-MPcgrVqXQ0BHVq78Gxx%2Fblue_checkmark_ms.png?alt=media\&token=29bb30d2-ce12-4579-b668-a655cbadf491) | ![Blue Checkmark Ms](https://files.gitbook.com/v0/b/gitbook-legacy-files/o/assets%2F-MKZSsJBtSP9L4sqIe_q%2F-MPcdoF_aq80xKbOxNil%2F-MPcgrVqXQ0BHVq78Gxx%2Fblue_checkmark_ms.png?alt=media\&token=29bb30d2-ce12-4579-b668-a655cbadf491)  | ![Blue Checkmark Ms](https://files.gitbook.com/v0/b/gitbook-legacy-files/o/assets%2F-MKZSsJBtSP9L4sqIe_q%2F-MPcdoF_aq80xKbOxNil%2F-MPcgrVqXQ0BHVq78Gxx%2Fblue_checkmark_ms.png?alt=media\&token=29bb30d2-ce12-4579-b668-a655cbadf491) | -                                                                                                                                                                                                                                     | -                                                                                                                                                                                                                                     |
| FXCM                | ![Blue Checkmark Ms](https://files.gitbook.com/v0/b/gitbook-legacy-files/o/assets%2F-MKZSsJBtSP9L4sqIe_q%2F-MPcdoF_aq80xKbOxNil%2F-MPcgrVqXQ0BHVq78Gxx%2Fblue_checkmark_ms.png?alt=media\&token=29bb30d2-ce12-4579-b668-a655cbadf491) | ![Blue Checkmark Ms](https://files.gitbook.com/v0/b/gitbook-legacy-files/o/assets%2F-MKZSsJBtSP9L4sqIe_q%2F-MPcdoF_aq80xKbOxNil%2F-MPcgrVqXQ0BHVq78Gxx%2Fblue_checkmark_ms.png?alt=media\&token=29bb30d2-ce12-4579-b668-a655cbadf491)  | ![Blue Checkmark Ms](https://files.gitbook.com/v0/b/gitbook-legacy-files/o/assets%2F-MKZSsJBtSP9L4sqIe_q%2F-MPcdoF_aq80xKbOxNil%2F-MPcgrVqXQ0BHVq78Gxx%2Fblue_checkmark_ms.png?alt=media\&token=29bb30d2-ce12-4579-b668-a655cbadf491) | ![Blue Checkmark Ms](https://files.gitbook.com/v0/b/gitbook-legacy-files/o/assets%2F-MKZSsJBtSP9L4sqIe_q%2F-MPcdoF_aq80xKbOxNil%2F-MPcgrVqXQ0BHVq78Gxx%2Fblue_checkmark_ms.png?alt=media\&token=29bb30d2-ce12-4579-b668-a655cbadf491) | ![Blue Checkmark Ms](https://files.gitbook.com/v0/b/gitbook-legacy-files/o/assets%2F-MKZSsJBtSP9L4sqIe_q%2F-MPcdoF_aq80xKbOxNil%2F-MPcgrVqXQ0BHVq78Gxx%2Fblue_checkmark_ms.png?alt=media\&token=29bb30d2-ce12-4579-b668-a655cbadf491) | ![Blue Checkmark Ms](https://files.gitbook.com/v0/b/gitbook-legacy-files/o/assets%2F-MKZSsJBtSP9L4sqIe_q%2F-MPcdoF_aq80xKbOxNil%2F-MPcgrVqXQ0BHVq78Gxx%2Fblue_checkmark_ms.png?alt=media\&token=29bb30d2-ce12-4579-b668-a655cbadf491)  | ![Blue Checkmark Ms](https://files.gitbook.com/v0/b/gitbook-legacy-files/o/assets%2F-MKZSsJBtSP9L4sqIe_q%2F-MPcdoF_aq80xKbOxNil%2F-MPcgrVqXQ0BHVq78Gxx%2Fblue_checkmark_ms.png?alt=media\&token=29bb30d2-ce12-4579-b668-a655cbadf491) | -                                                                                                                                                                                                                                     | -                                                                                                                                                                                                                                     |
| BarChart            | -                                                                                                                                                                                                                                     | ![Blue Checkmark Ms](https://files.gitbook.com/v0/b/gitbook-legacy-files/o/assets%2F-MKZSsJBtSP9L4sqIe_q%2F-MPcdoF_aq80xKbOxNil%2F-MPcgrVqXQ0BHVq78Gxx%2Fblue_checkmark_ms.png?alt=media\&token=29bb30d2-ce12-4579-b668-a655cbadf491)  | ![Blue Checkmark Ms](https://files.gitbook.com/v0/b/gitbook-legacy-files/o/assets%2F-MKZSsJBtSP9L4sqIe_q%2F-MPcdoF_aq80xKbOxNil%2F-MPcgrVqXQ0BHVq78Gxx%2Fblue_checkmark_ms.png?alt=media\&token=29bb30d2-ce12-4579-b668-a655cbadf491) | ![Blue Checkmark Ms](https://files.gitbook.com/v0/b/gitbook-legacy-files/o/assets%2F-MKZSsJBtSP9L4sqIe_q%2F-MPcdoF_aq80xKbOxNil%2F-MPcgrVqXQ0BHVq78Gxx%2Fblue_checkmark_ms.png?alt=media\&token=29bb30d2-ce12-4579-b668-a655cbadf491) | ![Blue Checkmark Ms](https://files.gitbook.com/v0/b/gitbook-legacy-files/o/assets%2F-MKZSsJBtSP9L4sqIe_q%2F-MPcdoF_aq80xKbOxNil%2F-MPcgrVqXQ0BHVq78Gxx%2Fblue_checkmark_ms.png?alt=media\&token=29bb30d2-ce12-4579-b668-a655cbadf491) | -                                                                                                                                                                                                                                      | ![Blue Checkmark Ms](https://files.gitbook.com/v0/b/gitbook-legacy-files/o/assets%2F-MKZSsJBtSP9L4sqIe_q%2F-MPcdoF_aq80xKbOxNil%2F-MPcgrVqXQ0BHVq78Gxx%2Fblue_checkmark_ms.png?alt=media\&token=29bb30d2-ce12-4579-b668-a655cbadf491) | ![Blue Checkmark Ms](https://files.gitbook.com/v0/b/gitbook-legacy-files/o/assets%2F-MKZSsJBtSP9L4sqIe_q%2F-MPcdoF_aq80xKbOxNil%2F-MPcgrVqXQ0BHVq78Gxx%2Fblue_checkmark_ms.png?alt=media\&token=29bb30d2-ce12-4579-b668-a655cbadf491) | ![Blue Checkmark Ms](https://files.gitbook.com/v0/b/gitbook-legacy-files/o/assets%2F-MKZSsJBtSP9L4sqIe_q%2F-MPcdoF_aq80xKbOxNil%2F-MPcgrVqXQ0BHVq78Gxx%2Fblue_checkmark_ms.png?alt=media\&token=29bb30d2-ce12-4579-b668-a655cbadf491) |
| IQ-Feed             | -                                                                                                                                                                                                                                     | ![Blue Checkmark Ms](https://files.gitbook.com/v0/b/gitbook-legacy-files/o/assets%2F-MKZSsJBtSP9L4sqIe_q%2F-MPcdoF_aq80xKbOxNil%2F-MPcgrVqXQ0BHVq78Gxx%2Fblue_checkmark_ms.png?alt=media\&token=29bb30d2-ce12-4579-b668-a655cbadf491)  | ![Blue Checkmark Ms](https://files.gitbook.com/v0/b/gitbook-legacy-files/o/assets%2F-MKZSsJBtSP9L4sqIe_q%2F-MPcdoF_aq80xKbOxNil%2F-MPcgrVqXQ0BHVq78Gxx%2Fblue_checkmark_ms.png?alt=media\&token=29bb30d2-ce12-4579-b668-a655cbadf491) | ![Blue Checkmark Ms](https://files.gitbook.com/v0/b/gitbook-legacy-files/o/assets%2F-MKZSsJBtSP9L4sqIe_q%2F-MPcdoF_aq80xKbOxNil%2F-MPcgrVqXQ0BHVq78Gxx%2Fblue_checkmark_ms.png?alt=media\&token=29bb30d2-ce12-4579-b668-a655cbadf491) | ![Blue Checkmark Ms](https://files.gitbook.com/v0/b/gitbook-legacy-files/o/assets%2F-MKZSsJBtSP9L4sqIe_q%2F-MPcdoF_aq80xKbOxNil%2F-MPcgrVqXQ0BHVq78Gxx%2Fblue_checkmark_ms.png?alt=media\&token=29bb30d2-ce12-4579-b668-a655cbadf491) | -                                                                                                                                                                                                                                      | ![Blue Checkmark Ms](https://files.gitbook.com/v0/b/gitbook-legacy-files/o/assets%2F-MKZSsJBtSP9L4sqIe_q%2F-MPcdoF_aq80xKbOxNil%2F-MPcgrVqXQ0BHVq78Gxx%2Fblue_checkmark_ms.png?alt=media\&token=29bb30d2-ce12-4579-b668-a655cbadf491) | ![Blue Checkmark Ms](https://files.gitbook.com/v0/b/gitbook-legacy-files/o/assets%2F-MKZSsJBtSP9L4sqIe_q%2F-MPcdoF_aq80xKbOxNil%2F-MPcgrVqXQ0BHVq78Gxx%2Fblue_checkmark_ms.png?alt=media\&token=29bb30d2-ce12-4579-b668-a655cbadf491) | ![Blue Checkmark Ms](https://files.gitbook.com/v0/b/gitbook-legacy-files/o/assets%2F-MKZSsJBtSP9L4sqIe_q%2F-MPcdoF_aq80xKbOxNil%2F-MPcgrVqXQ0BHVq78Gxx%2Fblue_checkmark_ms.png?alt=media\&token=29bb30d2-ce12-4579-b668-a655cbadf491) |
| FxFlat              | ![Blue Checkmark Ms](https://files.gitbook.com/v0/b/gitbook-legacy-files/o/assets%2F-MKZSsJBtSP9L4sqIe_q%2F-MPcdoF_aq80xKbOxNil%2F-MPcgrVqXQ0BHVq78Gxx%2Fblue_checkmark_ms.png?alt=media\&token=29bb30d2-ce12-4579-b668-a655cbadf491) | ![Blue Checkmark Ms](https://files.gitbook.com/v0/b/gitbook-legacy-files/o/assets%2F-MKZSsJBtSP9L4sqIe_q%2F-MPcdoF_aq80xKbOxNil%2F-MPcgrVqXQ0BHVq78Gxx%2Fblue_checkmark_ms.png?alt=media\&token=29bb30d2-ce12-4579-b668-a655cbadf491)  | -                                                                                                                                                                                                                                     | ![Blue Checkmark Ms](https://files.gitbook.com/v0/b/gitbook-legacy-files/o/assets%2F-MKZSsJBtSP9L4sqIe_q%2F-MPcdoF_aq80xKbOxNil%2F-MPcgrVqXQ0BHVq78Gxx%2Fblue_checkmark_ms.png?alt=media\&token=29bb30d2-ce12-4579-b668-a655cbadf491) | ![Blue Checkmark Ms](https://files.gitbook.com/v0/b/gitbook-legacy-files/o/assets%2F-MKZSsJBtSP9L4sqIe_q%2F-MPcdoF_aq80xKbOxNil%2F-MPcgrVqXQ0BHVq78Gxx%2Fblue_checkmark_ms.png?alt=media\&token=29bb30d2-ce12-4579-b668-a655cbadf491) | ![Blue Checkmark Ms](https://files.gitbook.com/v0/b/gitbook-legacy-files/o/assets%2F-MKZSsJBtSP9L4sqIe_q%2F-MPcdoF_aq80xKbOxNil%2F-MPcgrVqXQ0BHVq78Gxx%2Fblue_checkmark_ms.png?alt=media\&token=29bb30d2-ce12-4579-b668-a655cbadf491)  | ![Blue Checkmark Ms](https://files.gitbook.com/v0/b/gitbook-legacy-files/o/assets%2F-MKZSsJBtSP9L4sqIe_q%2F-MPcdoF_aq80xKbOxNil%2F-MPcgrVqXQ0BHVq78Gxx%2Fblue_checkmark_ms.png?alt=media\&token=29bb30d2-ce12-4579-b668-a655cbadf491) | -                                                                                                                                                                                                                                     | -                                                                                                                                                                                                                                     |
| Rithmic             | ![Blue Checkmark Ms](https://files.gitbook.com/v0/b/gitbook-legacy-files/o/assets%2F-MKZSsJBtSP9L4sqIe_q%2F-MPcdoF_aq80xKbOxNil%2F-MPcgrVqXQ0BHVq78Gxx%2Fblue_checkmark_ms.png?alt=media\&token=29bb30d2-ce12-4579-b668-a655cbadf491) | ![Blue Checkmark Ms](https://files.gitbook.com/v0/b/gitbook-legacy-files/o/assets%2F-MKZSsJBtSP9L4sqIe_q%2F-MPcdoF_aq80xKbOxNil%2F-MPcgrVqXQ0BHVq78Gxx%2Fblue_checkmark_ms.png?alt=media\&token=29bb30d2-ce12-4579-b668-a655cbadf491)  | ![Blue Checkmark Ms](https://files.gitbook.com/v0/b/gitbook-legacy-files/o/assets%2F-MKZSsJBtSP9L4sqIe_q%2F-MPcdoF_aq80xKbOxNil%2F-MPcgrVqXQ0BHVq78Gxx%2Fblue_checkmark_ms.png?alt=media\&token=29bb30d2-ce12-4579-b668-a655cbadf491) | ![Blue Checkmark Ms](https://files.gitbook.com/v0/b/gitbook-legacy-files/o/assets%2F-MKZSsJBtSP9L4sqIe_q%2F-MPcdoF_aq80xKbOxNil%2F-MPcgrVqXQ0BHVq78Gxx%2Fblue_checkmark_ms.png?alt=media\&token=29bb30d2-ce12-4579-b668-a655cbadf491) | ![Blue Checkmark Ms](https://files.gitbook.com/v0/b/gitbook-legacy-files/o/assets%2F-MKZSsJBtSP9L4sqIe_q%2F-MPcdoF_aq80xKbOxNil%2F-MPcgrVqXQ0BHVq78Gxx%2Fblue_checkmark_ms.png?alt=media\&token=29bb30d2-ce12-4579-b668-a655cbadf491) | -                                                                                                                                                                                                                                      | -                                                                                                                                                                                                                                     | -                                                                                                                                                                                                                                     | ![Blue Checkmark Ms](https://files.gitbook.com/v0/b/gitbook-legacy-files/o/assets%2F-MKZSsJBtSP9L4sqIe_q%2F-MPcdoF_aq80xKbOxNil%2F-MPcgrVqXQ0BHVq78Gxx%2Fblue_checkmark_ms.png?alt=media\&token=29bb30d2-ce12-4579-b668-a655cbadf491) |
| Lenz and Partner    | -                                                                                                                                                                                                                                     | ![Blue Checkmark Ms](https://files.gitbook.com/v0/b/gitbook-legacy-files/o/assets%2F-MKZSsJBtSP9L4sqIe_q%2F-MPcdoF_aq80xKbOxNil%2F-MPcgrVqXQ0BHVq78Gxx%2Fblue_checkmark_ms.png?alt=media\&token=29bb30d2-ce12-4579-b668-a655cbadf491)  | ![Blue Checkmark Ms](https://files.gitbook.com/v0/b/gitbook-legacy-files/o/assets%2F-MKZSsJBtSP9L4sqIe_q%2F-MPcdoF_aq80xKbOxNil%2F-MPcgrVqXQ0BHVq78Gxx%2Fblue_checkmark_ms.png?alt=media\&token=29bb30d2-ce12-4579-b668-a655cbadf491) | ![Blue Checkmark Ms](https://files.gitbook.com/v0/b/gitbook-legacy-files/o/assets%2F-MKZSsJBtSP9L4sqIe_q%2F-MPcdoF_aq80xKbOxNil%2F-MPcgrVqXQ0BHVq78Gxx%2Fblue_checkmark_ms.png?alt=media\&token=29bb30d2-ce12-4579-b668-a655cbadf491) | ![Blue Checkmark Ms](https://files.gitbook.com/v0/b/gitbook-legacy-files/o/assets%2F-MKZSsJBtSP9L4sqIe_q%2F-MPcdoF_aq80xKbOxNil%2F-MPcgrVqXQ0BHVq78Gxx%2Fblue_checkmark_ms.png?alt=media\&token=29bb30d2-ce12-4579-b668-a655cbadf491) | ![Blue Checkmark Ms](https://files.gitbook.com/v0/b/gitbook-legacy-files/o/assets%2F-MKZSsJBtSP9L4sqIe_q%2F-MPcdoF_aq80xKbOxNil%2F-MPcgrVqXQ0BHVq78Gxx%2Fblue_checkmark_ms.png?alt=media\&token=29bb30d2-ce12-4579-b668-a655cbadf491)  | ![Blue Checkmark Ms](https://files.gitbook.com/v0/b/gitbook-legacy-files/o/assets%2F-MKZSsJBtSP9L4sqIe_q%2F-MPcdoF_aq80xKbOxNil%2F-MPcgrVqXQ0BHVq78Gxx%2Fblue_checkmark_ms.png?alt=media\&token=29bb30d2-ce12-4579-b668-a655cbadf491) | ![Blue Checkmark Ms](https://files.gitbook.com/v0/b/gitbook-legacy-files/o/assets%2F-MKZSsJBtSP9L4sqIe_q%2F-MPcdoF_aq80xKbOxNil%2F-MPcgrVqXQ0BHVq78Gxx%2Fblue_checkmark_ms.png?alt=media\&token=29bb30d2-ce12-4579-b668-a655cbadf491) | ![Blue Checkmark Ms](https://files.gitbook.com/v0/b/gitbook-legacy-files/o/assets%2F-MKZSsJBtSP9L4sqIe_q%2F-MPcdoF_aq80xKbOxNil%2F-MPcgrVqXQ0BHVq78Gxx%2Fblue_checkmark_ms.png?alt=media\&token=29bb30d2-ce12-4579-b668-a655cbadf491) |
| AMP                 | ![Blue Checkmark Ms](https://files.gitbook.com/v0/b/gitbook-legacy-files/o/assets%2F-MKZSsJBtSP9L4sqIe_q%2F-MPcdoF_aq80xKbOxNil%2F-MPcgrVqXQ0BHVq78Gxx%2Fblue_checkmark_ms.png?alt=media\&token=29bb30d2-ce12-4579-b668-a655cbadf491) | ![Blue Checkmark Ms](https://files.gitbook.com/v0/b/gitbook-legacy-files/o/assets%2F-MKZSsJBtSP9L4sqIe_q%2F-MPcdoF_aq80xKbOxNil%2F-MPcgrVqXQ0BHVq78Gxx%2Fblue_checkmark_ms.png?alt=media\&token=29bb30d2-ce12-4579-b668-a655cbadf491)  | ![Blue Checkmark Ms](https://files.gitbook.com/v0/b/gitbook-legacy-files/o/assets%2F-MKZSsJBtSP9L4sqIe_q%2F-MPcdoF_aq80xKbOxNil%2F-MPcgrVqXQ0BHVq78Gxx%2Fblue_checkmark_ms.png?alt=media\&token=29bb30d2-ce12-4579-b668-a655cbadf491) | ![Blue Checkmark Ms](https://files.gitbook.com/v0/b/gitbook-legacy-files/o/assets%2F-MKZSsJBtSP9L4sqIe_q%2F-MPcdoF_aq80xKbOxNil%2F-MPcgrVqXQ0BHVq78Gxx%2Fblue_checkmark_ms.png?alt=media\&token=29bb30d2-ce12-4579-b668-a655cbadf491) | ![Blue Checkmark Ms](https://files.gitbook.com/v0/b/gitbook-legacy-files/o/assets%2F-MKZSsJBtSP9L4sqIe_q%2F-MPcdoF_aq80xKbOxNil%2F-MPcgrVqXQ0BHVq78Gxx%2Fblue_checkmark_ms.png?alt=media\&token=29bb30d2-ce12-4579-b668-a655cbadf491) | -                                                                                                                                                                                                                                      | -                                                                                                                                                                                                                                     | -                                                                                                                                                                                                                                     | ![Blue Checkmark Ms](https://files.gitbook.com/v0/b/gitbook-legacy-files/o/assets%2F-MKZSsJBtSP9L4sqIe_q%2F-MPcdoF_aq80xKbOxNil%2F-MPcgrVqXQ0BHVq78Gxx%2Fblue_checkmark_ms.png?alt=media\&token=29bb30d2-ce12-4579-b668-a655cbadf491) |
| GainFutures         | ![Blue Checkmark Ms](https://files.gitbook.com/v0/b/gitbook-legacy-files/o/assets%2F-MKZSsJBtSP9L4sqIe_q%2F-MPcdoF_aq80xKbOxNil%2F-MPcgrVqXQ0BHVq78Gxx%2Fblue_checkmark_ms.png?alt=media\&token=29bb30d2-ce12-4579-b668-a655cbadf491) | ![Blue Checkmark Ms](https://files.gitbook.com/v0/b/gitbook-legacy-files/o/assets%2F-MKZSsJBtSP9L4sqIe_q%2F-MPcdoF_aq80xKbOxNil%2F-MPcgrVqXQ0BHVq78Gxx%2Fblue_checkmark_ms.png?alt=media\&token=29bb30d2-ce12-4579-b668-a655cbadf491)  | ![Blue Checkmark Ms](https://files.gitbook.com/v0/b/gitbook-legacy-files/o/assets%2F-MKZSsJBtSP9L4sqIe_q%2F-MPcdoF_aq80xKbOxNil%2F-MPcgrVqXQ0BHVq78Gxx%2Fblue_checkmark_ms.png?alt=media\&token=29bb30d2-ce12-4579-b668-a655cbadf491) | ![Blue Checkmark Ms](https://files.gitbook.com/v0/b/gitbook-legacy-files/o/assets%2F-MKZSsJBtSP9L4sqIe_q%2F-MPcdoF_aq80xKbOxNil%2F-MPcgrVqXQ0BHVq78Gxx%2Fblue_checkmark_ms.png?alt=media\&token=29bb30d2-ce12-4579-b668-a655cbadf491) | ![Blue Checkmark Ms](https://files.gitbook.com/v0/b/gitbook-legacy-files/o/assets%2F-MKZSsJBtSP9L4sqIe_q%2F-MPcdoF_aq80xKbOxNil%2F-MPcgrVqXQ0BHVq78Gxx%2Fblue_checkmark_ms.png?alt=media\&token=29bb30d2-ce12-4579-b668-a655cbadf491) | -                                                                                                                                                                                                                                      | ![Blue Checkmark Ms](https://files.gitbook.com/v0/b/gitbook-legacy-files/o/assets%2F-MKZSsJBtSP9L4sqIe_q%2F-MPcdoF_aq80xKbOxNil%2F-MPcgrVqXQ0BHVq78Gxx%2Fblue_checkmark_ms.png?alt=media\&token=29bb30d2-ce12-4579-b668-a655cbadf491) | -                                                                                                                                                                                                                                     | ![Blue Checkmark Ms](https://files.gitbook.com/v0/b/gitbook-legacy-files/o/assets%2F-MKZSsJBtSP9L4sqIe_q%2F-MPcdoF_aq80xKbOxNil%2F-MPcgrVqXQ0BHVq78Gxx%2Fblue_checkmark_ms.png?alt=media\&token=29bb30d2-ce12-4579-b668-a655cbadf491) |
| MetaTrader 5        | ![Blue Checkmark Ms](https://files.gitbook.com/v0/b/gitbook-legacy-files/o/assets%2F-MKZSsJBtSP9L4sqIe_q%2F-MPcdoF_aq80xKbOxNil%2F-MPcgrVqXQ0BHVq78Gxx%2Fblue_checkmark_ms.png?alt=media\&token=29bb30d2-ce12-4579-b668-a655cbadf491) | ![Blue Checkmark Ms](https://files.gitbook.com/v0/b/gitbook-legacy-files/o/assets%2F-MKZSsJBtSP9L4sqIe_q%2F-MPcdoF_aq80xKbOxNil%2F-MPcgrVqXQ0BHVq78Gxx%2Fblue_checkmark_ms.png?alt=media\&token=29bb30d2-ce12-4579-b668-a655cbadf491)  | ![Blue Checkmark Ms](https://files.gitbook.com/v0/b/gitbook-legacy-files/o/assets%2F-MKZSsJBtSP9L4sqIe_q%2F-MPcdoF_aq80xKbOxNil%2F-MPcgrVqXQ0BHVq78Gxx%2Fblue_checkmark_ms.png?alt=media\&token=29bb30d2-ce12-4579-b668-a655cbadf491) | ![Blue Checkmark Ms](https://files.gitbook.com/v0/b/gitbook-legacy-files/o/assets%2F-MKZSsJBtSP9L4sqIe_q%2F-MPcdoF_aq80xKbOxNil%2F-MPcgrVqXQ0BHVq78Gxx%2Fblue_checkmark_ms.png?alt=media\&token=29bb30d2-ce12-4579-b668-a655cbadf491) | ![Blue Checkmark Ms](https://files.gitbook.com/v0/b/gitbook-legacy-files/o/assets%2F-MKZSsJBtSP9L4sqIe_q%2F-MPcdoF_aq80xKbOxNil%2F-MPcgrVqXQ0BHVq78Gxx%2Fblue_checkmark_ms.png?alt=media\&token=29bb30d2-ce12-4579-b668-a655cbadf491) | ![Blue Checkmark Ms](https://files.gitbook.com/v0/b/gitbook-legacy-files/o/assets%2F-MKZSsJBtSP9L4sqIe_q%2F-MPcdoF_aq80xKbOxNil%2F-MPcgrVqXQ0BHVq78Gxx%2Fblue_checkmark_ms.png?alt=media\&token=29bb30d2-ce12-4579-b668-a655cbadf491)  | ![Blue Checkmark Ms](https://files.gitbook.com/v0/b/gitbook-legacy-files/o/assets%2F-MKZSsJBtSP9L4sqIe_q%2F-MPcdoF_aq80xKbOxNil%2F-MPcgrVqXQ0BHVq78Gxx%2Fblue_checkmark_ms.png?alt=media\&token=29bb30d2-ce12-4579-b668-a655cbadf491) | ![Blue Checkmark Ms](https://files.gitbook.com/v0/b/gitbook-legacy-files/o/assets%2F-MKZSsJBtSP9L4sqIe_q%2F-MPcdoF_aq80xKbOxNil%2F-MPcgrVqXQ0BHVq78Gxx%2Fblue_checkmark_ms.png?alt=media\&token=29bb30d2-ce12-4579-b668-a655cbadf491) | ![Blue Checkmark Ms](https://files.gitbook.com/v0/b/gitbook-legacy-files/o/assets%2F-MKZSsJBtSP9L4sqIe_q%2F-MPcdoF_aq80xKbOxNil%2F-MPcgrVqXQ0BHVq78Gxx%2Fblue_checkmark_ms.png?alt=media\&token=29bb30d2-ce12-4579-b668-a655cbadf491) |

<figure><img src="/files/-MPcgrVqXQ0BHVq78Gxx" alt=""><figcaption></figcaption></figure>

*Notes:*

* "[ ](https://agenatrader.com/wiki/tiki-download_file.php?fileId=19\&display)![Blue Checkmark Ms](https://files.gitbook.com/v0/b/gitbook-legacy-files/o/assets%2F-MKZSsJBtSP9L4sqIe_q%2F-MPcdoF_aq80xKbOxNil%2F-MPcgrVqXQ0BHVq78Gxx%2Fblue_checkmark_ms.png?alt=media\&token=29bb30d2-ce12-4579-b668-a655cbadf491)1" includes only 60 data histories every 10 minutes
* " ![Blue Checkmark Ms](https://files.gitbook.com/v0/b/gitbook-legacy-files/o/assets%2F-MKZSsJBtSP9L4sqIe_q%2F-MPcdoF_aq80xKbOxNil%2F-MPcgrVqXQ0BHVq78Gxx%2Fblue_checkmark_ms.png?alt=media\&token=29bb30d2-ce12-4579-b668-a655cbadf491)2" fundamentally possible but still not recommended / enabled by Interactive Brokers
* "![Blue Checkmark Ms](https://files.gitbook.com/v0/b/gitbook-legacy-files/o/assets%2F-MKZSsJBtSP9L4sqIe_q%2F-MPcdoF_aq80xKbOxNil%2F-MPcgrVqXQ0BHVq78Gxx%2Fblue_checkmark_ms.png?alt=media\&token=29bb30d2-ce12-4579-b668-a655cbadf491)3" realtime only for stocks and options

**The supported data feed providers and available brokerage services are displayed in the table**&#x20;

**FOREX markets**As a basic principle, forex markets should be served by the same data feed/broker via which you are trading. This means that the data will come from the same pool as the one that the orders are routed to. This ensures that the execution price always corresponds to the represented data on the chart. This is especially relevant for traded time frames under 1 minute.


# AgenaBroker

AgenaBroker is a fully-featured brokerage service that leverages **Interactive Brokers' technology**, offering a seamless and powerful trading experience. By opening an AgenaBroker account or transferring an existing one, traders gain access to the **AgenaTrader platform**, optimized for Interactive Brokers and Bloomberg-certified, completely **free of charge** once the account is funded.

## How to Connect to AgenaBroker

Since AgenaBroker is powered by **Interactive Brokers' technology**, all connection guides and technical details are available in the corresponding [**Interactive Brokers connection guide**](broken://pages/-MPF1pee1eUOz6jl4pWW#connecting). Simply follow the provided instructions to establish your connection and start trading with confidence.

## Why Choose AgenaBroker?

What sets AgenaBroker apart from other brokerage services is the **exclusive bundle of free add-ons** that traders receive upon opening an account. These add-ons, valued at **€7,280**, provide essential tools for enhanced market analysis, strategy development, and trading efficiency.

### Free Add-On Package Includes:

* **AgenaTrader Full Version** – Access the complete trading platform without additional cost.
* **Professional Tools** such as:
  * DowTheory/Trendfollowing
  * Seasonality
  * COT-Report
  * Darvas Strategy
* **Advanced Features:**
  * CorrelationMatrix
  * Volume-Advanced
  * Options-Advanced
  * Dynamic Scanner
  * Trading-Journal Pro

With AgenaBroker, traders not only benefit from a professional-grade brokerage service but also gain access to a suite of premium features that enhance their trading strategies at no extra cost.

***

To learn more and get started, visit [**broker.agenatrader.com**](https://broker.agenatrader.com/) and take advantage of everything AgenaBroker has to offer!


# Technology Provider

This section provides an overview of all technology providers supported by AgenaTrader. Technology providers are companies or products that supply the infrastructure and technology enabling other brokers—often referred to as "whitelabel brokers"—to operate. These providers make it possible for brokers to offer their own branded services while leveraging the technology and infrastructure of the underlying provider.

For example, **Interactive Brokers** is a well-known technology provider. While they operate as a broker themselves, other brokers like CapTrader or AgenaBroker utilize Interactive Brokers' infrastructure to deliver their own services, including customized offerings and customer support.

If AgenaTrader supports a specific technology provider, this means **you can connect to any broker that uses that provider’s infrastructure**. This compatibility ensures a seamless trading experience, regardless of the broker you choose, as long as they are based on one of the listed technology providers.

Explore this section to find the complete list of supported technology providers and learn more about their role in powering brokers connected to AgenaTrader.

## Gain Capital <a href="#gain-capital" id="gain-capital"></a>

### About Gain Capital <a href="#about-gain-capital" id="about-gain-capital"></a>

GAIN Capital Futures is the wholesale brokerage division of GAIN Capital Group LLC. With a focus on Institutions and Introducing Brokers, we pride ourselves in providing the services and products that allow institutions and brokers to develop and grow their business.

GAIN Capital works with our clients and brokers to find the right solution for their trading needs. With our experience in exchange-traded futures and cash foreign exchange, GAIN Capital is positioned to provide the execution, clearing and customer service that brokers require

As a global trading firm, and publicly traded company as our parent, GAIN Capital must meet the highest standards of corporate governance, financial reporting and disclosure. Our financial transparency provides our customers and partners with confidence that the company is well managed and well capitalized, with ample resources to continue to innovate and lead the industry forward.

For more information on GAIN Capital please visit our website at <http://futures.gaincapital.com/>

## **Supported asset classes and order connections:**&#x20;

#### Supported are Futures and Currencies

### **Supported order connections:**&#x20;

OCO order connections are supported by this broker\
ORO order connections are locally simulated\
IFDone order connections are locally simulated

**Order execution** AgenaTrader does not execute any orders! Instead, brokers simply inform us of filled orders and execution price. If data received from your data feed provider does not match the quotes on the brokerage platform for an instrument, then the entry and exit price will not be displayed properly on your chart.

### Connection <a href="#connection" id="connection"></a>

Please follow the instructions in the following video to establish the connection correctly:

{% embed url="<https://www.youtube.com/watch?v=V2EMDauOS1M>" %}

{% hint style="info" %}

#### Important Note <a href="#important-note" id="important-note"></a>

THE BROKER'S PLATFORM ALWAYS REPRESENTS THE REFERENCE PLATFORM.

This means that the orders and market-related values shown on the BROKER platform are valid. The broker's platform should always be active as a backup to AgenaTrader. This gives you an essential overview of the interaction between AgenaTrader and your broker. Furthermore, you will always know exactly how your orders/positions and ultimately your account balance are displayed.
{% endhint %}

## Interactive Brokers <a href="#technology_provider__interactive_brokers__en" id="technology_provider__interactive_brokers__en"></a>

### Brief overview of Interactive Brokers <a href="#brief-overview-of-interactive-brokers" id="brief-overview-of-interactive-brokers"></a>

Interactive Brokers is a well-known company that has provided financial services as a broker and dealer since 1977. Essentially, IB specializes in intraday and institutional trading. The company developed its own trading platform - Trading Work Station (TWS) - and offers traders very advantageous commission and margin.

**Supported asset classes:** CFD's, Future, Forex, Index, Stock

**Supported orders:**

OCO order connections are supported by this broker \
ORO order connections are locally simulated \
IFDone order connections are locally simulated

**Order execution** AgenaTrader does not execute any orders! Instead, brokers simply inform us of filled orders and execution price. If data received from your data feed provider does not match the quotes on the brokerage platform for an instrument, then the entry and exit price will not be displayed properly on your chart.

You can open a real or demo account at Interactive Brokers or its whitelabel brokers, including [AgenaBroker](https://broker.agenatrader.com/).

**Supported Account Types by AgenaTrader**

* Standard Single Account (One Login and one connected main account)
* Financial Advicer (FA) Accounts (One Login with a main account and several sub-accounts), find more details [HERE](https://docs.agenatrader.com/main/broker-and-datafeed-connections/technology-provider#IB_Financial_Advisor_Accounts)
* Family and Friends (F) Accounts (One Login with a main accout and several sub-accounts), find more details [HERE](https://docs.agenatrader.com/main/broker-and-datafeed-connections/technology-provider#IB_Financial_Advisor_Accounts)

**Not supported Account Types by AgenaTrader**

* Duplicated Accounts (One Login and several connected main accounts)

(This Account Type is not supported and can lead to problems with order executions and data synchronization between TWS and AgenaTrader. Please contact your IB Account-Manager to change your Account to one of the above mentioned supported Account Types.)

### How to connect <a href="#connecting" id="connecting"></a>

Please follow the instructions in the following video to establish the connection correctly:

{% embed url="<https://www.youtube.com/watch?v=fWrQTn8nKFA>" %}

### &#x20;<a href="#essential_information" id="essential_information"></a>

### How to use IB Gateway and FA accounts <a href="#how-to-use-ib-gateway-and-fa-accounts" id="how-to-use-ib-gateway-and-fa-accounts"></a>

Please download and install IB Gateway through the [**Download Link**](https://www.interactivebrokers.eu/de/?f=16457)

**Important!** TWS should be installed.

*In order to install Gateway please use the following steps:*

* Please run gateway. In open Dialog activate checkbox IB API, enter your IB credentials, select Trading Mode and click the **Login** button.

<figure><img src="https://docs.agenatrader.com/~gitbook/image?url=https%3A%2F%2F2805764894-files.gitbook.io%2F%7E%2Ffiles%2Fv0%2Fb%2Fgitbook-legacy-files%2Fo%2Fassets%252F-MKZSsJBtSP9L4sqIe_q%252F-MPhn7zlMCA093nNUSJf%252F-MPi9QGr7VpCGhWXqYkh%252FGateway.png%3Falt%3Dmedia%26token%3D6693b5db-8742-485f-9608-fcc9d67622a8&#x26;width=768&#x26;dpr=4&#x26;quality=100&#x26;sign=f47360b8&#x26;sv=1" alt=""><figcaption></figcaption></figure>

* In the open window please go to **Configure-> Settings.**

<figure><img src="https://docs.agenatrader.com/~gitbook/image?url=https%3A%2F%2F2805764894-files.gitbook.io%2F%7E%2Ffiles%2Fv0%2Fb%2Fgitbook-legacy-files%2Fo%2Fassets%252F-MKZSsJBtSP9L4sqIe_q%252F-MPhn7zlMCA093nNUSJf%252F-MPi9QGsHcNALpfh4Ptv%252FGateway1.png%3Falt%3Dmedia%26token%3D529b698d-bf0d-4a94-95cd-e26988019d53&#x26;width=768&#x26;dpr=4&#x26;quality=100&#x26;sign=294ea6a4&#x26;sv=1" alt=""><figcaption></figcaption></figure>

* In **APi->Settings** please activate checkbox **Read-Only API.**

<figure><img src="https://docs.agenatrader.com/~gitbook/image?url=https%3A%2F%2F2805764894-files.gitbook.io%2F%7E%2Ffiles%2Fv0%2Fb%2Fgitbook-legacy-files%2Fo%2Fassets%252F-MKZSsJBtSP9L4sqIe_q%252F-MPhn7zlMCA093nNUSJf%252F-MPi9QGtBVm-vLbIkOd7%252FGateway2.png%3Falt%3Dmedia%26token%3D3c1859de-0bc9-4d08-b6fa-c7b45ae40ba3&#x26;width=768&#x26;dpr=4&#x26;quality=100&#x26;sign=aa79b43e&#x26;sv=1" alt=""><figcaption></figcaption></figure>

* After please create a new or edit existing IB connection in AgenaTrader. Please find IB connection guide on page [Technology Provider: Interactive Brokers](https://docs.agenatrader.com/main/broker-and-datafeed-connections/technology-provider#brief-overview-of-interactive-brokers). Please configure your account in AgenaTrader as on picture below. For **User** name and **Password** in AgenaTrader please use same credentials as for Gateway login.

<figure><img src="https://docs.agenatrader.com/~gitbook/image?url=https%3A%2F%2F2805764894-files.gitbook.io%2F%7E%2Ffiles%2Fv0%2Fb%2Fgitbook-legacy-files%2Fo%2Fassets%252F-MKZSsJBtSP9L4sqIe_q%252F-MPhn7zlMCA093nNUSJf%252F-MPi9QGu7ozAAfKWbHnX%252FGateway3.png%3Falt%3Dmedia%26token%3D040d4571-6538-42b8-bbbf-be57799aae74&#x26;width=768&#x26;dpr=4&#x26;quality=100&#x26;sign=f449a393&#x26;sv=1" alt=""><figcaption></figcaption></figure>

**Important!** First please run and login Ib Gateway and only then try to connect through the AgenaTrader. We have no ability to start Gateway automatically yet.

### IB Financial Advisor Accounts <a href="#ib_financial_advisor_accounts" id="ib_financial_advisor_accounts"></a>

**What are IB FA accounts and how can I use these in AgenaTrader?**

FA Account = Financial Advisor Account

You need to open an account as a financial advisor with IB or an IB white label. You can establish the connection just as with a normal IB account. In AgenaTrader, you can now choose with which account you would like to enter a trade under “Default Trading Accounts”. You have the option to carry out a trade on all sub-accounts or just on selected individual accounts.

If you wish to carry out the trade in all sub-accounts, there are various options for the ratio in which the position size should be distributed amongst the sub-accounts.

**Account Groups**

When you create an account group, you can assign sub-accounts to it that you want to belong to this group. For this group, you can now select an assignment method. The following options are available:

<figure><img src="https://docs.agenatrader.com/~gitbook/image?url=https%3A%2F%2F2805764894-files.gitbook.io%2F%7E%2Ffiles%2Fv0%2Fb%2Fgitbook-legacy-files%2Fo%2Fassets%252F-MKZSsJBtSP9L4sqIe_q%252F-MPhn7zlMCA093nNUSJf%252F-MPi9QGwQTyk_H3HO2yn%252FKontogruppen-1.png%3Falt%3Dmedia%26token%3D5c63efe2-93f3-4a34-b975-c99768412ead&#x26;width=768&#x26;dpr=4&#x26;quality=100&#x26;sign=3d16161e&#x26;sv=1" alt=""><figcaption></figcaption></figure>

* **EqualQuantity:** trades are distributed evenly amongst all accounts in the group. *Example:* you buy 400 Apple shares; your account group consists of 4 sub-accounts. In each account, a buy order of 100 Apple shares is now carried out.
* **NetLiq:** trades are distributed based on the net liquidation value of each sub-account. *Example:* Your account group consists of 3 sub-accounts, A, B and C with a net liquidation value of €25,000, €50,000 and €100,000. Based on these values, the system calculates a ratio of 1:2:4. If you now buy 700 Apple shares, then 100 shares are bought on account A, 200 on account B and 400 on account C.
* **AvailableEquity:** trades are distributed based on the available equity of the sub-accounts. *Example:* your account group consists of 3 sub-accounts, A, B and C with an equity of €25,000, €50,000 and €100,000. Based on these values, the system calculates a ratio of 1:2:4. If you now buy 700 Apple shares, then 100 shares are bought on account A, 200 on account B and 400 on account C.
* **PctChange:** the order size is calculated purely by the system, you simply enter a percentage by which an existing order in the sub-accounts should be increased or reduced. *Example:* currently, sub-account A has 100 Apple shares, B has 200 shares and C has 400 shares. You now want to reduce the stock of Apple shares by 50% in each sub-account. To do so, you open a short order and enter the value “50” into the percent field. Since you possess a total of 700 Apple shares, the system now calculates a total size of the short order of 350 shares and now correctly distributes this order amongst the sub-accounts (account A sell 50 shares, B sell 100 shares, C sell 200 shares).

You can find more information about the account groups [here.](https://www.interactivebrokers.com/en/software/tws/usersguidebook/financialadvisors/create_an_account_group_for_share_allocation.htm)

**Assignment Profiles**

Via an assignment profile, positions are assigned to all accounts in this profile based on a percentage, a certain ratio or an absolute number that you define. The following options are available:

<figure><img src="https://docs.agenatrader.com/~gitbook/image?url=https%3A%2F%2F2805764894-files.gitbook.io%2F%7E%2Ffiles%2Fv0%2Fb%2Fgitbook-legacy-files%2Fo%2Fassets%252F-MKZSsJBtSP9L4sqIe_q%252F-MPhn7zlMCA093nNUSJf%252F-MPi9QGxz5XkWInOGYp9%252FZuweisungsprofile.png%3Falt%3Dmedia%26token%3D9b635c74-adeb-4f48-ab74-14977241d648&#x26;width=768&#x26;dpr=4&#x26;quality=100&#x26;sign=646f7a1&#x26;sv=1" alt=""><figcaption></figcaption></figure>

* **Percentages**: the total number of instruments to be bought/sold is assigned to the respective sub-accounts based on the set percentages. *Example*: you have 5 sub-accounts with a percentage of 20% each. If you now buy 1000 Apple shares, a buy order of 200 Apple shares is now carried out in each sub-account.
* **Ratios**: the total number of instruments to be bought/sold is assigned to the respective sub-accounts based on the entered ratios. *Example*: you have 5 sub-accounts and have set a ratio of 1:2:3:4:5. If you now buy 1500 Apple shares, then 100, 200, 300, 400 and 500 shares are bought on the individual accounts respectively.
* **Shares**: here you can set an absolute number that is used for each account as the position size. *Example*: you have 3 sub-accounts and set an absolute number of 10 for each account. If you now place an order in the market, the position size is automatically set to 30, and in each account, an order of 10 units is carried out.

You can find more information about the account groups [here](https://www.interactivebrokers.com/en/software/tws/usersguidebook/financialadvisors/create_a_share_allocation_profile.htm).

In AgenaTrader, you can access the account settings for FA accounts using the following button:

<figure><img src="https://docs.agenatrader.com/~gitbook/image?url=https%3A%2F%2F2805764894-files.gitbook.io%2F%7E%2Ffiles%2Fv0%2Fb%2Fgitbook-legacy-files%2Fo%2Fassets%252F-MKZSsJBtSP9L4sqIe_q%252F-MPhn7zlMCA093nNUSJf%252F-MPi9QGzjgVeVxyym7lo%252FAccounts-im-AT.png%3Falt%3Dmedia%26token%3D51c432e3-9cb8-4a30-9c4b-b89042c1f563&#x26;width=768&#x26;dpr=4&#x26;quality=100&#x26;sign=c6e218c9&#x26;sv=1" alt=""><figcaption></figcaption></figure>

When you have established a connection to your IB FA account and have set the master account, you will find the option “Financial Advisor Profile” in the ActionBar in AgenaTrader. Here you can now select the profile that you would like to use for each trade.

<figure><img src="https://docs.agenatrader.com/~gitbook/image?url=https%3A%2F%2F2805764894-files.gitbook.io%2F%7E%2Ffiles%2Fv0%2Fb%2Fgitbook-legacy-files%2Fo%2Fassets%252F-MKZSsJBtSP9L4sqIe_q%252F-MPhn7zlMCA093nNUSJf%252F-MPi9QGy4kVQ8YWfUmxO%252FAccounts-Action-Bar.png%3Falt%3Dmedia%26token%3D32d4e09e-b42c-4a71-a5d1-8904ea097137&#x26;width=768&#x26;dpr=4&#x26;quality=100&#x26;sign=ff7d808a&#x26;sv=1" alt=""><figcaption></figcaption></figure>

{% hint style="info" %}
**Disclaimer:**

Exchange transactions are associated with significant risks. Those who trade on the financial and commodity markets must familiarize themselves with these risks. Possible analyses, techniques and methods presented here are not an invitation to trade on the financial and commodity markets. They serve only for illustration, further education, and information purposes, and do not constitute investment advice or personal recommendations in any way. They are intended only to facilitate the customer’s investment decision and do not replace the advice of an investor or specific investment advice. The customer trades completely at his or her own risk.
{% endhint %}

### Tipps and Tricks <a href="#essential_information" id="essential_information"></a>

**Message "The registration key for 'Trader Workstation' could not be found"** This message appears if the API settings have not been set for TWS according to the Connection Guide (see table above). Additional information about brokers can be found on our [website](https://agenatrader.com/broker/).

Also make sure that the file tws.exe is installed in the main directory "Jts". If a sub directory was created than this file with all the other files must be moved to the main directory. Only than AgenaTrader can autostart the TWS.

**Port settings**

Port settings in TWS and AgenaTrader must be synchronized if connection issues are experienced. That means, ports need to have the same number

<figure><img src="https://docs.agenatrader.com/~gitbook/image?url=https%3A%2F%2F2805764894-files.gitbook.io%2F%7E%2Ffiles%2Fv0%2Fb%2Fgitbook-legacy-files%2Fo%2Fassets%252F-MKZSsJBtSP9L4sqIe_q%252F-MPhn7zlMCA093nNUSJf%252F-MPi9QGvEIbMMguBz2iB%252FIB_port.png%3Falt%3Dmedia%26token%3D9c7e5d75-63ee-4d47-94f3-23f6b6b4479a&#x26;width=768&#x26;dpr=4&#x26;quality=100&#x26;sign=63f795b1&#x26;sv=1" alt=""><figcaption></figcaption></figure>

Please use following ports:&#x20;

**7497** - Demo account \
**7496** - Live account

For details please download [**IB Host and Ports Documentation**](https://issues.agenatrader.com/attachments/download/15123/IB%20Host%20and%20Ports.pdf) file.

**Automated Reconnection**

AgenaTrader has an implemented logic which automatically reconnects if the connection was lost without means. If you use a VPS server and the Windows Remote Desktop software this logic can have problems because when the Windows Remote Desktop was closed all the Windows function for starting programs are locked and the reconnection process cannot be established. Please use other Remote Software tools like Teamviewer or Anydesk.

**Client ID**

In some cases user can get notification:

<figure><img src="https://docs.agenatrader.com/~gitbook/image?url=https%3A%2F%2F2805764894-files.gitbook.io%2F%7E%2Ffiles%2Fv0%2Fb%2Fgitbook-legacy-files%2Fo%2Fassets%252F-MKZSsJBtSP9L4sqIe_q%252F-MPhn7zlMCA093nNUSJf%252F-MPiARttis-oD88Qporu%252FIB_notification.png%3Falt%3Dmedia%26token%3D826c57a3-e6d5-470d-8f41-afd3852bf78d&#x26;width=768&#x26;dpr=4&#x26;quality=100&#x26;sign=651bd02f&#x26;sv=1" alt=""><figcaption></figcaption></figure>

It means ClientID in AT and TWS differs. ClientID must be synchronous between AT and TWS, as otherwise information is not transmitted correctly to the AT. To avoid this User should synchronize the ClientIDs because of the two attachments, or set them to 0 in AT and delete them in the TWS.

<figure><img src="https://docs.agenatrader.com/~gitbook/image?url=https%3A%2F%2F2805764894-files.gitbook.io%2F%7E%2Ffiles%2Fv0%2Fb%2Fgitbook-legacy-files%2Fo%2Fassets%252F-MKZSsJBtSP9L4sqIe_q%252F-MPhn7zlMCA093nNUSJf%252F-MPiARts28g-MpUiX2Nn%252FIB_client.png%3Falt%3Dmedia%26token%3D486bbf85-ca95-4a35-9411-9abd8fa9f566&#x26;width=768&#x26;dpr=4&#x26;quality=100&#x26;sign=55f7a167&#x26;sv=1" alt=""><figcaption></figcaption></figure>

### How to change TWS version from Latest to Stable <a href="#how-to-change-tws-version-from-latest-to-stable" id="how-to-change-tws-version-from-latest-to-stable"></a>

In order to switch to the stable version of the TWS, please follow these steps:

* Go to your TWS install location and run TWS.exe. The default installation path is: **C:\Jts (for Captrader: C:\Jts\generic)**

<figure><img src="https://docs.agenatrader.com/~gitbook/image?url=https%3A%2F%2F2805764894-files.gitbook.io%2F%7E%2Ffiles%2Fv0%2Fb%2Fgitbook-legacy-files%2Fo%2Fassets%252F-MKZSsJBtSP9L4sqIe_q%252F-MPhn7zlMCA093nNUSJf%252F-MPiARtu0ochNXuBRMkO%252FTWS%2520path.png%3Falt%3Dmedia%26token%3D084732cf-5934-4859-b551-d13fb5a32f5b&#x26;width=768&#x26;dpr=4&#x26;quality=100&#x26;sign=aadd1f82&#x26;sv=1" alt=""><figcaption></figcaption></figure>

* A login dialog window will appear. Select "More Options" there

<figure><img src="https://docs.agenatrader.com/~gitbook/image?url=https%3A%2F%2F2805764894-files.gitbook.io%2F%7E%2Ffiles%2Fv0%2Fb%2Fgitbook-legacy-files%2Fo%2Fassets%252F-MKZSsJBtSP9L4sqIe_q%252F-MPhn7zlMCA093nNUSJf%252F-MPiARtw9f9UK7RHXr--%252FYWS%2520more%2520option.png%3Falt%3Dmedia%26token%3Dfa78e59e-467b-4676-961d-8d114131b40e&#x26;width=768&#x26;dpr=4&#x26;quality=100&#x26;sign=6b6ee38f&#x26;sv=1" alt=""><figcaption></figcaption></figure>

* You can now adjust some additional settings. Change the version from Latest to Stable there.

<figure><img src="https://docs.agenatrader.com/~gitbook/image?url=https%3A%2F%2F2805764894-files.gitbook.io%2F%7E%2Ffiles%2Fv0%2Fb%2Fgitbook-legacy-files%2Fo%2Fassets%252F-MKZSsJBtSP9L4sqIe_q%252F-MPhn7zlMCA093nNUSJf%252F-MPiARtvIzGDt-nW_L3N%252FTWS%2520stable.png%3Falt%3Dmedia%26token%3D0fd39ef7-a5e5-4e9b-908f-25cec8ea23de&#x26;width=768&#x26;dpr=4&#x26;quality=100&#x26;sign=45953b01&#x26;sv=1" alt=""><figcaption></figcaption></figure>

* Apply made changes by clicking on the "Apply & Restart" button

After the installation process is finished, you will be using the stable version of the TWS instead of the latest one.

<figure><img src="https://docs.agenatrader.com/~gitbook/image?url=https%3A%2F%2F2805764894-files.gitbook.io%2F%7E%2Ffiles%2Fv0%2Fb%2Fgitbook-legacy-files%2Fo%2Fassets%252F-MKZSsJBtSP9L4sqIe_q%252F-MPhn7zlMCA093nNUSJf%252F-MPiARtxyZ55ze8cWv1O%252FYWS%2520apply.png%3Falt%3Dmedia%26token%3D12dd73d4-ee6d-42d2-9e5d-50f924e7a732&#x26;width=768&#x26;dpr=4&#x26;quality=100&#x26;sign=6c43d0f7&#x26;sv=1" alt=""><figcaption></figcaption></figure>

### ІB as a data feed <a href="#essential_information" id="essential_information"></a>

**Historical Request Overflow**

The maximum number of simultaneous open historical data requests from the API is 50. So you should take care that you have a much smaller number of requests pending at a time.

**Pacing Violations for Small Bars (30 secs or less)** A Pacing Violation occurs whenever you do not observe one or more of the following restriction: -> Making identical historical data requests within 15 seconds. -> Making six or more historical data requests for the same Contract, Exchange and Tick Type within two seconds. -> Making more than 60 requests within any ten minute period.

However, be careful when requesting large amounts of historical data or sending historical data requests as "soft limit' is still implemented. If you request too much of historical data you will get disconnected from API client. You can find further information about the pacing violations for small bars in [this IB article](https://interactivebrokers.github.io/tws-api/historical_limitations.html). Please note:

1 instrument in 3 timeframes = 3 histories 1 Analyzer Column column = 1 history Watch lists, backtest lists, indicators and alerts also require histories.

<figure><img src="https://docs.agenatrader.com/~gitbook/image?url=https%3A%2F%2Fagenatrader.com%2Fwiki%2Ftiki-download_file.php%3FfileId%3D1879%26display%26max%3D10000&#x26;width=768&#x26;dpr=4&#x26;quality=100&#x26;sign=f43580b2&#x26;sv=1" alt=""><figcaption></figcaption></figure>

For each Trade/Order running in TWS will require corresponding L1 + Option subscriptions and could cause 'overload.

**Limitation**

For each bar size AgenaTrader provide historical data for the limited period of time.

Please see table below:

| Bar Size        | Time Period  |
| --------------- | ------------ |
| 1 - 4 sec bars  | 30 min back  |
| 5 - 9 sec bars  | 1 h back     |
| 10 -29 sec bars | 4 h back     |
| 30 - 59 sec     | 8 h back     |
| 1 min           | 1 day back   |
| 2 min           | 2 days back  |
| 3 - 29 min      | 1 week back  |
| 30 m - 1439 min | 1 month back |
| 1-23 h          | 1 month back |
| EoD (1 Day)     | 1 year back  |

**Futures Contracts**

The IB API does not support Continuous Contracts. This means that AgenaTrader can only show one Contract e.g. FrontMonth. In order to compare the data in TWS with AgenaTrader please do not use Continuous Contracts.

**Supported Time Zones**

| Time Zone | Description              |
| --------- | ------------------------ |
| GMT       | Greenwich Mean Time      |
| EST       | Eastern Standard Time    |
| MST       | Mountain Standard Time   |
| PST       | Pacific Standard Time    |
| AST       | Atlantic Standard Time   |
| JST       | Japan Standard Time      |
| AET       | Australian Standard Time |

Please download [**API Reference Guide.pdf** ](https://www.interactivebrokers.com/download/newMark/PDFs/APIprintable.pdf)file. Time zones section in Chapter 9, page 571

**Delayed data**

A market data subscription is required to receive historical data from the IB-API. This means that if delayed data is delivered to you, AgenaTrader will not be able to display charts.

**Differently displayed charts in AgenaTrader and the TWS**

We do not receive tick date through the current IB-API. As a result, some ticks may be assigned to the previous or the subsequent bar. This applies especially to computers with an incorrect system time. AgenaTrader attempts to solve this problem via [system time synchronization](https://docs.agenatrader.com/introduction/first-steps#time-synchronization-with-atomic-time-clock).

**Multi Accounts**

Multi accounts are not supported by AT. During connection user would get warning message in log: "Your account type: Multi Accounts is not supported. The connection is possible but we noticed minor problems."

#### **Can I connect to an additional data feed, when using IB as broker?** <a href="#can-i-connect-to-an-additional-data-feed-when-using-ib-as-broker" id="can-i-connect-to-an-additional-data-feed-when-using-ib-as-broker"></a>

You can use data provided by Interactive Brokers, yet there are some restrictions regarding the historical requests. Learn more about historical requests overflow as well as further relevant details in the section [Essential information about IB](https://agenatrader.com/wiki/tiki-index.php?page=Technology%20Provider:%20Interactive%20Brokers%20\(en\)\&structure=Trading%20Software%20AgenaTrader%20\(en\)).

Therefore AgenaTrader offers you the possibility to connect to an additional professional data feed (Taipan, Barchart, IQFeed). You will have to open an account with one of them.

In Main -> Connections you can add a new data feed account right away by clicking "Add New Account":

![](https://docs.agenatrader.com/~gitbook/image?url=https%3A%2F%2F2805764894-files.gitbook.io%2F%7E%2Ffiles%2Fv0%2Fb%2Fgitbook-legacy-files%2Fo%2Fassets%252F-MKZSsJBtSP9L4sqIe_q%252F-MPhn7zlMCA093nNUSJf%252F-MPiBPVcMDVowHBOQYZj%252FAddNewAccount.png%3Falt%3Dmedia%26token%3D2c41b334-3074-4e07-b5b7-d3b3bb2c0aa4\&width=768\&dpr=4\&quality=100\&sign=d821c5b5\&sv=1)

Choose your data feed provider, ascribe an account name (to simplify matters, we recommend to use the name of the datafeed provider as account name) and enter the credentials, you have received from your data feed provider, in the context menu.

**Please note!** It is crucial that you now define in account connection settings, which data you want to get from the data feed and which ones from IB. This is relevant, as IB Indices CFDs cannot be requested from an external data feed but only from IB directly.

#### **Example: Taipan as data feed provider** <a href="#example-taipan-as-data-feed-provider" id="example-taipan-as-data-feed-provider"></a>

In Account Connections -> "Connections"-tab, you now have to activate IB as broker and data feed, Taipan as datafeed only:

![](https://docs.agenatrader.com/~gitbook/image?url=https%3A%2F%2F2805764894-files.gitbook.io%2F%7E%2Ffiles%2Fv0%2Fb%2Fgitbook-legacy-files%2Fo%2Fassets%252F-MKZSsJBtSP9L4sqIe_q%252F-MPhn7zlMCA093nNUSJf%252F-MPiBPVeaX76uo_z9WgF%252FConnections.png%3Falt%3Dmedia%26token%3Dd7a3015d-8971-4af8-9fb4-f5ae64155552\&width=768\&dpr=4\&quality=100\&sign=72705c5f\&sv=1)

Now the instrument types have to be selected in "Datafeeds"-tab. Here it is important to not choose the same instrument types, as this would lead to an error message, once you connect AgenaTrader with IB and Taipan. Therefore please select CFDs only for IB and all those instrument types *exept* CFDs, you have subscribed for with Taipan:

![](https://docs.agenatrader.com/~gitbook/image?url=https%3A%2F%2F2805764894-files.gitbook.io%2F%7E%2Ffiles%2Fv0%2Fb%2Fgitbook-legacy-files%2Fo%2Fassets%252F-MKZSsJBtSP9L4sqIe_q%252F-MPhn7zlMCA093nNUSJf%252F-MPiBPVf-fEZ0YZlYuhf%252Fdata%2520feed.png%3Falt%3Dmedia%26token%3Df25e0c4f-6649-4367-a4b8-f445396ecb32\&width=768\&dpr=4\&quality=100\&sign=a145ef48\&sv=1)

### IB Futures Contract &#x20;

#### **Which settings do I have to consider when trading futures with IB?** <a href="#which-settings-do-i-have-to-consider-when-trading-futures-with-ib" id="which-settings-do-i-have-to-consider-when-trading-futures-with-ib"></a>

The IB API does not support Continuous Contracts. This means that AgenaTrader can only show one Contract e.g. FrontMonth. In order to compare the data in TWS with AgenaTrader please do not use Continuous Contracts.

Yet you can use an additinal data feed to display e.g. Continuous Contracts.

Therefore you need to

* either choose for IB "Broker" in Connections-tab of Account Connection Setup and "Datafeed" for your datafeed provider
* or you choose IB as data feed as well, yet in this case you need to choose different instrument types in "Datafeed"-tab for both IB and your datafeed provider: e.g. stocks and CFDs for IB but Futures, Currencies and Indices for your data feed provider.

In InstrumentEditor you need to select the wanted contract in the mappping settings of your data feed. Please note that the expiry is relevant for order transmission, while the contract settings in mapping settings of your data feed are to be considered for the display of the contracts:

<figure><img src="https://docs.agenatrader.com/~gitbook/image?url=https%3A%2F%2F2805764894-files.gitbook.io%2F%7E%2Ffiles%2Fv0%2Fb%2Fgitbook-legacy-files%2Fo%2Fassets%252F-MKZSsJBtSP9L4sqIe_q%252F-MPhn7zlMCA093nNUSJf%252F-MPiBPVhwuMfYmmEeqvr%252FKontrakte.png%3Falt%3Dmedia%26token%3D43115ced-20b5-46ce-9e55-bf497763c9d5&#x26;width=768&#x26;dpr=4&#x26;quality=100&#x26;sign=e08d1f03&#x26;sv=1" alt=""><figcaption></figcaption></figure>

#### Fees included in the price <a href="#fees-included-in-the-price" id="fees-included-in-the-price"></a>

Interactive Brokers includes fees in the price of an entry order, which is displayed on the chart as follows: entry price = order price + commission. Displayed within short time frames and small positions, this entry price may be confusing. However, AgenaTrader is unable to separate commissions from the order price, since we receive pre-assembled data via the API.

We plan to fix this problem by allowing traders to manually enter the exact numbers from your broker in the Profit & Loss, Commissions, and other columns. This functionality will be implemented in one of the upcoming AgenaTrader versions.

Please refer to your broker if you wish to know the exact sum of the profits, losses or commissions.

#### Profit & Loss: differences between AgenaTrader and TWS <a href="#profit-and-loss-differences-between-agenatrader-and-tws" id="profit-and-loss-differences-between-agenatrader-and-tws"></a>

AgenaTrader and TWS calculate PL in different ways. So results may be differ: Please see the [currency conversions](https://docs.agenatrader.com/main/chart-area/order-escort#Order_Escort__Account) section for more information.

<figure><img src="https://docs.agenatrader.com/~gitbook/image?url=https%3A%2F%2F2805764894-files.gitbook.io%2F%7E%2Ffiles%2Fv0%2Fb%2Fgitbook-legacy-files%2Fo%2Fassets%252F-MKZSsJBtSP9L4sqIe_q%252F-MPhn7zlMCA093nNUSJf%252F-MPiBPVdnv0F9LWTU9to%252FAgena-Fehler_Screenshot.png%3Falt%3Dmedia%26token%3Dcec4442e-0eda-4d4b-b035-a02159c8e8b9&#x26;width=768&#x26;dpr=4&#x26;quality=100&#x26;sign=c03317b9&#x26;sv=1" alt=""><figcaption></figcaption></figure>

If the user would have quotes in pennies or USD cents in AT it would be shown in GBP or USD (100x more).

Instruments with such quotes:

CT Cotton \
GF Feeder \
Cattle Futures \
HE Lean Hog Futures\
LE Live Cattle \
ZL Soybean Oil Futures \
ZO Oat Futures \
ZR Rough Rice Futures \
ZS Soybean Futures \
ZW Wheat Futures \
XK MINI SIZED SOYBEAN FUTURES \
CT.I Cotton No. 2 \
DPW\.L DP WORLD LIMITED ORD USD2 (DI) \
ZC Corn Futures

**Error messages from Interactive Brokers**

<figure><img src="https://docs.agenatrader.com/~gitbook/image?url=https%3A%2F%2F2805764894-files.gitbook.io%2F%7E%2Ffiles%2Fv0%2Fb%2Fgitbook-legacy-files%2Fo%2Fassets%252F-MKZSsJBtSP9L4sqIe_q%252F-MPhn7zlMCA093nNUSJf%252F-MPiBPVgbbyjcpKi5cO3%252FIB.png%3Falt%3Dmedia%26token%3D9f84720b-59a1-4037-8328-4da373d55f76&#x26;width=768&#x26;dpr=4&#x26;quality=100&#x26;sign=d82e0a1f&#x26;sv=1" alt=""><figcaption></figcaption></figure>

Please contact the IB support team to clarify. Note: *The error messages received from Interactive Brokers are not errors in the ordinary sense, but simply IB internal codes that serve informational purposes only.* You can find an interpretation of all Interactive Brokers codes [here](https://goo.gl/o8NjqC).

**110** - The price does not conform to the minimum price variation for this contract. AgenaTrader solution: adjust tick size to tick size set in TWS

**200** - No security definition has been found for the request. AgenaTrader solution: import of mappings or manually adding the correct mapping in Instrument Editor.

Order size exceeds leveraged FX-Position. AgenaTrader solution: decrease order size or increase account size

{% hint style="info" %}
**Importat!** If user trades instrument which can be executed on the different exchanges, he will get the specific message in log. For example, if user places order BMW\.FF (Frankfurt exchange)and this order is executed on BMW\.DE (Xetra exchange) user will get following message in log:

***"Your orders to BMW\.FF are resolved to primary exchange which is located on different instrument - BMW\.DE"***
{% endhint %}

**Adjusting the tick size for CFDs according to the current price**

Please note that Interactive Brokers uses different tick size parameters according to the particular price range. When trading some European CFDs, it may occur that users receive the following error messages: 1. "The price does not conform to the minimum price variation for the contract". 2. "Instrument Tick-Size is not zet calculated or delivered". In order to continue the trade it is necessary to adjust the tick size for the instrument manually.

Please enter a ticker name in the search field on [IB's website](https://www.interactivebrokers.com/en/?f=/en/general/contact/tipsContractsDatabaseSearch.php?ib_entity=llc) and check the price parameters for the selected instrument.

<figure><img src="https://docs.agenatrader.com/~gitbook/image?url=https%3A%2F%2F2805764894-files.gitbook.io%2F%7E%2Ffiles%2Fv0%2Fb%2Fgitbook-legacy-files%2Fo%2Fassets%252F-MKZSsJBtSP9L4sqIe_q%252F-MPhn7zlMCA093nNUSJf%252F-MPiBPVjAbfAO3Kz5Rox%252FZurn%2520IB.png%3Falt%3Dmedia%26token%3Daea3ef10-c4e7-4893-96ee-128eb8972100&#x26;width=768&#x26;dpr=4&#x26;quality=100&#x26;sign=89988892&#x26;sv=1" alt=""><figcaption></figcaption></figure>

Then enter the tick size in the **Instruments** window according the the current price, and check the checkbox **Pin Tick Size** as shown in the figure below:

<figure><img src="https://docs.agenatrader.com/~gitbook/image?url=https%3A%2F%2F2805764894-files.gitbook.io%2F%7E%2Ffiles%2Fv0%2Fb%2Fgitbook-legacy-files%2Fo%2Fassets%252F-MKZSsJBtSP9L4sqIe_q%252F-MPhn7zlMCA093nNUSJf%252F-MPiBPVkvzOOlveb75J2%252FZurn%2520IB_instrument.png%3Falt%3Dmedia%26token%3Df4f6cb6a-4f84-4514-94ff-0e9d63e43c69&#x26;width=768&#x26;dpr=4&#x26;quality=100&#x26;sign=3548776a&#x26;sv=1" alt=""><figcaption></figcaption></figure>

**Gateway**

Please find a connection-guide for IB-Gateway [HERE](https://docs.agenatrader.com/main/broker-and-datafeed-connections/technology-provider#how-to-use-ib-gateway-and-fa-accounts)

**Financial adviser account from Intercative Brokers**

Please find a connection-guide for IB-FA Accounts [HERE](https://docs.agenatrader.com/main/broker-and-datafeed-connections/technology-provider#IB_Financial_Advisor_Accounts)

### Assigning instruments and orders with Interactive Brokers <a href="#assigning_instruments_and_orders_with_interactive_brokers" id="assigning_instruments_and_orders_with_interactive_brokers"></a>

**"Resolve position instrument" popup or "Resolve instruments for orders" popup**

From time to time it may occur that an order with Interactive Brokers cannot be assigned to the appropriate AgenaTrader instrument. The reason for this is that Interactive Brokers uses the same symbol name for different instruments. For example, the stock with the Interactive Brokers symbol „AAPL“ is listed on the NASDAQ as well as on the XETRA exchange. AgenaTrader uses the name "AAPL" for the NASDAQ instrument and the name "AAPL.DE" for the XETRA instrument.

Depending upon which exchange you are trading with, it may become necessary to manually assign an order to the correct AgenaTrader instrument. Although AgenaTrader has integrated a process that assures that symbols are correctly accounted for, it does not work if an order is entered directly in the TWS.

Should this happen, the "Resolve position instrument" popup will appear, instructing you to assign the correct instrument in AgenaTrader for the Interactive Brokers order.

Using the example of the AAPL stock:

* shares traded with NASDAQ are assigned to the AgenaTrader instrument "AAPL", and
* shares traded with XETRA are assigned to the AgenaTrader instrument "APC.DE".

<figure><img src="https://docs.agenatrader.com/~gitbook/image?url=https%3A%2F%2F2805764894-files.gitbook.io%2F%7E%2Ffiles%2Fv0%2Fb%2Fgitbook-legacy-files%2Fo%2Fassets%252F-MKZSsJBtSP9L4sqIe_q%252F-MPhn7zlMCA093nNUSJf%252F-MPiBPViXI7494e7SuUn%252FResolveInstrument1.png%3Falt%3Dmedia%26token%3Dd81f621d-9d27-482e-9374-06189b74b38b&#x26;width=768&#x26;dpr=4&#x26;quality=100&#x26;sign=ccdca5b4&#x26;sv=1" alt=""><figcaption></figcaption></figure>

**Symbol entry in the TWS (example: AAPL)**

![](https://docs.agenatrader.com/~gitbook/image?url=https%3A%2F%2F2805764894-files.gitbook.io%2F%7E%2Ffiles%2Fv0%2Fb%2Fgitbook-legacy-files%2Fo%2Fassets%252F-MKZSsJBtSP9L4sqIe_q%252F-MPhn7zlMCA093nNUSJf%252F-MPiBPVb0cN5zvIfXlwC%252FAAPL_TWS.png%3Falt%3Dmedia%26token%3Dd7d188dc-b52c-4788-b045-40f3a8560cb5\&width=768\&dpr=4\&quality=100\&sign=27986971\&sv=1)![](https://docs.agenatrader.com/~gitbook/image?url=https%3A%2F%2F2805764894-files.gitbook.io%2F%7E%2Ffiles%2Fv0%2Fb%2Fgitbook-legacy-files%2Fo%2Fassets%252F-MKZSsJBtSP9L4sqIe_q%252F-MPhn7zlMCA093nNUSJf%252F-MPiBPVlFIUGrwN9v1zO%252Fresolve.jpg%3Falt%3Dmedia%26token%3Dd81899d8-d35c-43d8-9986-7a201020580a\&width=768\&dpr=4\&quality=100\&sign=e4933b7c\&sv=1)

AgenaTrader is able to auto-resolve the instrument selection by either applying the most popular or the recently selected instrument. In order to enable auto-resolving, please select for how long AgenaTrader is supposed to wait for your reaction until automatically resolving your positions:

Auto resolve

<figure><img src="https://docs.agenatrader.com/~gitbook/image?url=https%3A%2F%2F2805764894-files.gitbook.io%2F%7E%2Ffiles%2Fv0%2Fb%2Fgitbook-x-prod.appspot.com%2Fo%2Fspaces%252F-MKZSsJBtSP9L4sqIe_q-887967055%252Fuploads%252FWA24yrCZNS7ONH5nCzY1%252Fimage.png%3Falt%3Dmedia%26token%3D44cd9448-daaa-461e-a98c-2130c1d778c1&#x26;width=768&#x26;dpr=4&#x26;quality=100&#x26;sign=75bd8dc7&#x26;sv=1" alt=""><figcaption></figcaption></figure>

Example:

* 0 seconds means that AgenaTrader will never auto-resolve your positions
* 5 seconds means that if you leave the window untouched for 5 seconds, AgenaTrader will auto-resolve

This setting is useful if you are not sitting in front of your PC during the scheduled reconnect.

### **AgenaTrader++ (plusplus) Resolve Setup**

This is one of the essential tools in AT++.

**AgenaTrader++ (plusplus) resolve setup works in the following manner:**

* If you have submitted and confirmed orders, AgenaTrader++ strategies will continue to run even when the trading platform is closed.
* These strategies will be saved within the system.
* When you start AgenaTrader up again, the strategies will be adjusted to the current market conditions.

If you plan to keep an intraday trade with the AT++ setup overnight, we recommend that you do not turn off AgenaTrader since this can lead to unexpected order behavior. For example, order groups managed by AgenaTrader, such as IfDone and OCO, are often not linked to your broker due to the fact that the majority of brokers do not support these special types of orders. Only having AT opened ensures that all setups and functionalities will remain unchangeable.

If something happens during the time in which AgenaTrader is closed (e.g. filled or cancelled orders, closed trades etc.), stops will be recalculated and positions/setups will be adjusted etc. Obviously, this can be dangerous.

Should this occur, you will receive a recovery popup (see image below) displaying the trades which require your intervention and supervision:

*Functions of the buttons in the recovery popup:*

* The **Entry Escort** button allows you to enter the strategy. **NOTE:** the **Trades tab** will display the entry reason.
* The button **Session** allows user to select **analyzer** session
* The **Confirm** button applies the suggested actions.
* Chart area provides you access to all chart function. Details on section [**Chart Toolbar**](https://docs.agenatrader.com/main/chart-area/untitled)

If you close the popup without confirmation, you will have to clear the trades manually.

{% hint style="info" %}
**Important!**

For some Symbols TWS don't allow to place limit order outside trading hours
{% endhint %}

<figure><img src="https://docs.agenatrader.com/~gitbook/image?url=https%3A%2F%2F2805764894-files.gitbook.io%2F%7E%2Ffiles%2Fv0%2Fb%2Fgitbook-legacy-files%2Fo%2Fassets%252F-MKZSsJBtSP9L4sqIe_q%252F-MPiOGSO-px1RIsFlvRa%252F-MPiOrSPbQQxzII1Pi8X%252F2-6-2017%252012-15-58%2520PM.png%3Falt%3Dmedia%26token%3D377ad966-4db5-4df3-b531-4aebdd9c5e98&#x26;width=768&#x26;dpr=4&#x26;quality=100&#x26;sign=9a66af6b&#x26;sv=1" alt=""><figcaption></figcaption></figure>

{% hint style="info" %}

#### Important Note <a href="#important_note" id="important_note"></a>

THE BROKER'S PLATFORM ALWAYS REPRESENTS THE REFERENCE PLATFORM.

This means that the orders and market-related values shown on the BROKER platform are valid. The broker's platform should always be active as a backup to AgenaTrader. This gives you an essential overview of the interaction between AgenaTrader and your broker. Furthermore, you will always know exactly how your orders/positions and ultimately your account balance are displayed.
{% endhint %}

### Historical requests overflow at IB <a href="#historical-requests-overflow-at-ib" id="historical-requests-overflow-at-ib"></a>

It can happen that AgenaTrader issues a warning via a popup:

![](https://docs.agenatrader.com/~gitbook/image?url=https%3A%2F%2Fagenatrader.com%2Fwiki%2Ftiki-download_file.php%3FfileId%3D2034%26display%26max%3D1000\&width=768\&dpr=4\&quality=100\&sign=5c3c3fee\&sv=1)

Or that charts are depicted partially incorrectly and contain erroneous data.&#x20;

As a result histories are missing and charts do not tick.

**What does this mean?**

You should take care that you have a much smaller number of requests pending at a time.

**Pacing Violations for Small Bars (30 secs or less)** A Pacing Violation occurs whenever you do not observe one or more of the following restriction: -> Making identical historical data requests within 15 seconds. -> Making six or more historical data requests for the same Contract, Exchange and Tick Type within two seconds. -> Making more than 60 requests within any ten minute period.

However, be careful when requesting large amounts of historical data or sending historical data requests as "soft limit' is still implemented. If you request too much of historical data you will get disconnected from API client. You can find further information about the pacing violations for small bars in [this IB article](https://interactivebrokers.github.io/tws-api/historical_limitations.html).

{% hint style="info" %}
Please note:

1 instrument in 3 timeframes = 3 histories 1&#x20;

Analyzer Column column = 1 history&#x20;

Watch lists, backtest lists, indicators and alerts also require histories.
{% endhint %}

**Possible solutions**

Reduce your instruments and historical requests with the Interactive Brokers server. In doing so, pay attention to the green connection bar at the bottom left of your AgenaTrader:

![](https://docs.agenatrader.com/~gitbook/image?url=https%3A%2F%2Fagenatrader.com%2Fwiki%2Ftiki-download_file.php%3FfileId%3D2035%26display%26max%3D1000\&width=768\&dpr=4\&quality=100\&sign=422c76b9\&sv=1)

After the initial connection, further histories can be requested every 10 minutes. However, please note: reloading data would then lead to a renewed histories overflow once again.

Alternatively, an external data feed - in most cases, however, this is subject to a charge - is also recommended.

This takes you to the [data feed overview](https://agenatrader.com/datafeeds/).

This also applies to CapTrader, Banx, Lynx and other brokers that connect to the API interfaces of the TWS.

### FAQ

#### **Can I connect to an additional data feed, when using IB as broker?**&#x20;

You can use data provided by Interactive Brokers, yet there are some restrictions regarding the historical requests. Learn more about historical requests overflow as well as further relevant details  in the section Tipps and Tricks about IB.

Therefore AgenaTrader offers you the possibility to connect to an additional professional data feed (Taipan, Barchart, IQFeed). You will have to open an account with one of them.

In Main -> Connections you can add a new data feed account right away by clicking "Add New Account":&#x20;

<figure><img src="/files/wVXEYtz9x7IYHkUJelkq" alt=""><figcaption></figcaption></figure>

Choose your data feed provider, ascribe an account name (to simplify matters, we recommend to use the name of the datafeed provider as account name) and enter the credentials, you have received from your data feed provider, in the context menu.

**Please note!** It is crucial that you now define in account connection settings, which data you want to get from the data feed and which ones from IB. This is relevant, as IB Indices CFDs cannot be requested from an external data feed but only from IB directly.

#### **Example: Taipan as data feed provider**

In Account Connections -> "Connections"-tab, you now have to activate IB as broker and data feed, Taipan as datafeed only:

<figure><img src="/files/H0TDH67bP1NBs4b7KgXe" alt=""><figcaption></figcaption></figure>

Now the instrument types have to be selected in "Datafeeds"-tab. Here it is important to not choose the same instrument types, as this would lead to an error message, once you connect AgenaTrader with IB and Taipan. Therefore please select CFDs only for IB and all those instrument types *exept* CFDs, you have subscribed for with Taipan:

<figure><img src="/files/4GxzIRsiD4LEuojNwGqY" alt=""><figcaption></figcaption></figure>

#### **Which settings do I have to consider when trading futures with IB?**

The IB API does not support Continuous Contracts. This means that AgenaTrader can only show one Contract e.g. FrontMonth. \
In order to compare the data in TWS with AgenaTrader please do not use Continuous Contracts.

Yet you can use an additinal data feed to display e.g. Continuous Contracts.

Therefore you need to

* either choose for IB "Broker" in Connections-tab of Account Connection Setup and "Datafeed" for your datafeed provider
* or you choose IB as data feed as well, yet in this case you need to choose different instrument types in "Datafeed"-tab for both IB and your datafeed provider: e.g. stocks and CFDs for IB but Futures, Currencies and Indices for your data feed provider.

In InstrumentEditor you need to select the wanted contract in the mappping settings of your data feed. Please note that the expiry is relevant for order transmission, while the contract settings in mapping settings of your data feed are to be considered for the display of the contracts:

<figure><img src="/files/oHBxN9vSOuvHhSzXdURE" alt=""><figcaption></figcaption></figure>

#### Fees included in the price

Interactive Brokers includes fees in the price of an entry order, which is displayed on the chart as follows: entry price = order price + commission.\
Displayed within short time frames and small positions, this entry price may be confusing.\
However, AgenaTrader is unable to separate commissions from the order price, since we receive pre-assembled data via the API.

We plan to fix this problem by allowing traders to manually enter the exact numbers from your broker in the Profit & Loss, Commissions, and other columns.\
This functionality will be implemented in one of the upcoming AgenaTrader versions.

Please refer to your broker if you wish to know the exact sum of the profits, losses or commissions.

#### Profit & Loss: differences between AgenaTrader and TWS

AgenaTrader and TWS calculate PL in different ways. So results may be differ:    \
Please see the [currency conversions](broken://pages/-MPKESH6EYWOfOxLzced#Order_Escort__Account) section for more information.

<figure><img src="/files/vlxAwT9k54opHlQbD1Ao" alt=""><figcaption></figcaption></figure>

If the user would have quotes in pennies or USD cents in AT it would be shown in GBP or USD (100x more).

Instruments with such quotes:

CT Cotton\
GF Feeder Cattle Futures\
HE Lean Hog Futures\
LE Live Cattle\
ZL Soybean Oil Futures\
ZO Oat Futures\
ZR Rough Rice Futures\
ZS Soybean Futures\
ZW Wheat Futures\
XK MINI SIZED SOYBEAN FUTURES\
CT.I Cotton No. 2\
DPW\.L DP WORLD LIMITED ORD USD2 (DI)\
ZC Corn Futures

#### Error messages from Interactive Brokers <a href="#error_messages_from_interactive_brokers" id="error_messages_from_interactive_brokers"></a>

<figure><img src="/files/WrYfbvaI1EiNBm9xQFND" alt=""><figcaption></figcaption></figure>

Please contact the IB support team to clarify.\
Note: *The error messages received from Interactive Brokers are not errors in the ordinary sense, but simply IB internal codes that serve informational purposes only.* You can find an interpretation of all Interactive Brokers codes [here](https://goo.gl/o8NjqC).&#x20;

**110** - The price does not conform to the minimum price variation for this contract.\
AgenaTrader solution: adjust tick size to tick size set in TWS

**200** - No security definition has been found for the request. \
AgenaTrader solution: import of mappings or manually adding the correct mapping in Instrument Editor.

Order size exceeds leveraged FX-Position.\
AgenaTrader solution: decrease order size or increase account size&#x20;

#### Adjusting the tick size for CFDs according to the current price <a href="#adjusting_the_tick_size_for_cfds_according_to_the_current_price__" id="adjusting_the_tick_size_for_cfds_according_to_the_current_price__"></a>

Please note that Interactive Brokers uses different tick size parameters according to the particular price range. When trading some European CFDs, it may occur that users receive the following error messages:\
1\. "The price does not conform to the minimum price variation for the contract".\
2\. "Instrument Tick-Size is not zet calculated or delivered".\
In order to continue the trade it is necessary to adjust the tick size for the instrument manually.

Please enter a ticker name in the search field on [IB's website](https://www.interactivebrokers.com/en/?f=/en/general/contact/tipsContractsDatabaseSearch.php?ib_entity=llc) and check the price parameters for the selected instrument.&#x20;

<figure><img src="/files/FxROECvskxun8RAxaA09" alt=""><figcaption></figcaption></figure>

Then enter the tick size in the **Instruments** window according the the current price, and check the checkbox **Pin Tick Size** as shown in the figure below:

<figure><img src="/files/N9Mo6s1Bwreq9ageK31M" alt=""><figcaption></figcaption></figure>

#### Gateway <a href="#gateway" id="gateway"></a>

Please find a connection-guide for IB-Gateway [HERE](broken://pages/-MPF1pee1eUOz6jl4pWW#how-to-use-ib-gateway-and-fa-accounts)

#### Financial adviser account from Intercative Brokers <a href="#financial_adviser_account_from_intercative_brokers" id="financial_adviser_account_from_intercative_brokers"></a>

Please find a connection-guide for IB-FA Accounts [HERE](broken://pages/-MPF1pee1eUOz6jl4pWW#IB_Financial_Advisor_Accounts)

## Rithmic <a href="#technology_provider__rithmic__en" id="technology_provider__rithmic__en"></a>

### About Rithmic <a href="#about-rithmic" id="about-rithmic"></a>

Rithmic puts your trades first. Whether you are part of a prop shop or are a professional trader, Rithmic’s trade execution software delivers to you the low latency and high throughput performance formerly seen only by the very large trading houses and boutique hedge funds.

**Supported asset classes:** Future, Stock

**Supported orders:** \
OCO order connections are supported by this broker \
ORO order connections are locally simulated \
IFDone order connections are locally simulated

**Order execution** \
AgenaTrader does not execute any orders! Instead, brokers simply inform us of filled orders and execution price. If data received from your data feed provider does not match the quotes on the brokerage platform for an instrument, then the entry and exit price will not be displayed properly on your chart.

Follow this link [**here**](https://agenatrader.com/broker/rithmic/) to our webpage.

### Connection <a href="#connection-1" id="connection-1"></a>

Please follow the instructions in the following video to establish the connection correctly:

{% embed url="<https://www.youtube.com/watch?v=izKx46qbU-Q>" %}

#### Essential information <a href="#essential-information" id="essential-information"></a>

If you have some OCO order-connections while trading with Rithmic, the automatic cancellation of one order due to the OCO connection can lead to the following PopUp: "You cannot cancel a cancelled order". This happens when AgenaTrader sends the cancellation after Rithmic already cancelled this order, so you can just ignore this Message - your order has already been cancelled.

Up on each day, Rithmic is doing the settlement on their positions. Here you can see example of position on 6B, where long entry is made on 21th October. Up on each evening (22:25) Rithmic is closing old position with settlement price and opening new position, with settlement price as new position price. This would lead to the difference in R Trader and AT in two main areas: -Position Price -Open PnL

<figure><img src="https://docs.agenatrader.com/~gitbook/image?url=https%3A%2F%2F2805764894-files.gitbook.io%2F%7E%2Ffiles%2Fv0%2Fb%2Fgitbook-legacy-files%2Fo%2Fassets%252F-MKZSsJBtSP9L4sqIe_q%252F-MPiOGSO-px1RIsFlvRa%252F-MPiP7NLMOB-UaVSBvKt%252FRithmic.png%3Falt%3Dmedia%26token%3D1cafc52a-e110-4e81-a064-0de05be9c90b&#x26;width=768&#x26;dpr=4&#x26;quality=100&#x26;sign=c4f2d489&#x26;sv=1" alt=""><figcaption></figcaption></figure>

{% hint style="info" %}
**Important!** Rithmic does not provide commission automatically however you can set it manually by adding this info in the InstrumentEditor in the Mapping Area with the "C" Button. Details: [Instrument Editor: Creating and editing instruments](https://agenatrader.com/wiki/tiki-index.php?page=Instrument+Escort%3A+Creating+and+editing+instruments).
{% endhint %}

<figure><img src="https://docs.agenatrader.com/~gitbook/image?url=https%3A%2F%2F2805764894-files.gitbook.io%2F%7E%2Ffiles%2Fv0%2Fb%2Fgitbook-legacy-files%2Fo%2Fassets%252F-MKZSsJBtSP9L4sqIe_q%252F-MPiOGSO-px1RIsFlvRa%252F-MPiP7NMJJFQADAazQAR%252FRithmic_commision.png%3Falt%3Dmedia%26token%3D72cd6eff-2b96-4593-83e5-929a571dc1eb&#x26;width=768&#x26;dpr=4&#x26;quality=100&#x26;sign=c6bc887d&#x26;sv=1" alt=""><figcaption></figcaption></figure>

In order to establish the right connection please ask your broker which "system type or server" your account must be connected with. A wrong system type (server) can lead to problems like "missing account details" or others.

<figure><img src="https://docs.agenatrader.com/~gitbook/image?url=https%3A%2F%2F2805764894-files.gitbook.io%2F%7E%2Ffiles%2Fv0%2Fb%2Fgitbook-legacy-files%2Fo%2Fassets%252F-MKZSsJBtSP9L4sqIe_q%252F-MPiOGSO-px1RIsFlvRa%252F-MPiP7NNaOzvq91_RFDO%252Fsystem-type-rithmic.png%3Falt%3Dmedia%26token%3D61bec8c3-632e-4bf6-bfa1-b3bb0a81b04d&#x26;width=768&#x26;dpr=4&#x26;quality=100&#x26;sign=dd957e18&#x26;sv=1" alt=""><figcaption></figcaption></figure>

### Essential information

{% hint style="info" %}
**Important!**&#x20;

Rithmic doesn't provide Ask Bid data for the previous day, so you may load OrderSteam only for present day. In another case you will get a message in the log: *"Requested time (24 hours) of AskBid history is not available, please reduce amount of hours for OrderStream"*
{% endhint %}

{% hint style="info" %}

#### Important Note <a href="#important_note-1" id="important_note-1"></a>

THE BROKER'S PLATFORM ALWAYS REPRESENTS THE REFERENCE PLATFORM.

This means that the orders and market-related values shown on the BROKER platform are valid. The broker's platform should always be active as a backup to AgenaTrader. This gives you an essential overview of the interaction between AgenaTrader and your broker. Furthermore, you will always know exactly how your orders/positions and ultimately your account balance are displayed.

Please note: **R Trader Pro** is required.
{% endhint %}

## MetaTrader 5 Connector <a href="#broker__metatrader_5_connector" id="broker__metatrader_5_connector"></a>

### About MetaTrader 5 <a href="#about_the_metatrader_5_connector" id="about_the_metatrader_5_connector"></a>

MetaTrader 5 is a powerful and widely used trading platform that supports trading across various asset classes, including **Forex and Futures**. With its advanced features and flexibility, you have access to a range of trading tools designed to help you execute your strategies with precision.

{% hint style="info" %}
MT5 Connector supports only **Non-Hedged** accounts. Before you start please clarify with your broker, if your broker account is assigned to a non-hedged account group
{% endhint %}

{% hint style="info" %}
Please note that **all MT5 charts** will be running in the **timezone of the MT5 server**, which is not always the same as the timezone of your AgenaTrader or your PC. This behavior is expected and results from the fact that AgenaTrader has to exactly mirror the charting behavior in MetaTrader 5
{% endhint %}

{% hint style="info" %}
The maximum number of real time charts in MT5 is 100.

However, please keep in mind that this number does not exactly mean that you are allowed to load 100 MT5 instruments in your AgenaTrader. The number can be lower in the following cases:

* Multiple charts running in different time frames for the same instrument
* Some charts have been opened manually in MetaTrader 5 and are running without the MtApi5 expert indication
* Running MtApi5 expert charts for which AgenaTrader has not been subscribed to (leftovers from other connections)
  {% endhint %}

<figure><img src="https://docs.agenatrader.com/~gitbook/image?url=https%3A%2F%2F2805764894-files.gitbook.io%2F%7E%2Ffiles%2Fv0%2Fb%2Fgitbook-legacy-files%2Fo%2Fassets%252F-MKZSsJBtSP9L4sqIe_q%252F-MPiSv8m6HiRuT_J32LT%252F-MPiVp2qrMmTXdhcKcC5%252F12.png%3Falt%3Dmedia%26token%3D85bb8c5a-9a9c-4cc5-8e75-90bc90fb5f4e&#x26;width=768&#x26;dpr=4&#x26;quality=100&#x26;sign=a63f0676&#x26;sv=2" alt=""><figcaption><p>RealTime-Request Overflow</p></figcaption></figure>

### Order Connections <a href="#order-connections" id="order-connections"></a>

**MetaTrader 5 does not support order connections** within AgenaTrader. While you can execute orders through MetaTrader 5, the platform does not provide automated management for connected orders such as **OCO (One Cancels the Other), IfDone, or ORO (One Reduces the Other).**

#### **What This Means for You**

Since MetaTrader 5 lacks built-in order connection support, **AgenaTrader must remain running** at all times to manage your automated trading strategies and ensure proper execution of linked stop and target orders. If AgenaTrader is not active, these automated features will not function as expected, and you may need to manually monitor your trades.

### Connection settings in AgenaTrader <a href="#connection_settings_in_agenatrader" id="connection_settings_in_agenatrader"></a>

In order to start the connection process, please download and install MetaTrader 5. The installer can be downloaded from the homepage of your broker.

* Please go to **Account Connection** and click on **Add**

<figure><img src="https://docs.agenatrader.com/~gitbook/image?url=https%3A%2F%2F2805764894-files.gitbook.io%2F%7E%2Ffiles%2Fv0%2Fb%2Fgitbook-legacy-files%2Fo%2Fassets%252F-MKZSsJBtSP9L4sqIe_q%252F-MPiSv8m6HiRuT_J32LT%252F-MPiVp2pcu0EVnIbFu6L%252F5.png%3Falt%3Dmedia%26token%3Dd778d308-171e-4062-a8ca-d8733f207f1b&#x26;width=768&#x26;dpr=4&#x26;quality=100&#x26;sign=4a73d963&#x26;sv=2" alt=""><figcaption></figcaption></figure>

* Select **MetaTrader5 Connector** as a Provider and enter your desired Connection name

<figure><img src="https://docs.agenatrader.com/~gitbook/image?url=https%3A%2F%2F2805764894-files.gitbook.io%2F%7E%2Ffiles%2Fv0%2Fb%2Fgitbook-legacy-files%2Fo%2Fassets%252F-MKZSsJBtSP9L4sqIe_q%252F-MPiSv8m6HiRuT_J32LT%252F-MPiVp2rWbgtR1zTTnZt%252FMetaTrader5%2520Connector.png%3Falt%3Dmedia%26token%3Dbb7c2e79-99ba-4bc8-a092-94eed66dac18&#x26;width=768&#x26;dpr=4&#x26;quality=100&#x26;sign=1de99304&#x26;sv=2" alt=""><figcaption></figcaption></figure>

* After pressing Next, please enter the installation location of your MetaTrader 5.

<figure><img src="https://docs.agenatrader.com/~gitbook/image?url=https%3A%2F%2F2805764894-files.gitbook.io%2F%7E%2Ffiles%2Fv0%2Fb%2Fgitbook-legacy-files%2Fo%2Fassets%252F-MKZSsJBtSP9L4sqIe_q%252F-MPiSv8m6HiRuT_J32LT%252F-MPiVp2wRJK_jRlj15PY%252FMt5%2520Location.png%3Falt%3Dmedia%26token%3D5bcca8f2-424a-463a-9625-adf4b3a43079&#x26;width=768&#x26;dpr=4&#x26;quality=100&#x26;sign=2d80a3e5&#x26;sv=2" alt=""><figcaption></figcaption></figure>

* In the MT5 DataFolder field please select your MT5 Data Folder location path.

<figure><img src="https://docs.agenatrader.com/~gitbook/image?url=https%3A%2F%2F2805764894-files.gitbook.io%2F%7E%2Ffiles%2Fv0%2Fb%2Fgitbook-legacy-files%2Fo%2Fassets%252F-MKZSsJBtSP9L4sqIe_q%252F-MPiSv8m6HiRuT_J32LT%252F-MPiVp2vB6x1Asy-II24%252FMt5%2520Data%2520Location.png%3Falt%3Dmedia%26token%3D31f1f04d-d9ad-456e-8dee-c49b610cc911&#x26;width=768&#x26;dpr=4&#x26;quality=100&#x26;sign=8563209b&#x26;sv=2" alt=""><figcaption></figcaption></figure>

*There are two ways of finding the MT5 DataFolder location:*

* Open MetaTrader 5 and press: Ctrl+Shift+D
* Open MetaTrader 5 and go to -> File -> Open Data Folder

<figure><img src="https://docs.agenatrader.com/~gitbook/image?url=https%3A%2F%2F2805764894-files.gitbook.io%2F%7E%2Ffiles%2Fv0%2Fb%2Fgitbook-legacy-files%2Fo%2Fassets%252F-MKZSsJBtSP9L4sqIe_q%252F-MPiSv8m6HiRuT_J32LT%252F-MPiVp2oISa5BXV7QezL%252F3.png%3Falt%3Dmedia%26token%3D91fe7e6a-ed68-42ad-8e88-3981190b28b8&#x26;width=768&#x26;dpr=4&#x26;quality=100&#x26;sign=794557fd&#x26;sv=2" alt=""><figcaption></figcaption></figure>

By default, the MetaTrader 5 data directory is located at **C:\Users\UserName\AppData\Roaming\MetaQuotes\Terminal\DataFolder name**

* In case you would like to run the MT5 terminal, please activate the checkbox **Run MT5 Terminal on connect**. By activating the checkbox **Close MT5 Terminal on disconnect** you allow AgenaTrader to automatically close the terminal.

<figure><img src="https://docs.agenatrader.com/~gitbook/image?url=https%3A%2F%2F2805764894-files.gitbook.io%2F%7E%2Ffiles%2Fv0%2Fb%2Fgitbook-legacy-files%2Fo%2Fassets%252F-MKZSsJBtSP9L4sqIe_q%252F-MPiSv8m6HiRuT_J32LT%252F-MPiVp2sBeSMbsmXQyB8%252FMetaTrader5%2520Connector2.png%3Falt%3Dmedia%26token%3D554147d2-6bef-4fe9-9407-608c0330e5a2&#x26;width=768&#x26;dpr=4&#x26;quality=100&#x26;sign=dfa1bee9&#x26;sv=2" alt=""><figcaption></figcaption></figure>

1.Select your **Trade Server**

You can connect to any trading server, just type your Server name into the Trade Server field. Please note that the Trade Server name is key sensitive and must be exactly the same as the server name in the MT5 platform.

2.Enter the MT5 Account- **Login** for your trade server 3.Enter the MT5 Account- **Password** for your trade server

<figure><img src="https://docs.agenatrader.com/~gitbook/image?url=https%3A%2F%2F2805764894-files.gitbook.io%2F%7E%2Ffiles%2Fv0%2Fb%2Fgitbook-legacy-files%2Fo%2Fassets%252F-MKZSsJBtSP9L4sqIe_q%252F-MPiSv8m6HiRuT_J32LT%252F-MPiVp2tcXacFDyQTYuv%252FMetaTrader5%2520Connector3.png%3Falt%3Dmedia%26token%3Dfc9614d5-a4a5-4d8e-8016-d6f74edc536a&#x26;width=768&#x26;dpr=4&#x26;quality=100&#x26;sign=3d7c09b1&#x26;sv=2" alt=""><figcaption></figcaption></figure>

If your MT5 is running on a server or a virtual machine, leave the checkbox **Run MT5 Terminal on connect** disabled and enter **Host**, **Expert Port** and **Server Port** instead of Trade Server, Login and Password.

<figure><img src="https://docs.agenatrader.com/~gitbook/image?url=https%3A%2F%2F2805764894-files.gitbook.io%2F%7E%2Ffiles%2Fv0%2Fb%2Fgitbook-legacy-files%2Fo%2Fassets%252F-MKZSsJBtSP9L4sqIe_q%252F-MPiSv8m6HiRuT_J32LT%252F-MPiVp2uLgAcYMb2CGtK%252FMetaTrader5%2520Connector4.png%3Falt%3Dmedia%26token%3Dd5b9416c-d882-4a96-b865-34d4e0d2ccf0&#x26;width=768&#x26;dpr=4&#x26;quality=100&#x26;sign=d5402f64&#x26;sv=2" alt=""><figcaption></figcaption></figure>

Click on **Next**.

* In the next dialog please select your **MetaTrader5 Connector-Broker** and click on **Finish**

<figure><img src="https://docs.agenatrader.com/~gitbook/image?url=https%3A%2F%2F2805764894-files.gitbook.io%2F%7E%2Ffiles%2Fv0%2Fb%2Fgitbook-legacy-files%2Fo%2Fassets%252F-MKZSsJBtSP9L4sqIe_q%252F-MPiSv8m6HiRuT_J32LT%252F-MPiVp2xTm3Kn5ptY9IO%252FMetaTrader5%2520Connector5.png%3Falt%3Dmedia%26token%3Ddfe71d37-4d1d-4be6-a9bb-c8ce298c4c1d&#x26;width=768&#x26;dpr=4&#x26;quality=100&#x26;sign=8558443&#x26;sv=2" alt=""><figcaption></figcaption></figure>

#### MTApi5 installation <a href="#mtapi5_installation" id="mtapi5_installation"></a>

After finishing the MT5 connection setup in AgenaTrader, the **MTAPI5** needs to be installed. This API is required for allowing 3rd party trading applications like AgenaTrader to communicate with MetaTrader 5.

The installation starts automatically right after the first connection attempt to the MT5 Connector in AgenaTrader:

* The Setup Wizard will start. Please click on **Next**

<figure><img src="https://docs.agenatrader.com/~gitbook/image?url=https%3A%2F%2F2805764894-files.gitbook.io%2F%7E%2Ffiles%2Fv0%2Fb%2Fgitbook-legacy-files%2Fo%2Fassets%252F-MKZSsJBtSP9L4sqIe_q%252F-MPiXWv2a6VS9BPuIG4o%252F-MPiXwFNOSvzsWt07HsE%252FAPi1.png%3Falt%3Dmedia%26token%3D3064ef87-ceb6-4f5c-a786-a2349b9c73c5&#x26;width=768&#x26;dpr=4&#x26;quality=100&#x26;sign=c0a50875&#x26;sv=2" alt=""><figcaption></figcaption></figure>

* Activate the checkbox **I accept the terms in the License Agreement** and click **Next**

<figure><img src="https://docs.agenatrader.com/~gitbook/image?url=https%3A%2F%2F2805764894-files.gitbook.io%2F%7E%2Ffiles%2Fv0%2Fb%2Fgitbook-legacy-files%2Fo%2Fassets%252F-MKZSsJBtSP9L4sqIe_q%252F-MPiXWv2a6VS9BPuIG4o%252F-MPiXwFOfI1-bqhxo8Tu%252FAPi2.png%3Falt%3Dmedia%26token%3Dec16d219-2a51-4f6f-b36b-b51836e72aae&#x26;width=768&#x26;dpr=4&#x26;quality=100&#x26;sign=b2990db9&#x26;sv=2" alt=""><figcaption></figcaption></figure>

* Select the **Typical** setup

<figure><img src="https://docs.agenatrader.com/~gitbook/image?url=https%3A%2F%2F2805764894-files.gitbook.io%2F%7E%2Ffiles%2Fv0%2Fb%2Fgitbook-legacy-files%2Fo%2Fassets%252F-MKZSsJBtSP9L4sqIe_q%252F-MPiXWv2a6VS9BPuIG4o%252F-MPiXwFPyYX3VrHTxZeS%252FAPi3.png%3Falt%3Dmedia%26token%3D15cb264d-160e-48f5-9454-da41154fd079&#x26;width=768&#x26;dpr=4&#x26;quality=100&#x26;sign=6b35b5ef&#x26;sv=2" alt=""><figcaption></figcaption></figure>

* Click on **Install** (admin rights required)

<figure><img src="https://docs.agenatrader.com/~gitbook/image?url=https%3A%2F%2F2805764894-files.gitbook.io%2F%7E%2Ffiles%2Fv0%2Fb%2Fgitbook-legacy-files%2Fo%2Fassets%252F-MKZSsJBtSP9L4sqIe_q%252F-MPiXWv2a6VS9BPuIG4o%252F-MPiXwFQVbYITUd0-RhT%252FAPi4.png%3Falt%3Dmedia%26token%3D6c1cefc4-87a7-4b8e-b55b-74790d1c57d3&#x26;width=768&#x26;dpr=4&#x26;quality=100&#x26;sign=4580fc8f&#x26;sv=2" alt=""><figcaption></figcaption></figure>

* In order to complete the installation process please click on **Finish**.

<figure><img src="https://docs.agenatrader.com/~gitbook/image?url=https%3A%2F%2F2805764894-files.gitbook.io%2F%7E%2Ffiles%2Fv0%2Fb%2Fgitbook-legacy-files%2Fo%2Fassets%252F-MKZSsJBtSP9L4sqIe_q%252F-MPiXWv2a6VS9BPuIG4o%252F-MPiXwFRaZuAhfaMR3kH%252FAPi5.png%3Falt%3Dmedia%26token%3Db134829c-2325-4cd6-880b-4678e414b4d4&#x26;width=768&#x26;dpr=4&#x26;quality=100&#x26;sign=30cb64a5&#x26;sv=2" alt=""><figcaption></figcaption></figure>

After finishing the installation of **MTAPI5**, it is required to restart AgenaTrader. Please allow it to restart before continuing by clicking on **Yes**.

<figure><img src="https://docs.agenatrader.com/~gitbook/image?url=https%3A%2F%2F2805764894-files.gitbook.io%2F%7E%2Ffiles%2Fv0%2Fb%2Fgitbook-legacy-files%2Fo%2Fassets%252F-MKZSsJBtSP9L4sqIe_q%252F-MPiXWv2a6VS9BPuIG4o%252F-MPiXwFSPigCGitZvgIC%252Fyes.png%3Falt%3Dmedia%26token%3D26b08d14-11e8-4a53-9570-eeda14c06f6e&#x26;width=768&#x26;dpr=4&#x26;quality=100&#x26;sign=1066ad53&#x26;sv=2" alt=""><figcaption></figcaption></figure>


# Connection Guides

You can find all necessary information concerning connecting to the servers of the broker and data feed, as well as types of orders supported by them, on our [website](https://agenatrader.com/broker/).

Moreover, you can use the direct links to the corresponding Connection Guides:

Please, watch videos about setting the connection on our [website](https://agenatrader.com/agenaspace-online-software-training/) under **Connection Guides**.

<table data-header-hidden><thead><tr><th width="389">Broker oder DatenFeed</th><th>Links</th></tr></thead><tbody><tr><td>Broker oder DatenFeed</td><td>Links</td></tr><tr><td>Interactive Brokers (IB)</td><td><a href="https://www.youtube.com/watch?v=prdJWAIHQK0&#x26;list=PLLftyBhQjHrWFFKZsRsmKCidwnfi0awne&#x26;index=3">Verbindungs-Anleitung für IB</a></td></tr><tr><td>CAP Trader</td><td><a href="https://www.youtube.com/watch?v=prdJWAIHQK0&#x26;list=PLLftyBhQjHrWFFKZsRsmKCidwnfi0awne&#x26;index=3">Verbindungs-Anleitung für CAP Trader</a></td></tr><tr><td>Dukaskopy</td><td><a href="https://www.youtube.com/watch?v=87mNiPeXNHQ&#x26;index=4&#x26;list=PLLftyBhQjHrWFFKZsRsmKCidwnfi0awne">Verbindungs-Anleitung für Dukascopy</a></td></tr><tr><td>FXCM</td><td><a href="https://www.youtube.com/watch?v=3dZRtG024cI&#x26;list=PLLftyBhQjHrWFFKZsRsmKCidwnfi0awne&#x26;index=6">Verbindungs-Anleitung für FXCM</a></td></tr><tr><td>TeleTrader</td><td><a href="https://www.youtube.com/watch?v=x7RntTNBSEE&#x26;index=1&#x26;list=PLLftyBhQjHrXaoAyy3_S6SBhd_CqXXMjd">Verbindungs-Anleitung für TeleTrader</a></td></tr><tr><td>BarChart</td><td><a href="https://www.youtube.com/watch?v=pEMMCJSNOYM&#x26;index=4&#x26;list=PLLftyBhQjHrXaoAyy3_S6SBhd_CqXXMjd">Verbindungs-Anleitung für BarChart</a></td></tr><tr><td>IQFeed</td><td><a href="https://www.youtube.com/watch?v=xhcWndBrdFY&#x26;index=3&#x26;list=PLLftyBhQjHrXaoAyy3_S6SBhd_CqXXMjd">Verbindungs-Anleitung für IQFeed</a></td></tr><tr><td>Rithmic</td><td><a href="https://www.youtube.com/watch?v=SGHhUnqPfJk&#x26;index=7&#x26;list=PLLftyBhQjHrWFFKZsRsmKCidwnfi0awne">Verbindungs-Anleitung für Rithmic Technologie Anbieter</a></td></tr><tr><td>FXFlat</td><td><a href="https://www.youtube.com/watch?v=prdJWAIHQK0&#x26;list=PLLftyBhQjHrWFFKZsRsmKCidwnfi0awne">Verbindungs-Anleitung für FXFlat Technologieanbieter</a></td></tr></tbody></table>


# Connections

## <img src="/files/EzC4i2dDZOx9Rlo61D3L" alt="" data-size="line"> Connection

### Broker and Data Feed Connection Information

This section contains essential details for connecting to your broker or data feed.

<figure><img src="/files/Xl2mUMVZ80PsIywjgVkf" alt=""><figcaption></figcaption></figure>

| Option                                                                               | Meaning                                                                                                                                                                                                                                           |
| ------------------------------------------------------------------------------------ | ------------------------------------------------------------------------------------------------------------------------------------------------------------------------------------------------------------------------------------------------- |
| <img src="/files/6nRErufR2njlU9qJktHM" alt="" data-size="line"> Connect              | Connects to your configured broker/data feed provider (see [Connection Guides](https://docs.agenatrader.com/main/broker-and-datafeed-connections/connection-guides) for more information).                                                        |
| <img src="/files/PucAhHdWkbsDwJpN6mIn" alt="" data-size="line"> Disconnect           | Disconnects your active broker/data feed provider.                                                                                                                                                                                                |
| <img src="/files/nt8eWUq8u0fBNxdmsJ9e" alt="" data-size="line"> Add New Account      | Create new broker/data connection. Detail on page [**Account connections: Create or change a connection**](https://docs.agenatrader.com/main/broker-and-datafeed-connections/account-settings#Account_connections__Create_or_change_a_connection) |
| <img src="/files/3L6SphA4TPX6xHNNJ8nP" alt="" data-size="line"> Stop history loading | Stops the loading of historical data from your current broker/data feed provider.                                                                                                                                                                 |
| <img src="/files/UjAKAfGTEcASOor1Ms1c" alt="" data-size="line"> Reload connected     | Reload all connected broker and datafeed connections                                                                                                                                                                                              |

### Create or change a connection <a href="#account_connections__create_or_change_a_connection" id="account_connections__create_or_change_a_connection"></a>

To open the Account Connection Set Up window, perform one of the following actions:

1. Left mouse click on the <img src="/files/pbtrPycA5jjCM8IGbYQs" alt="" data-size="line"> icon in the toolbar
2. Select **Tools** from the main menu, followed by the "Account Connections" menu item.

Select the **Add / Edit** options to establish or modify connections.

Access comprehensive connection guides for various brokers and data feeds on the page.[Connection Guides](https://docs.agenatrader.com/main/broker-and-datafeed-connections/connection-guides)&#x20;

<figure><img src="https://docs.agenatrader.com/~gitbook/image?url=https%3A%2F%2F2805764894-files.gitbook.io%2F%7E%2Ffiles%2Fv0%2Fb%2Fgitbook-legacy-files%2Fo%2Fassets%252F-MKZSsJBtSP9L4sqIe_q%252F-MPiaHUC1P2L8d8rxvzk%252F-MPibZcyOL05klvCXaew%252Fadd.png%3Falt%3Dmedia%26token%3Da2a0e3c9-80cb-4742-bc5c-8118410ef3b2&#x26;width=768&#x26;dpr=4&#x26;quality=100&#x26;sign=e8478143&#x26;sv=1" alt=""><figcaption></figcaption></figure>

Initially, a definition popup will be displayed, allowing you to choose a connection name as well as a data feed or broker.

Please be aware that the connection name must not start with a number.

<figure><img src="https://docs.agenatrader.com/~gitbook/image?url=https%3A%2F%2F2805764894-files.gitbook.io%2F%7E%2Ffiles%2Fv0%2Fb%2Fgitbook-legacy-files%2Fo%2Fassets%252F-MKZSsJBtSP9L4sqIe_q%252F-MPiaHUC1P2L8d8rxvzk%252F-MPibZd13oGuLrv2KEcI%252FDukascopy.png%3Falt%3Dmedia%26token%3D5d6cf91e-ff8b-4d63-8453-9036985984cf&#x26;width=768&#x26;dpr=4&#x26;quality=100&#x26;sign=e2eafe01&#x26;sv=1" alt=""><figcaption></figcaption></figure>

After selecting the **Next** button, you will be requested to provide specific parameters for the broker or data feed provider.

Dukascopy

<figure><img src="https://docs.agenatrader.com/~gitbook/image?url=https%3A%2F%2F2805764894-files.gitbook.io%2F%7E%2Ffiles%2Fv0%2Fb%2Fgitbook-legacy-files%2Fo%2Fassets%252F-MKZSsJBtSP9L4sqIe_q%252F-MPiaHUC1P2L8d8rxvzk%252F-MPibZd2zkqJhsgUm3-k%252FDukascopy1.png%3Falt%3Dmedia%26token%3Dc5817223-7708-4359-816a-eabe8a0dface&#x26;width=768&#x26;dpr=4&#x26;quality=100&#x26;sign=bedea29f&#x26;sv=1" alt=""><figcaption></figcaption></figure>

Once the required information has been entered and the **Finish** button has been clicked, the input data will be validated and saved. The broker or data feed can now be selected in the  [connection definition list](https://docs.agenatrader.com/main/broker-and-datafeed-connections/account-settings#Account_connections__Connection_settings)

Pressing the **Finish** button will initiate the launch of the [instrument import popup](https://docs.agenatrader.com/tools/instrument-escort#Instrument_Escort__Import_and_export_of_instruments).&#x20;

After selecting and importing all stock exchanges by pressing the **Import** button, the [**Global Configuration: Market Place Escort**](https://docs.agenatrader.com/tools/configuration-escort#Configuration_Escort__Market_Place_Escort) will appear, in which you can see all exchange times.

### Request Demo <a href="#request_demo" id="request_demo"></a>

To request a Datafeed demo license via AgenaTrader, please click on the "Request Demo" button.

<figure><img src="https://docs.agenatrader.com/~gitbook/image?url=https%3A%2F%2F2805764894-files.gitbook.io%2F%7E%2Ffiles%2Fv0%2Fb%2Fgitbook-legacy-files%2Fo%2Fassets%252F-MKZSsJBtSP9L4sqIe_q%252F-MPiaHUC1P2L8d8rxvzk%252F-MPibZd3w30mmHhe6e2C%252FRequest%2520Demo.png%3Falt%3Dmedia%26token%3D57ba6fce-ed13-439b-868d-8474adfeb48f&#x26;width=768&#x26;dpr=4&#x26;quality=100&#x26;sign=91b31081&#x26;sv=1" alt=""><figcaption></figcaption></figure>

**Barchart**

* In Provider field select Barchart.
* Enter connection name and all necessary personal information in the exact field.
* Please select your credit card type and click the **Request** button.

<figure><img src="https://docs.agenatrader.com/~gitbook/image?url=https%3A%2F%2F2805764894-files.gitbook.io%2F%7E%2Ffiles%2Fv0%2Fb%2Fgitbook-legacy-files%2Fo%2Fassets%252F-MKZSsJBtSP9L4sqIe_q%252F-MPiaHUC1P2L8d8rxvzk%252F-MPibZczmNmFELX62zoI%252FBarchart.png%3Falt%3Dmedia%26token%3D7e8388d7-f8ea-4974-b3a8-7263681d39d4&#x26;width=768&#x26;dpr=4&#x26;quality=100&#x26;sign=78e645b&#x26;sv=1" alt=""><figcaption></figcaption></figure>

**Taipan**

* In Provider field select Taipan.
* Enter connection name and all necessary personal information in the exact field.
* Click button **Request**

<figure><img src="https://docs.agenatrader.com/~gitbook/image?url=https%3A%2F%2F2805764894-files.gitbook.io%2F%7E%2Ffiles%2Fv0%2Fb%2Fgitbook-legacy-files%2Fo%2Fassets%252F-MKZSsJBtSP9L4sqIe_q%252F-MPiaHUC1P2L8d8rxvzk%252F-MPibZd4v05GpN_cKFvj%252FTaipan.png%3Falt%3Dmedia%26token%3D9f506daa-a865-4b1a-847c-32351211c33b&#x26;width=768&#x26;dpr=4&#x26;quality=100&#x26;sign=7352c772&#x26;sv=1" alt=""><figcaption></figcaption></figure>

## Multi account settings

AgenaTrader provides seamless access to multiple brokers and data feeds. This feature allows users to manage multiple accounts with various brokers and utilize data from different providers concurrently.

Data feed and broker accessibility can be defined using the account connections popup.

<figure><img src="https://docs.agenatrader.com/~gitbook/image?url=https%3A%2F%2F2805764894-files.gitbook.io%2F%7E%2Ffiles%2Fv0%2Fb%2Fgitbook-legacy-files%2Fo%2Fassets%252F-MKZSsJBtSP9L4sqIe_q%252F-MPihaMnidshMQpAcQ38%252F-MPiik4MBt9getr2ly4l%252Faccount%2520settings%2520%281%29.png%3Falt%3Dmedia%26token%3D68a407f4-90d9-43ff-bbc1-eb5cdc2a74f0&#x26;width=768&#x26;dpr=4&#x26;quality=100&#x26;sign=d6b31498&#x26;sv=1" alt=""><figcaption></figcaption></figure>

To ensure consistency, it is essential to disconnect AgenaTrader from all brokers and data feed providers before making any modifications.

<figure><img src="https://docs.agenatrader.com/~gitbook/image?url=https%3A%2F%2F2805764894-files.gitbook.io%2F%7E%2Ffiles%2Fv0%2Fb%2Fgitbook-legacy-files%2Fo%2Fassets%252F-MKZSsJBtSP9L4sqIe_q%252F-MPihaMnidshMQpAcQ38%252F-MPiik4OPvZzn0TcUbak%252Faccount%2520settings%2520arrows.png%3Falt%3Dmedia%26token%3D3cc9b939-4be8-4851-a258-03226cb290b0&#x26;width=768&#x26;dpr=4&#x26;quality=100&#x26;sign=85390604&#x26;sv=1" alt=""><figcaption></figcaption></figure>

Use **Main/Connections/Connect** to link your account to data feed providers and brokers.

<figure><img src="https://docs.agenatrader.com/~gitbook/image?url=https%3A%2F%2F2805764894-files.gitbook.io%2F%7E%2Ffiles%2Fv0%2Fb%2Fgitbook-legacy-files%2Fo%2Fassets%252F-MKZSsJBtSP9L4sqIe_q%252F-MPihaMnidshMQpAcQ38%252F-MPiik4SO335lVN5XWV1%252FConnect.png%3Falt%3Dmedia%26token%3D620e3378-ac8d-42bc-a770-b75fb34e392a&#x26;width=768&#x26;dpr=4&#x26;quality=100&#x26;sign=bbddf245&#x26;sv=1" alt=""><figcaption></figcaption></figure>

Use **Main/Connections/Disconnect** to disconnect all connections again.

<figure><img src="https://docs.agenatrader.com/~gitbook/image?url=https%3A%2F%2F2805764894-files.gitbook.io%2F%7E%2Ffiles%2Fv0%2Fb%2Fgitbook-legacy-files%2Fo%2Fassets%252F-MKZSsJBtSP9L4sqIe_q%252F-MPihaMnidshMQpAcQ38%252F-MPiik4Ub76u0QzvppO1%252FDisconnect.png%3Falt%3Dmedia%26token%3D0c437d31-37be-4386-a68b-9c735eb6b919&#x26;width=768&#x26;dpr=4&#x26;quality=100&#x26;sign=48bb0551&#x26;sv=1" alt=""><figcaption></figcaption></figure>

Use **Main/Connections/Stop History Loading** to stop loading the history of the active broker/data feed.

<figure><img src="https://docs.agenatrader.com/~gitbook/image?url=https%3A%2F%2F2805764894-files.gitbook.io%2F%7E%2Ffiles%2Fv0%2Fb%2Fgitbook-legacy-files%2Fo%2Fassets%252F-MKZSsJBtSP9L4sqIe_q%252F-MPihaMnidshMQpAcQ38%252F-MPiik4WbgvvbnlezT-N%252FStopHistory.png%3Falt%3Dmedia%26token%3D9871f52b-ef28-48d1-98d7-6e6b880f41dc&#x26;width=768&#x26;dpr=4&#x26;quality=100&#x26;sign=f09f29ed&#x26;sv=1" alt=""><figcaption></figcaption></figure>

If, when starting up the program, you wish to reestablish all connections that existed prior to closing AgenaTrader, this can be set as follows:

1. Select **Global Configuration** from the main menu **Tools**
2. Inside the opened window in tabs **General/Common** check the chekboxes **Start Datafeed Automatically** and **Start Brokers Automatically**.

### Connections tab <a href="#connections_tab" id="connections_tab"></a>

The Connections tab lists brokers and data feed providers whose connections have been already established.

*It is important to distinguish between exclusive and combined data feed providers.*

For example, brokers such as Interactive Brokers or MB Trading can also fulfill the function of data feed provider. In contrast and Barchart are exclusively data feed providers.

<figure><img src="https://docs.agenatrader.com/~gitbook/image?url=https%3A%2F%2F2805764894-files.gitbook.io%2F%7E%2Ffiles%2Fv0%2Fb%2Fgitbook-legacy-files%2Fo%2Fassets%252F-MKZSsJBtSP9L4sqIe_q%252F-MPihaMnidshMQpAcQ38%252F-MPiik4P-12v_osnn3eh%252Faccount%2520settings.png%3Falt%3Dmedia%26token%3Dd8364c0c-4895-46e6-b588-ba9a3ebae5fb&#x26;width=768&#x26;dpr=4&#x26;quality=100&#x26;sign=c67a62a9&#x26;sv=1" alt=""><figcaption></figcaption></figure>

| Column   | Meaning                                                 |
| -------- | ------------------------------------------------------- |
| Provider | The name of the broker and/or data feed provider        |
| Feed     | Here you can select from available data feed providers. |
| Broker   | Refers to the broker to whom the orders are forwarded.  |

### Datafeeds tab <a href="#datafeeds_tab" id="datafeeds_tab"></a>

In the "Datafeeds" tab, you can specify the preferred data feed provider for various types of securities. Multiple providers can be selected for each data feed.

To configure the backup data feed, ensure the setting remains on **All**. If data from the primary provider becomes unavailable, the backup data feed will automatically connect.

**Example 1.**

<figure><img src="https://docs.agenatrader.com/~gitbook/image?url=https%3A%2F%2F2805764894-files.gitbook.io%2F%7E%2Ffiles%2Fv0%2Fb%2Fgitbook-legacy-files%2Fo%2Fassets%252F-MKZSsJBtSP9L4sqIe_q%252F-MPihaMnidshMQpAcQ38%252F-MPiik4TPydFylGTMeba%252FCQG.png%3Falt%3Dmedia%26token%3D641cafa5-45ed-4794-b5b1-6b835044024a&#x26;width=768&#x26;dpr=4&#x26;quality=100&#x26;sign=dbf51eff&#x26;sv=1" alt=""><figcaption></figcaption></figure>

*Meaning:* Dukascopy provides all market data.

**Example 2.**

<figure><img src="https://docs.agenatrader.com/~gitbook/image?url=https%3A%2F%2Fagenatrader.com%2Fwiki%2Ftiki-download_file.php%3FfileId%3D1849%26display%26max%3D1000&#x26;width=768&#x26;dpr=4&#x26;quality=100&#x26;sign=10037b81&#x26;sv=1" alt=""><figcaption></figcaption></figure>

*Meaning:*

* TaiPan provides stock prices
* FXCM provides currency prices

**Example 3.**

<figure><img src="https://docs.agenatrader.com/~gitbook/image?url=https%3A%2F%2F2805764894-files.gitbook.io%2F%7E%2Ffiles%2Fv0%2Fb%2Fgitbook-legacy-files%2Fo%2Fassets%252F-MKZSsJBtSP9L4sqIe_q%252F-MPihaMnidshMQpAcQ38%252F-MPiik4R2QIXU8y7M4l0%252FBarchart.png%3Falt%3Dmedia%26token%3Dcb2ca981-4e90-4798-84f4-c675e96a9999&#x26;width=768&#x26;dpr=4&#x26;quality=100&#x26;sign=7e53c810&#x26;sv=1" alt=""><figcaption></figcaption></figure>

*Meaning:*

* All prices for instruments traded on Frankfurt will be delivered from BarChart
* Futures prices traded on Chicago Board of Trade (CBOT) will be provided by Dukascopy. The remaining futures data will be retrieved e.g. from TaiPan.

{% hint style="info" %}
**Note:** The market/exchange is of the first priority The instrument type is of the second priority.
{% endhint %}

### Accounts tab <a href="#accounts_tab" id="accounts_tab"></a>

The "Accounts" tab allows you to specify the preferred brokers for various asset types. It supports the selection of multiple brokers.

**Example 1.**

<figure><img src="https://docs.agenatrader.com/~gitbook/image?url=https%3A%2F%2Fagenatrader.com%2Fwiki%2Ftiki-download_file.php%3FfileId%3D1851%26display%26max%3D1000&#x26;width=768&#x26;dpr=4&#x26;quality=100&#x26;sign=e8846350&#x26;sv=1" alt=""><figcaption></figcaption></figure>

*Meaning:*

* All trades are forwarded to DukasCopy to the account 423611
* Currency trades are forwarded to FXCM.
* Futures and CFD trades are forwarded to IB
* Stock trades are forwarded to XTB

**Example 2.**

<figure><img src="https://docs.agenatrader.com/~gitbook/image?url=https%3A%2F%2F2805764894-files.gitbook.io%2F%7E%2Ffiles%2Fv0%2Fb%2Fgitbook-legacy-files%2Fo%2Fassets%252F-MKZSsJBtSP9L4sqIe_q%252F-MPihaMnidshMQpAcQ38%252F-MPiik4XlqWffRy16AaL%252FAccounts2.png%3Falt%3Dmedia%26token%3Dfa545aee-a563-45bb-9cb8-8d954ad26935&#x26;width=768&#x26;dpr=4&#x26;quality=100&#x26;sign=e5caa708&#x26;sv=1" alt=""><figcaption></figcaption></figure>

*Meaning:*

* Futures trades will be forwarded via IB to the exchanges Euronext and Paris
* Stock trades will be forwarded via XTB to Nasdaq.

### Connecting to more than one CFD-Broker simultaneously

**Issue:**

You aim to establish connections with multiple brokers concurrently, but you encounter an error message each time you attempt to do so:

<figure><img src="https://docs.agenatrader.com/~gitbook/image?url=https%3A%2F%2F2805764894-files.gitbook.io%2F%7E%2Ffiles%2Fv0%2Fb%2Fgitbook-legacy-files%2Fo%2Fassets%252F-MKZSsJBtSP9L4sqIe_q%252F-MQwPCScTa47vxWsw7R-%252F-MQwRo2UCJOQSpwjDJSK%252FErrorMultiBroker.png%3Falt%3Dmedia%26token%3D6098ed24-5e31-492e-bba3-43d11b330caa&#x26;width=768&#x26;dpr=4&#x26;quality=100&#x26;sign=6040652f&#x26;sv=1" alt=""><figcaption></figcaption></figure>

**Solution:**

We have implemented "virtual CFD-exchanges" for InstrumentEditor ("CFD1" - "CFD10"). From now on you can assign broker-specific CFDs to each of these exchanges.

To connect to multiple CFD brokers simultaneously, navigate to your Account connection settings and select "Accounts." Choose "Markets only" for each broker. Then, assign a unique virtual exchange to each broker and confirm.

<figure><img src="https://docs.agenatrader.com/~gitbook/image?url=https%3A%2F%2F2805764894-files.gitbook.io%2F%7E%2Ffiles%2Fv0%2Fb%2Fgitbook-legacy-files%2Fo%2Fassets%252F-MKZSsJBtSP9L4sqIe_q%252F-MQwPCScTa47vxWsw7R-%252F-MQwRs40Tx5enyEDEZCV%252FVirtualExchanges2.png%3Falt%3Dmedia%26token%3Dcd1a42bc-7cde-43a7-94d6-1f1c6756a4b9&#x26;width=768&#x26;dpr=4&#x26;quality=100&#x26;sign=126336f6&#x26;sv=1" alt=""><figcaption></figcaption></figure>

## Which order connections does my broker support?

**Overview order connections**

In AgenaTrader, you have the capability to configure complex order structures.  "IfDone", "OCO" (One Cancels Other), and "ORO" (One Reduces Other) functionalities are available for your [order connections](https://docs.agenatrader.com/main/chart-area/untitled/chart-context-menu#order-groups)

"IfDone", "OCO" (One Cancels Other), and "ORO" (One Reduces Other) functionalities are available for your order connections.&#x20;

IfDone is established by pressing "ALT" and clicking on both the first and second orders. OCO is formed by pressing "CTRL" and clicking on the first and second orders. ORO is configured by pressing "CTRL" + "ALT" and clicking on the first and second orders.

**Supported versus locally simulated connections**

{% hint style="info" %}
**Note:** IfDone and ORO are only simulated locally in AgenaTrader, which means that the software must be running and connected to the broker in order to be able to send second order to the broker!
{% endhint %}

OCO connections are supported by several brokers - you can find the corresponding information on this in the online help under the [respective broker](https://docs.agenatrader.com/main/broker-and-datafeed-connections/broker). This has restrictions that should be taken into account, however: this only applies to single target orders. Order connections in multi-target settings are ORO connections and are therefore only simulated locally as displayed in log:

<figure><img src="https://docs.agenatrader.com/~gitbook/image?url=https%3A%2F%2F2805764894-files.gitbook.io%2F%7E%2Ffiles%2Fv0%2Fb%2Fgitbook-legacy-files%2Fo%2Fassets%252F-MKZSsJBtSP9L4sqIe_q%252F-MQwPCScTa47vxWsw7R-%252F-MQwSEjjp6FW7ry25uYw%252FMultiTargetOCO.png%3Falt%3Dmedia%26token%3D43358783-842d-499e-85e4-1e9a7c6830d3&#x26;width=768&#x26;dpr=4&#x26;quality=100&#x26;sign=a57bb304&#x26;sv=1" alt=""><figcaption></figcaption></figure>

You will find information about which broker does support OCO, here in the online help under the [respective broker](https://docs.agenatrader.com/main/broker-and-datafeed-connections/broker) was well as in Essential Informations-window, that pops up, when you create a new account connection. You need to read and accept this disclaimer:

<figure><img src="https://docs.agenatrader.com/~gitbook/image?url=https%3A%2F%2F2805764894-files.gitbook.io%2F%7E%2Ffiles%2Fv0%2Fb%2Fgitbook-legacy-files%2Fo%2Fassets%252F-MKZSsJBtSP9L4sqIe_q%252F-MQwPCScTa47vxWsw7R-%252F-MQwSJM1IxYemswEyP_w%252FDisclaimerOrderConnections.png%3Falt%3Dmedia%26token%3D3ee8a3a5-3b02-40f1-9fe0-c40f382bb7ce&#x26;width=768&#x26;dpr=4&#x26;quality=100&#x26;sign=e09f2e9&#x26;sv=1" alt=""><figcaption></figcaption></figure>

## Connection issues

#### Correctly establishing a connection to a broker or data feed <a href="#correctly_establishing_a_connection_to_a_broker_or_data_feed" id="correctly_establishing_a_connection_to_a_broker_or_data_feed"></a>

Occasionally, problems may occur with the connection to a broker or data feed. In most cases, this is due to the connection to the broker or data feed not being correctly established.

It is recommended to check whether you are subscribed to the corresponding service or have opened an account with the relevant provider. Depending on the provider, there are often several important tips to consider (e.g., activating certain functions in the TWS, synchronized settings of the ports, and so on). You can find all these notes in the connection guides that we make available online.&#x20;

**Connection guides for brokers and data feeds**

The connection guides assist you in seamlessly connecting your preferred data feed provider or broker to AgenaTrader. This connection is essential for AgenaTrader to receive market data and facilitate trading activities with the broker.

On our website, you can find the selection of brokers and data feeds via the navigation "Partners". You will see a list of all our partners. Select your desired broker or data feed and read the respective description.

You can find our partners here on our website: [Brokers](https://agenatrader.com/de/broker/) [Data feed](https://agenatrader.com/de/marktdaten-echtzeit/)

Youtube videos: [Connection guides](https://www.youtube.com/user/AgenaTrader/playlists?sort=dd\&view=50\&shelf_id=4)


# Simulated account

**Simulated account**

Opening up a simulated account offers a perfect opportunity for beginners to explore trading specifics in exchanges, to assess the possibilities of the trading platform AgenaTrader and also to develop their own strategies.

*The advantages of our simulated account are:*

1. This is an internal account, which allows you to use it at any time without limitations and broker binding.
2. It simulates a broker trading account and so creates real conditions for testing.

**Advantages of our simulated account:**

| Open an account                                                                                                                                  | References                              |
| ------------------------------------------------------------------------------------------------------------------------------------------------ | --------------------------------------- |
| Simulated account                                                                                                                                | [Open](https://agenatrader.com/broker/) |
| [Youtube Guide "How to open a simulated account"](https://www.youtube.com/watch?v=KSUyEmLd1fU\&list=PLpXCfYw2ra--CD0sAIyjol3S-BXKrQmbm\&index=1) |                                         |

**Setting commissions in the simulation account**

In order to make trading with the internal simulation account in AgenaTrader as realistic as possible, you can set commissions for each instrument group that allocated to each of your simulation trades. Using the connection settings, you can edit your simulation account:

<figure><img src="https://docs.agenatrader.com/~gitbook/image?url=https%3A%2F%2F2805764894-files.gitbook.io%2F%7E%2Ffiles%2Fv0%2Fb%2Fgitbook-legacy-files%2Fo%2Fassets%252F-MKZSsJBtSP9L4sqIe_q%252F-MPhn7zlMCA093nNUSJf%252F-MPi8YLKGy-XUOElc4nI%252FSimulationskonto_edit.png%3Falt%3Dmedia%26token%3Dee485ce1-f9f3-4cbd-b0e3-50e0449e9958&#x26;width=768&#x26;dpr=4&#x26;quality=100&#x26;sign=723b0b3b&#x26;sv=1" alt=""><figcaption></figcaption></figure>

In the following window, you can see the commission settings. Under Amount/Unit, you can set which commissions per traded unit (stock, future, CFD, currency pair) should be allocated. The settings are in absolute numbers and are in the currency that you have set for your simulation account. In the Min field, you can set a minimum commission for each order, as is usually charged by most brokers. If, for example, you buy 1 Apple share and you have set commissions for it at 1€ per order for stocks (Amount/Unit), but the minimum commission is set to 10€, then this order will be charged 10€ commission, since this is obviously the minimum fee value.

<figure><img src="https://docs.agenatrader.com/~gitbook/image?url=https%3A%2F%2F2805764894-files.gitbook.io%2F%7E%2Ffiles%2Fv0%2Fb%2Fgitbook-legacy-files%2Fo%2Fassets%252F-MKZSsJBtSP9L4sqIe_q%252F-MPhn7zlMCA093nNUSJf%252F-MPi8YLJzOato1ZZtgCn%252FSimulationskonto_comision.png%3Falt%3Dmedia%26token%3D816da007-6ab8-4f05-8b1e-0ae228997f45&#x26;width=768&#x26;dpr=4&#x26;quality=100&#x26;sign=cfc16e5e&#x26;sv=1" alt=""><figcaption></figcaption></figure>

**Example:**

<figure><img src="https://docs.agenatrader.com/~gitbook/image?url=https%3A%2F%2F2805764894-files.gitbook.io%2F%7E%2Ffiles%2Fv0%2Fb%2Fgitbook-legacy-files%2Fo%2Fassets%252F-MKZSsJBtSP9L4sqIe_q%252F-MPhn7zlMCA093nNUSJf%252F-MPi8YLLhWcnsffRJFGR%252FSimulationskonto_comision_example.png%3Falt%3Dmedia%26token%3Ded7d175f-b84c-4602-ae3a-46fe77983fb2&#x26;width=768&#x26;dpr=4&#x26;quality=100&#x26;sign=99c50d87&#x26;sv=1" alt=""><figcaption></figcaption></figure>

As an example, I have chosen the following settings in as realistic a manner as possible:

* For stocks/ETF: 1.00 USD per traded stock/ETF, minimum fee = 5.00USD
* For futures: 2.50 USD per traded future, minimum fee = 10.00 USD
* For currencies: no fees, since most Forex brokers only charge the spread
* For CFDs: 1.00 USD per traded CFD, no minimum fees

{% hint style="info" %}
**Important!** Sim account can have a minus value which means that trading with sim account exceeded account cash value.
{% endhint %}


# Datafeed

This section provides an overview of all data feeds supported by AgenaTrader. A data feed is a crucial component of your trading setup, as it delivers real-time market data, historical data, and price quotes that allow you to analyze markets, make informed decisions, and execute trades effectively.

AgenaTrader supports a variety of data feed providers to ensure compatibility with different trading needs. Whether you trade stocks, forex, futures, or other instruments, a reliable data feed is essential for accurate charting, backtesting, and strategy execution.

By supporting a wide range of data feed providers, AgenaTrader enables you to connect with the provider that best matches your trading style, market focus, and budget. Explore this section to discover the full list of supported data feeds and find the one that suits your trading requirements.

## Barchart <a href="#barchart" id="barchart"></a>

### Brief overview of BarChart <a href="#brief_overview_of_barchart" id="brief_overview_of_barchart"></a>

BarChart is a famous provider of historical data in real time. Following the introduction of its new system BarChart on Demand, which is capable of working to the highest standards regardless of the operating system, its informational data base is now considered one of the best. It captures share prices that are received directly from more than 70 exchanges around the world.

You can open a real or demo account at BarChart via our [website](https://agenatrader.com/datafeeds/).

### Connecting <a href="#connecting" id="connecting"></a>

Please follow the instructions in the following video to establish the connection correctly

{% embed url="<https://youtu.be/Pa92eM8MqtU>" %}

### Essential Information <a href="#essential-information" id="essential-information"></a>

**Cumulative Indices**

Only displayed and can be added to the chart if connected to one of the following datafeeds: Taipan, IQFeed or Barchart. They display an oscillator of cumulated data of the specific index.

{% hint style="info" %}
ATTENTION! To be able to see the Cumulative Indices, you must select "All" or "Index" for your specific datafeed in the Datafeed-Tab in the Account connection set-up.
{% endhint %}

![](https://docs.agenatrader.com/~gitbook/image?url=https%3A%2F%2F2805764894-files.gitbook.io%2F%7E%2Ffiles%2Fv0%2Fb%2Fgitbook-legacy-files%2Fo%2Fassets%252F-MKZSsJBtSP9L4sqIe_q%252F-MPiPonwz5ZbDRDgi6hx%252F-MPiQ5tp6Sp4AN1dzlaF%252FCumulative%2520indices.png%3Falt%3Dmedia%26token%3Dabb7599d-9237-492b-9725-ec0ec1df0d93\&width=768\&dpr=4\&quality=100\&sign=f2aca07d\&sv=1)

## IQFeed <a href="#iqfeed" id="iqfeed"></a>

### Brief overview of IQFeed <a href="#brief_overview_of_iqfeed" id="brief_overview_of_iqfeed"></a>

IQFeed is one of the leaders in the international financial market regarding data delivery in real time. Its main advantage is that it transfers the historical data and quotes tick-by-tick, allowing traders to view all short-term changes on a chart.

You can open a real or demo account at IQFeed via our [website](https://agenatrader.com/datafeeds/).

### Connecting <a href="#connecting-1" id="connecting-1"></a>

Please follow the instructions in the following video to establish the connection correctly:

{% embed url="<https://youtu.be/wcdPEeDJdHo>" %}

### Essential information <a href="#essential-information-1" id="essential-information-1"></a>

*Futures trading IQFeed*

If you use IQFeed as a data feed provider you can integrate the desired contract into the chart using the Instrument Editor.

1. In order to use this functionality, select "Read/Mapping instruments" within the Instrument Editor or the "Instruments: Markets & Mappings“ menu item in the Tools menu.
2. As long as you are using a demo account from IQ the available history will be limited. As soon as you switch to a live-account you will be able to see all available history from IQ.

{% hint style="info" %}
**Important!** Minute data is available for years back. However, tick data is only available for 8 days back during market hours and 180 days outside market hours.
{% endhint %}

### **Additional options** <a href="#additional-options" id="additional-options"></a>

There are three possible ways to load the futures contract history:

Continuous CC = continuous contract. This allows you to map the Front Month history, and the gaps between the contracts will still be visible. FrontMonth FM = actual contract according to calendar only BackAdjusted BA = This is a continuous contract, however there are no longer any gaps between different contracts.

For IQFeed "Continuous" or "Back adjusted" contracts it is not possible to have more than ONE instrument with the same type/mapping.

<figure><img src="https://docs.agenatrader.com/~gitbook/image?url=https%3A%2F%2F2805764894-files.gitbook.io%2F%7E%2Ffiles%2Fv0%2Fb%2Fgitbook-legacy-files%2Fo%2Fassets%252F-MKZSsJBtSP9L4sqIe_q%252F-MPiPonwz5ZbDRDgi6hx%252F-MPiQ5tqjZ1DkCTEVQPw%252FIQFeed.png%3Falt%3Dmedia%26token%3D87bbed12-e9b5-4a7b-8e12-e1da21f3e406&#x26;width=768&#x26;dpr=4&#x26;quality=100&#x26;sign=327398a4&#x26;sv=1" alt=""><figcaption></figcaption></figure>

* Select the "Instrument Editor" menu item from the Tools menu.

For example: the simultaneous mapping of FDAXSept13 & FDAXDec13 is not possible. If you have 2 instruments with the same mapping you will receive an error message in the Protocol tab notifying you which values are being referred to. The reason for this is that the IQFeed always attaches the historical data to the Front Month contract, which is automatically shifted to the following Front Month contract one day before the rollover.

After changing the contract, reconnection is required.

### **Cumulative Indices** <a href="#cumulative-indices" id="cumulative-indices"></a>

Only displayed and can be added to the chart if connected to one of the following datafeeds: Taipan, IQFeed or Barchart. They display an oscillator of cumulated data of the specific index.

{% hint style="warning" %}
ATTENTION! To be able to see the Cumulative Indices, you must select "All" or "Index" for your specific datafeed in the Datafeed-Tab in the Account connection set-up.
{% endhint %}

<figure><img src="https://docs.agenatrader.com/~gitbook/image?url=https%3A%2F%2F2805764894-files.gitbook.io%2F%7E%2Ffiles%2Fv0%2Fb%2Fgitbook-legacy-files%2Fo%2Fassets%252F-MKZSsJBtSP9L4sqIe_q%252F-MPiPonwz5ZbDRDgi6hx%252F-MPiQ5tlLXF0wiJih4vo%252FCumulative%2520indices%2520%281%29.png%3Falt%3Dmedia%26token%3Dd0df8e9c-7ced-4c77-ac00-9fa874dbae19&#x26;width=768&#x26;dpr=4&#x26;quality=100&#x26;sign=71b6e733&#x26;sv=1" alt=""><figcaption></figcaption></figure>

## TaiPan <a href="#taipan" id="taipan"></a>

### Brief overview of TaiPan <a href="#brief_overview_of_taipan" id="brief_overview_of_taipan"></a>

A well-maintained database is absolutely essential as a reliable basis for investment decisions. The Lenz+Partner AG is part of the vwd group, one of the largest providers of capital market information in Europe, and has 25 years of experience in the development of stock exchange software and corresponding data services.

You can open a real or demo account at Lenz + Partner via our [website](https://agenatrader.com/datafeeds/).

### Connecting <a href="#connecting-2" id="connecting-2"></a>

Please follow the instructions in the following video to establish the connection correctly:

{% embed url="<https://youtu.be/WJmwA8ULIQQ>" %}

### **Important: reconnect, restart, reload** <a href="#important-reconnect-restart-reload" id="important-reconnect-restart-reload"></a>

We recommend to reconnect and restart the Taipan realtime client on a daily basis, as, when being connected continuously and round-the-clock, a full and smooth data supply cannot be guaranteed on the part of Taipan realtime platform. A daily reconnect, restart and reload as well as - on occasion - clearing the "History"-folder will help.

Therefore please open GlobalConfiguration -> directories -> data directory -> History and delete the file containing Taipan-history. Close AgenaTrader and restart it - all Taipan-history will be loaded up-to-date.

**Note:** There are four checkboxes in Taipan connection settings:

**FrontMonth** = actual contract according to the calendar only \
**Continuous Contract** = continuous contract

**AutoStart Tai-Pan Realtime:** allow to start Tai-Pan Realtime when user establishes connection through AgenaTrader **Close** **Tai-Pan Realtime on Disconnect:** automatically close Tai-Pan Realtime after disconnection in AgenaTrader

**Additional Options**

AgenaTrader allows you to set a futures rollover alert. More information about futures contracts can be found in the section [Futures](https://docs.agenatrader.com/tools/configuration-escort#discretionary-trading).

**Definition for contracts:**

Continuous CC = continuous contract \
FrontMonth FM = actual contract according to calendar only

As described in [Taipan connection guide](https://www.youtube.com/watch?v=WJmwA8ULIQQ\&index=4\&list=PLpXCfYw2ra-9SLyMMS7UGqk085okmStiB), you can choose in account settings, if you want "CC" or "FM". Whatever is chosen there, will be regarded as the default setting afterward. No matter what contract you have in Connection settings, AgenaTrader will use settings from Instrument Editor for the selected instrument.

<figure><img src="https://docs.agenatrader.com/~gitbook/image?url=https%3A%2F%2F2805764894-files.gitbook.io%2F%7E%2Ffiles%2Fv0%2Fb%2Fgitbook-legacy-files%2Fo%2Fassets%252F-MKZSsJBtSP9L4sqIe_q%252F-MPiPonwz5ZbDRDgi6hx%252F-MPiQ5tv4Tx_aLKyelUn%252FTaipan.png%3Falt%3Dmedia%26token%3D42e1b48f-154b-4dbe-ba51-6b08cf0a4dbb&#x26;width=768&#x26;dpr=4&#x26;quality=100&#x26;sign=29d8d350&#x26;sv=1" alt=""><figcaption></figcaption></figure>

**Cumulative Indices**

Only displayed and can be added to the chart if connected to one of the following datafeeds: Taipan, IQFeed or Barchart. They display an oscillator of cumulated data of the specific index.

{% hint style="warning" %}
ATTENTION! To be able to see the Cumulative Indices, you must select "All" or "Index" for your specific datafeed in the Datafeed-Tab in the Account connection set-up.
{% endhint %}

![](https://docs.agenatrader.com/~gitbook/image?url=https%3A%2F%2F2805764894-files.gitbook.io%2F%7E%2Ffiles%2Fv0%2Fb%2Fgitbook-legacy-files%2Fo%2Fassets%252F-MKZSsJBtSP9L4sqIe_q%252F-MPiPonwz5ZbDRDgi6hx%252F-MPiQ5tnMFckTYyi9RZc%252FCumulative%2520indices%2520%282%29.png%3Falt%3Dmedia%26token%3D39e0020f-c6da-44cb-8b8d-426ea22c8db9\&width=768\&dpr=4\&quality=100\&sign=4d5072d0\&sv=1)

### **TaiPan.Net** <a href="#taipan-.net" id="taipan-.net"></a>

With the new TeiPan.Net connection there is no need to install the desktop client of datafeed. It will connect to Taipan API directly.

To create a new connection please follow the instructions:

1. Enter a connection name.
2. Choose TaiPan.Net as a provider.
3. Click "Next" button.
4. Enter your user id and password
5. Select the contract for futures (Continuous or Front Month contract).
6. Click "Finish" button.
7. Select the instrument lists you need.
8. Click "Import instruments lists" button.

<figure><img src="https://docs.agenatrader.com/~gitbook/image?url=https%3A%2F%2F2805764894-files.gitbook.io%2F%7E%2Ffiles%2Fv0%2Fb%2Fgitbook-legacy-files%2Fo%2Fassets%252F-MKZSsJBtSP9L4sqIe_q%252F-MPiPonwz5ZbDRDgi6hx%252F-MPiQ5trwZfbbELvGHX4%252FTaiPan.Net%2520connection%25201.png%3Falt%3Dmedia%26token%3D8918af53-7a3e-4860-8153-8758095d2a03&#x26;width=768&#x26;dpr=4&#x26;quality=100&#x26;sign=bcd7e687&#x26;sv=1" alt=""><figcaption></figcaption></figure>

With TaiPan.Net you can receive Dax30 Options data. With regular Taipan connection, there is no such ability.

<figure><img src="https://docs.agenatrader.com/~gitbook/image?url=https%3A%2F%2F2805764894-files.gitbook.io%2F%7E%2Ffiles%2Fv0%2Fb%2Fgitbook-legacy-files%2Fo%2Fassets%252F-MKZSsJBtSP9L4sqIe_q%252F-MPiPonwz5ZbDRDgi6hx%252F-MPiQ5tuy4Y6uoFw5zH2%252FTaiPan.Net%2520options.png%3Falt%3Dmedia%26token%3Dcadb8888-c3f8-4414-bdff-98737855240c&#x26;width=768&#x26;dpr=4&#x26;quality=100&#x26;sign=a98efa7&#x26;sv=1" alt=""><figcaption></figcaption></figure>

## Bloomberg <a href="#bloomberg" id="bloomberg"></a>

### Brief overview of Bloomberg <a href="#brief-overview-of-bloomberg" id="brief-overview-of-bloomberg"></a>

A consolidated feed from 35 million instruments provides sophisticated normalized data, streamlining analysis and decisions from front office to operations.

Load / Costs / Limitations / Supported instrument types etc. TBD

### Preparing Bloomberg SAPI <a href="#preparing-bloomberg-sapi" id="preparing-bloomberg-sapi"></a>

A Bloomberg Server API (SAPI) instance is required. It can be installed with the help of Bloomberg support, but the following should be prepared beforehand:

1. Install AgenaTrader 2.11.0.6 or newer and run it with a valid licence
2. Register as a Bloomberg customer and install the Bloomberg Terminal
3. Prepare a server:
   * It can either be a local PC with:
     * Microsoft Windows (preferably Microsoft Windows Server 2012 or newer)
     * Solaris or Linux server distributive
   * Or a remote server (VPS/VDS)

If you have prepared the above, get in touch with Bloomberg support and ask them to help activate your SAPI instance.

### Before connecting <a href="#before-connecting" id="before-connecting"></a>

Before we proceed any further, make sure that the previously activated SAPI (service and process) is running properly.

1. Press the Windows + R keys on your keyboard to open the Run window.
2. Type services.msc and hit Enter on your keyboard or click/tap the OK button
3. The Services app window is now open
4. Locate the "Bloomberg ServerApi service and double-click on it
5. Make sure that the service status says "Running"

Bloomberg ServerApi service Properties

<figure><img src="https://docs.agenatrader.com/~gitbook/image?url=https%3A%2F%2F2805764894-files.gitbook.io%2F%7E%2Ffiles%2Fv0%2Fb%2Fgitbook-x-prod.appspot.com%2Fo%2Fspaces%252F-MKZSsJBtSP9L4sqIe_q-887967055%252Fuploads%252FauaoZDhx1RzuRbqa4IYO%252Fimage.png%3Falt%3Dmedia%26token%3D765d2b87-5137-4c6d-a2c8-27347b0b06d3&#x26;width=768&#x26;dpr=4&#x26;quality=100&#x26;sign=5edbb705&#x26;sv=1" alt=""><figcaption></figcaption></figure>

Now let's make sure that the Windows Firewall won't be preventing you from connecting. If you use a 3rd party firewall, please get in touch with the corresponding support, should any issues arise.

1. Press the Windows + R keys on your keyboard to open the Run window.
2. Type wf.msc and hit Enter on your keyboard or click/tap the OK button
3. On the left, click on "Inbound Rules"
4. Mark Bloomberg Server API by left-clicking on it
5. On the right, click on "New Rule..."
6. In the “New Inbound Rule Wizard” select "Port":

   Adding a firewall rule to Bloomberg SAPI

   <figure><img src="https://docs.agenatrader.com/~gitbook/image?url=https%3A%2F%2F2805764894-files.gitbook.io%2F%7E%2Ffiles%2Fv0%2Fb%2Fgitbook-x-prod.appspot.com%2Fo%2Fspaces%252F-MKZSsJBtSP9L4sqIe_q-887967055%252Fuploads%252Fxs2dhPMWYHadK73JpVJc%252Fimage.png%3Falt%3Dmedia%26token%3D17210c06-c50d-4118-b985-4adb51827436&#x26;width=768&#x26;dpr=4&#x26;quality=100&#x26;sign=ec5a0816&#x26;sv=1" alt=""><figcaption></figcaption></figure>
7. Click on Next
8. Select TCP from the list and enter the following specific port: 8294

   Entering the SAPI port

   <figure><img src="https://docs.agenatrader.com/~gitbook/image?url=https%3A%2F%2F2805764894-files.gitbook.io%2F%7E%2Ffiles%2Fv0%2Fb%2Fgitbook-x-prod.appspot.com%2Fo%2Fspaces%252F-MKZSsJBtSP9L4sqIe_q-887967055%252Fuploads%252FLoK95lpkBs9uh7Sv4wu6%252Fimage.png%3Falt%3Dmedia%26token%3D849afc92-ccfd-4a75-b1b8-c2f086d7e250&#x26;width=768&#x26;dpr=4&#x26;quality=100&#x26;sign=ccd1ec64&#x26;sv=1" alt=""><figcaption></figcaption></figure>
9. Click on next and leave "Allow the connection" checked:

   Allow the connection

   <figure><img src="https://docs.agenatrader.com/~gitbook/image?url=https%3A%2F%2F2805764894-files.gitbook.io%2F%7E%2Ffiles%2Fv0%2Fb%2Fgitbook-x-prod.appspot.com%2Fo%2Fspaces%252F-MKZSsJBtSP9L4sqIe_q-887967055%252Fuploads%252FUQFk2D9rMYKmjA8D9y65%252Fimage.png%3Falt%3Dmedia%26token%3Db6d354aa-142e-470b-9fb4-99675a551ccf&#x26;width=768&#x26;dpr=4&#x26;quality=100&#x26;sign=f7570132&#x26;sv=1" alt=""><figcaption></figcaption></figure>
10. Click on next and leave all of the checkboxes checked:

    Select to what profiles the rule is supposed to be applied to

    <figure><img src="https://docs.agenatrader.com/~gitbook/image?url=https%3A%2F%2F2805764894-files.gitbook.io%2F%7E%2Ffiles%2Fv0%2Fb%2Fgitbook-x-prod.appspot.com%2Fo%2Fspaces%252F-MKZSsJBtSP9L4sqIe_q-887967055%252Fuploads%252FWkylcJp4MPlo2No4FAah%252Fimage.png%3Falt%3Dmedia%26token%3Dadd2ce47-773f-4f31-b127-57b18938454a&#x26;width=768&#x26;dpr=4&#x26;quality=100&#x26;sign=d0d59f9b&#x26;sv=1" alt=""><figcaption></figcaption></figure>
11. The last step is to name and describe the added rule. This is how we described it: Name: Bloomberg Server API Description: Allow incoming connections to Bloomberg SAPI at the 8294 port

    Name and describe the rule

    <figure><img src="https://docs.agenatrader.com/~gitbook/image?url=https%3A%2F%2F2805764894-files.gitbook.io%2F%7E%2Ffiles%2Fv0%2Fb%2Fgitbook-x-prod.appspot.com%2Fo%2Fspaces%252F-MKZSsJBtSP9L4sqIe_q-887967055%252Fuploads%252F8srUagvzlkHeUSQ1dxwR%252Fimage.png%3Falt%3Dmedia%26token%3Dce45f5df-496c-4963-ba86-41849e480488&#x26;width=768&#x26;dpr=4&#x26;quality=100&#x26;sign=6b3378e5&#x26;sv=1" alt=""><figcaption></figcaption></figure>

### Connecting <a href="#connecting-3" id="connecting-3"></a>

1. Contact our support, so that we can enable the Bloomberg connector for your licence
2. After you have received a confirmation, restart your AgenaTrader
3. In AgenaTrader, click on Main -> Connections -> Add New Account
4. In the Account Connection Setup window click on Add

   Add the connection

   <figure><img src="https://docs.agenatrader.com/~gitbook/image?url=https%3A%2F%2F2805764894-files.gitbook.io%2F%7E%2Ffiles%2Fv0%2Fb%2Fgitbook-x-prod.appspot.com%2Fo%2Fspaces%252F-MKZSsJBtSP9L4sqIe_q-887967055%252Fuploads%252FG2Cr3rSxXaKtHjck1CiJ%252Fimage.png%3Falt%3Dmedia%26token%3Dfaf42ee0-38cc-4e9e-b9d4-2e75647b7631&#x26;width=768&#x26;dpr=4&#x26;quality=100&#x26;sign=ed083d62&#x26;sv=1" alt=""><figcaption></figcaption></figure>
5. Select Bloomberg as your provider and name the connection

   Name your connection

   <figure><img src="https://docs.agenatrader.com/~gitbook/image?url=https%3A%2F%2F2805764894-files.gitbook.io%2F%7E%2Ffiles%2Fv0%2Fb%2Fgitbook-x-prod.appspot.com%2Fo%2Fspaces%252F-MKZSsJBtSP9L4sqIe_q-887967055%252Fuploads%252F2kn2GvDg8tmBu3NEATJ4%252Fimage.png%3Falt%3Dmedia%26token%3Ddd466882-b939-4028-b79e-dee891b2e142&#x26;width=768&#x26;dpr=4&#x26;quality=100&#x26;sign=b335adda&#x26;sv=1" alt=""><figcaption></figcaption></figure>
6. After clicking on Next, the following window will appear:

   Connection details

   **“Bloomberg SAPI” Hostname or IP address:** Insert your SAPI server hostname or IP address **”Bloomberg SAPI” Port:** Insert your SAPI server port

   **Bloomberg Terminal install location (optional):** Use only if AgenaTrader can’t locate the installation path of your Bloomberg Terminal.

   **Bloomberg BLPAPI log level:** Select what type of logs to collect:

   1. Off (default): no BLPAPI logs
   2. Error: BLPAPI errors
   3. Warning: BLPAPI warnings
   4. Info: BLPAPI info request
   5. Verbose: All BLPAPI requests

      <figure><img src="https://docs.agenatrader.com/~gitbook/image?url=https%3A%2F%2F2805764894-files.gitbook.io%2F%7E%2Ffiles%2Fv0%2Fb%2Fgitbook-x-prod.appspot.com%2Fo%2Fspaces%252F-MKZSsJBtSP9L4sqIe_q-887967055%252Fuploads%252FIJrbWEhvmjLdo1fq4ma0%252Fimage.png%3Falt%3Dmedia%26token%3Da55ee384-9704-4a77-a9d8-3c92e3c3e103&#x26;width=768&#x26;dpr=4&#x26;quality=100&#x26;sign=c03152b4&#x26;sv=1" alt=""><figcaption></figcaption></figure>

   What BLPAPI Logs to collect

   **Response Logging:** If activated, AgenaTrader will log API responses.

   **Request Logging:** If activated, AgenaTrader will log API requests.&#x20;

Both the main BLPAPI and the Request/Response files will be stored in your **AgenaTrader Data Directory -> Logs folder.**&#x20;

**Auto start “Bloomberg Terminal“ on connect:** If activated, Agenatrader will start Bloomberg Temnial automatically during the connection process.&#x20;

**Login Name (optional, not used for BLPAPI):** Please enter your Bloomberg terminal login. Required only if "Auto start “Bloomberg Terminal“ on connect" has been enabled.&#x20;

**Password (optional, not used for BLPAPI):** Please enter your Bloomberg terminal password. Required only if "Auto start “Bloomberg Terminal“ on connect" has been enabled.&#x20;

**Auto close “Bloomberg Terminal“ on disconnect:** If activated, Agenatrader will close the Bloomberg Temnial automatically during the disconnection process

<figure><img src="https://docs.agenatrader.com/~gitbook/image?url=https%3A%2F%2F2805764894-files.gitbook.io%2F%7E%2Ffiles%2Fv0%2Fb%2Fgitbook-x-prod.appspot.com%2Fo%2Fspaces%252F-MKZSsJBtSP9L4sqIe_q-887967055%252Fuploads%252FAX4W8wOli62JSr8pVaY0%252Fimage.png%3Falt%3Dmedia%26token%3D5f0de3fc-bf61-4d65-b88c-969cc2ded06d&#x26;width=768&#x26;dpr=4&#x26;quality=100&#x26;sign=e46c5494&#x26;sv=1" alt=""><figcaption></figcaption></figure>

Click on the **Finish** button to complete the connection setup process.

## FAQ

### Missing market data <a href="#missing-market-data" id="missing-market-data"></a>

Sometimes it can also occur that the charts in AgenaTrader do not tick, or do not show any market data (histories and current prices), or that the data is only loaded after a manual update.

### **Do I have the latest version?**

Make sure that you are using the most up-to-date AgenaTrader release. You should always have the latest version installed, since you are alerted to the update by a popup when you start up AgenaTrader, where you should also carry it out immediately. If for some reason, however, you are working with an older version for which there is already an update, you can tell by the little green icon next to the version number in the bottom right corner of your AgenaTrader window. By clicking on this, you start the update process. In addition, you can always download the most recent version or even update to the latest beta version from our website under Platform / Current version.

Important: beta versions are still under development - which means that you should keep in mind that you are using a product that is still in the test phase.

### **Have I connected AgenaTrader to the broker and data feed correctly?**

Our connection guides help you to establish connections; you can find them, among other places, in our AgenaSpace. For this, simply select the desired partners (broker and data feed). Watch these short videos very carefully at your own pace, since there are certain instructions and small setup tips (such as sychronizing all ports) to be followed and taken into account for each provider.

### **Do I have the right account settings?**

Your data feed must be selected as a data feed (DF), and in the Data feed tab, you need to set it to "all" or to the instrument types that you would like to see. You should also check whether you have subscribed to the data for the respective instrument with your provider.

<figure><img src="https://docs.agenatrader.com/~gitbook/image?url=https%3A%2F%2F2805764894-files.gitbook.io%2F%7E%2Ffiles%2Fv0%2Fb%2Fgitbook-legacy-files%2Fo%2Fassets%252F-MKZSsJBtSP9L4sqIe_q%252F-MQwPCScTa47vxWsw7R-%252F-MQwT8wJy2FL77jydhuH%252FKontoverbindungen.png%3Falt%3Dmedia%26token%3De98c7827-ba4e-46b5-9896-19578f478fa4&#x26;width=768&#x26;dpr=4&#x26;quality=100&#x26;sign=40a0566e&#x26;sv=1" alt=""><figcaption></figcaption></figure>

### **Have I imported the instrument lists and mappings?**

Under Tools -> Instrument Editor: Markets and Mappings, check that all mappings of the respective stock exchange have been imported to the data feed. The importing of instrument lists alone is not sufficient. In this Wiki article, you will find a detailed description for importing mappings and lists. When you search for your desired markets in the Instrument Editor, under Providers, you will see a Mapped Symbol for the desired data feed:

<figure><img src="https://docs.agenatrader.com/~gitbook/image?url=https%3A%2F%2F2805764894-files.gitbook.io%2F%7E%2Ffiles%2Fv0%2Fb%2Fgitbook-legacy-files%2Fo%2Fassets%252F-MKZSsJBtSP9L4sqIe_q%252F-MQwPCScTa47vxWsw7R-%252F-MQwTDas6WMssndOmOFS%252FInstrumentEscort.png%3Falt%3Dmedia%26token%3D3a8b10b3-4955-48c9-b1ab-a9e505b1e7c1&#x26;width=768&#x26;dpr=4&#x26;quality=100&#x26;sign=b9dd7772&#x26;sv=1" alt=""><figcaption></figcaption></figure>

### **Are the trading times set correctly?**

In the Instrument Editor, you can check whether you have set the trading times for the respective instrument correctly. In the Global Configuration, under History -> Marketplace Escort, you can check trading times, trading breaks and reversal times. We strongly recommend you to always keep these on the default settings!

### **Have I selected the right chart style?**

Check in the Chart Tool Bar (Timeframes -> Custom Parameters -> Periodicity) and in the Chart Selection (Custom Parameters -> Periodicity) whether a style has been set here (e.g.: Heikin Ashi) that is not applicable for this instrument or the data feed.

### **Have I subscribed to market data for the instrument (symbol)?**

Contact your broker or data feed and find out whether the data of the desired instruments (symbols/markets) is enabled for you. If you are only receiving delayed data, you will see red writing displaying "delayed data".

### **(Only for futures) Has the correct contract month been set?**

In the Instrument Editor, open the desired instrument using the search field in the top left, and change the Expiry box in the details tab accordingly.

Here you will find further information on the contracts.

<figure><img src="https://docs.agenatrader.com/~gitbook/image?url=https%3A%2F%2F2805764894-files.gitbook.io%2F%7E%2Ffiles%2Fv0%2Fb%2Fgitbook-legacy-files%2Fo%2Fassets%252F-MKZSsJBtSP9L4sqIe_q%252F-MQwPCScTa47vxWsw7R-%252F-MQwTfqu3szNnt5hul-5%252FAblaufFutures.png%3Falt%3Dmedia%26token%3Dc6d9bbd7-e9f1-48ea-8736-3e2f2534f4e6&#x26;width=768&#x26;dpr=4&#x26;quality=100&#x26;sign=640591a8&#x26;sv=1" alt=""><figcaption></figcaption></figure>


# Broker

{% hint style="info" %}
If you want to connect to a broker that operates using one of the following technology providers:

* **Gain Futures**
* **Interactive Brokers**
* **Rithmic**
* **MetaTrader 5**

Please navigate to the [**Technology Provider**](https://docs.agenatrader.com/main/broker-and-datafeeds-connections/technology-provider) section in the documentation. There, you'll find comprehensive details on how to set up and configure each connection, ensuring a smooth integration with AgenaTrader.
{% endhint %}

This section provides an overview of brokers directly supported by AgenaTrader that are not connected via the technology providers listed in the corresponding section. These brokers offer unique, standalone connections to AgenaTrader, allowing you to trade seamlessly without relying on third-party technology providers.

Each broker in this section has its own integration with AgenaTrader, enabling compatibility for account management, order execution, and, in most cases, market data. By working directly with these brokers, you can access tailored services and features that may better suit your specific trading needs.

Explore this section to find detailed information about the supported brokers and their offerings, helping you select the right broker for your trading activities.

## AMP <a href="#amp" id="amp"></a>

### **Brief overview of AMP**

AMP provides a direct access to all major global exchanges and exotic markets. AMP Global Clearing is a Chicago-based Futures Commission Merchant (FCM) providing access to the global electronic futures markets for Individual Traders.

**Supported asset classes:** Future

**Supported orders:**

OCO order connections are locally simulated ORO order connections are locally simulated IFDone order connections are locally simulated

**Order execution** AgenaTrader does not execute any orders! Instead, brokers simply inform us of filled orders and execution price. If data received from your data feed provider does not match the quotes on the brokerage platform for an instrument, then the entry and exit price will not be displayed properly on your chart.

You can open a real or demo account at AMP via our [Website](https://agenatrader.com/broker/).

### **Connecting**

Please follow the instructions in the following video to establish the connection correctly:

{% embed url="<https://youtu.be/izKx46qbU-Q>" %}

{% hint style="warning" %}
**Important Note**

THE BROKER'S PLATFORM ALWAYS REPRESENTS THE REFERENCE PLATFORM.

This means that the orders and market-related values shown on the BROKER platform are valid. The broker's platform should always be active as a backup to AgenaTrader. This gives you an essential overview of the interaction between AgenaTrader and your broker. Furthermore, you will always know exactly how your orders/positions and ultimately your&#x20;
{% endhint %}

## Dukascopy <a href="#dukascopy" id="dukascopy"></a>

### **Brief overview of Dukascopy**

Dukascopy is counted among the ECN (electronic communication network) brokers. These brokers provide the opportunity to move orders to the international trading floor, where traders can consequently receive the best offers from other brokers in real time. One of the important advantages of ECN brokers is that they are not market-makers, and therefore do not trade against their own clients.

**Supported asset classes:** CFD's, Currency

**Supported orders:** OCO order connections are locally simulated ORO order connections are locally simulated IFDone order connections are locally simulated

**Order execution** AgenaTrader does not execute any orders! Instead, brokers simply inform us of filled orders and execution price. If data received from your data feed provider does not match the quotes on the brokerage platform for an instrument, then the entry and exit price will not be displayed properly on your chart.

You can open a real or demo account at Dukascopy via our [website](https://agenatrader.com/broker/).

### **Connecting**

Please follow the instructions in the following video to establish the connection correctly:

{% embed url="<https://youtu.be/RJbITdWqGb0>" %}

**How to establish a connection to Dukascopy:**

Step 1. The first authentication popup will appear during the Dukascopy connection process. AgenaTrader uses this to connect to jForex API. Here, you need to enter your credentials and activate the PIN Code checkbox.

![](https://docs.agenatrader.com/~gitbook/image?url=https%3A%2F%2F2805764894-files.gitbook.io%2F%7E%2Ffiles%2Fv0%2Fb%2Fgitbook-legacy-files%2Fo%2Fassets%252F-MKZSsJBtSP9L4sqIe_q%252F-MPiSv8m6HiRuT_J32LT%252F-MPiUuNCyFxwjvEyQ0qg%252FDC%25201.png%3Falt%3Dmedia%26token%3D525acfef-948e-4e60-a278-0568e9de6e51\&width=768\&dpr=4\&quality=100\&sign=cede00b4\&sv=1)

Step 2. After entering your PIN Code the second authentication popup will appear. This popup provides a connection to the Dukascopy website, from which AgenaTrader gets historical executions. Please activate the PIN Code checkbox and enter your PIN as you did before, then click the Submit button.

<figure><img src="https://docs.agenatrader.com/~gitbook/image?url=https%3A%2F%2F2805764894-files.gitbook.io%2F%7E%2Ffiles%2Fv0%2Fb%2Fgitbook-legacy-files%2Fo%2Fassets%252F-MKZSsJBtSP9L4sqIe_q%252F-MPiSv8m6HiRuT_J32LT%252F-MPiUuNEN8d6Zcbp_OGq%252FDC%25202.png%3Falt%3Dmedia%26token%3D2bb67e45-e882-4788-80fc-4fcf053812d5&#x26;width=768&#x26;dpr=4&#x26;quality=100&#x26;sign=e174a537&#x26;sv=1" alt=""><figcaption></figcaption></figure>

### **Essential information**

In Account tab there are two additional columns: **Available Margin** (display Free Margin in Dukascopy client) and **Used Margin.**

<figure><img src="https://docs.agenatrader.com/~gitbook/image?url=https%3A%2F%2F2805764894-files.gitbook.io%2F%7E%2Ffiles%2Fv0%2Fb%2Fgitbook-legacy-files%2Fo%2Fassets%252F-MKZSsJBtSP9L4sqIe_q%252F-MPiSv8m6HiRuT_J32LT%252F-MPiUuNH8i_K5aS0eKKv%252FDukascopy.png%3Falt%3Dmedia%26token%3D9368c961-1ea6-458e-a138-b51a81a8fbb9&#x26;width=768&#x26;dpr=4&#x26;quality=100&#x26;sign=9e8c280d&#x26;sv=1" alt=""><figcaption></figcaption></figure>

**Important!**

If you have a DukasCopy account or request a new one, please make sure that the account type is "NonHedged". It is only with these settings that AgenaTrader can function flawlessly with DukasCopy.

Any client using Agena Trader is set to global mode. Global mode is net position mode, where any new trade is automatically merged into the existing position of the same instrument. CFD's must be added manually for clients that are in this mode and using Agena.

If your DukasCopy account has not yet been activated for CFDs, AgenaTrader can only load historical data, not real-time or delayed data.

In some cases, there might be problems with DukasCopy autostart.

There are three ways to solve it: 1. Check in Account Settings that checkbox Auto Start is active. 2. Deactivate Pin (Available only for live accounts) 3. If you have static IP please contact DukasCopy support team and they should not request pin when you connect with this IP.

{% hint style="warning" %}
**Important Note**

THE BROKER'S PLATFORM ALWAYS REPRESENTS THE REFERENCE PLATFORM.

This means that the orders and market-related values shown on the BROKER platform are valid. The broker's platform should always be active as a backup to AgenaTrader. This gives you an essential overview of the interaction between AgenaTrader and your broker. Furthermore, you will always know exactly how your orders/positions and ultimately your&#x20;
{% endhint %}

## FXCM <a href="#broker__fxcm__en" id="broker__fxcm__en"></a>

### **Brief overview of FXCM (Forex Capital Markets)**

FXCM is one of the most famous brokers in the world to provide services on the FOREX currency market. Since December 2010, FXCM has been listed on the New York stock exchange. FXCM enables access to the quotes of essential currency pairs, CFD prices on shares and indices and also to such commodities as oil, gold, and silver etc. Trading on the FOREX market can take place at any time, since it is open 24 hours a day (excluding weekends). The goal of FXCM is to use the most advanced technologies and assure the best client support.

**Supported asset classes:** Currency, CFD's

**Supported orders:** OCO order connections supported by this broker ORO order connections are locally simulated IFDone order connections are locally simulated

**Order execution** AgenaTrader does not execute any orders! Instead, brokers simply inform us of filled orders and execution price. If data received from your data feed provider does not match the quotes on the brokerage platform for an instrument, then the entry and exit price will not be displayed properly on your chart.

You can open a real or demo account at the FXCM via our [website](https://agenatrader.com/broker/).

### **Connecting**

Please follow the instructions in the following video to establish the connection correctly:

{% embed url="<https://youtu.be/mYsM0MU2-J0>" %}

{% hint style="warning" %}
I**mportant!** User has no need to fullfil Login URL input anymore.
{% endhint %}

### **Essential information**

FXCM provides volumes for historical ticks for the following symbols only: EUR/USD, USD/JPY, GBP/USD, EUR/JPY, AUD/USD, GBP/JPY, USD/CAD, AUD/JPY, USD/CHF, EUR/CHF, NZD/USD, EUR/AUD, EUR/GBP and EUR/CAD.

Please note the following:

1. If you have an FXCM account or request a new one, please make sure that the account type is "Non Hedged".
2. The limitation of 20 parallel real-time feeds must be changed to "unlimited".
3. Please make sure that in FXCM trading station all instruments were activatd and a activate missing ones, if neccessary.

It is only with these settings that AgenaTrader can function flawlessly with FXCM.

{% hint style="info" %}
**Important.** AgenaTrader does not support hedged accounts. Non-hedged accounts are supported by FXCM Trading Station.

MT4 does not support non-hedged accounts. Please do not activate MT4 as trading platform when opening a FXCM account.
{% endhint %}

**FOREX**

The minimum order size and the smallest possible step is 1000.

### **Data-Feed - loading of histories and real-time data**

If the loading of histories (charts) takes too long or the charts stay empty after the loading has finished, then the FXCM server returned a timeout. This means that too many instruments with a too big amount of histories were requested. To solve the problem reduce the number of instruments from your workspace or the amount of history (candles) loaded in the charts. Read more about chart and history settings [here.](https://agenatrader.com/wiki/tiki-index.php?page=Time%20frame\&structure=Trading%20Software%20AgenaTrader%20\(en\))

**Minimum tick distance**

AT++ plusplus entries: Please read about [Synthetic orders on MinTickDistance](https://docs.agenatrader.com/create-your-own-trading-strategy/at-plusplus-manager#at-plus-plus-entries) for more information. AT++ plusplus stops: Please read about [Synthetic orders on MinTickDistance](https://docs.agenatrader.com/create-your-own-trading-strategy/at-plusplus-manager#at-plus-plus-stops) for more information.

**Mini account**

AT doesn't support trading with mini account. If user try to trade with Mini account he will receive such message in log:

*" Your account type "mini account" is not supported. In order to trade with AgenaTrader a standard account is necessary. Please contact your broker."*

**Order size comparison** Order size in AgenaTrader and FXCM station differs for some symbols:

| Instruments       | AT     | FXCM Station | Divided | Minimum Order Size |
| ----------------- | ------ | ------------ | ------- | ------------------ |
| **Forex:**        |        |              |         |                    |
| AUDUSD            | 10000  | 10           | 1000    | 1000               |
| EURUSD            | 55000  | 55           | 1000    | 1000               |
| GBPUSD            | 30000  | 30           | 1000    | 1000               |
| GBPJPY            | 40000  | 40           | 1000    | 1000               |
| EURNZD            | 102000 | 102          | 1000    | 1000               |
| EURJPY            | 80000  | 80           | 1000    | 1000               |
| GBPCHF            | 5000   | 5            | 1000    | 1000               |
| NZDJPY            | 2000   | 2            | 1000    | 1000               |
| NZDUSD            | 1000   | 1            | 1000    | 1000               |
| **CFD:**          |        |              |         |                    |
| AUS200-FXCM.CFD   | 10     | 10           |         | 1                  |
| BUND-FXCM.CFD     | 50     | 50           |         | 1                  |
| ESP35-FXCM.CFD    | 20     | 20           |         | 1                  |
| EUSTX50-FXCM.CFD  | 5      | 5            |         | 1                  |
| FRA40-FXCM.CFD    | 70     | 70           |         | 1                  |
| GER30-FXCM.CFD    | 20     | 20           |         | 1                  |
| HKG33-FXCM.CFD    | 10     | 10           |         | 1                  |
| JPN225-FXCM.CFD   | 100    | 100          |         | 1                  |
| KUPFER-FXCM.CFD   | 20     | 20           |         | 10                 |
| NAS100-FXCM.CFD   | 80     | 80           |         | 1                  |
| NGAS-FXCM.CFD     | 40     | 40           |         | 1                  |
| SPX500-FXCM.CFD   | 20     | 20           |         | 1                  |
| UK100-FXCM.CFD    | 30     | 30           |         | 1                  |
| UKOIL-FXCM.CFD    | 70     | 70           |         | 1                  |
| US30-FXCM.CFD     | 60     | 60           |         | 1                  |
| USDOLLAR-FXCM.CFD | 30     | 30           |         | 1                  |
| USOIL-FXCM.CFD    | 50     | 50           |         | 1                  |
| XAG/USD-FXCM.CFD  | 100    | 100          |         | 50                 |
| XAU/USD-FXCM.CFD  | 60     | 60           |         | 1                  |

**Important.** FXCM's platform shows values always in accounts currency (regardless of instruments). Under PnL we show FXCM's BRUTO PnL

{% hint style="info" %}
**Important Note**

THE BROKER'S PLATFORM ALWAYS REPRESENTS THE REFERENCE PLATFORM.

This means that the orders and market-related values shown on the BROKER platform are valid. The broker's platform should always be active as a backup to AgenaTrader. This gives you an essential overview of the interaction between AgenaTrader and your broker. Furthermore, you will always know exactly how your orders/positions and ultimately your account balance are displayed.
{% endhint %}

{% hint style="info" %}
**Warning!** This does not work with the desktop MB trading platform.
{% endhint %}


# Set Up Your Workspace

One of our ambitious goals in the development of AgenaTrader is to provide you, the trader, with an ergonomic workspace.

Another top priority of ours is also to enable users to trade professionally with a variety of instruments using as little space as possible. In order to fulfill these objectives, AgenaTrader displays as much information as possible in as little space as necessary, making this information available with just a couple of mouse clicks.

Example of a workspace with only one monitor:

<figure><img src="https://docs.agenatrader.com/~gitbook/image?url=https%3A%2F%2F2805764894-files.gitbook.io%2F%7E%2Ffiles%2Fv0%2Fb%2Fgitbook-legacy-files%2Fo%2Fassets%252F-MKZSsJBtSP9L4sqIe_q%252F-MPinJIpmc2clAcUejgw%252F-MPirUd-fBEZl4qbCKcZ%252Fworkspace1.png%3Falt%3Dmedia%26token%3Dc41b37ed-8919-404c-a0a8-c18ab6bb10a1&#x26;width=768&#x26;dpr=4&#x26;quality=100&#x26;sign=cd3c5d9a&#x26;sv=1" alt=""><figcaption></figcaption></figure>

We have abandoned the concept of floating windows, which can be easily lost and misplaced within the task bar.

Our solution to this is the docking tab technology. This technology offers various functionalities such as organization and grouping of lists, charts and tools within a tab and the ability to position these "information containers" flexibly within the workspace using drag & drop.

<figure><img src="https://docs.agenatrader.com/~gitbook/image?url=https%3A%2F%2F2805764894-files.gitbook.io%2F%7E%2Ffiles%2Fv0%2Fb%2Fgitbook-legacy-files%2Fo%2Fassets%252F-MKZSsJBtSP9L4sqIe_q%252F-MPinJIpmc2clAcUejgw%252F-MPirUczFT7THmZy5uSG%252FDocking.jpg%3Falt%3Dmedia%26token%3Dcb17c366-a21e-41fa-9257-89b314b03f00&#x26;width=768&#x26;dpr=4&#x26;quality=100&#x26;sign=a4abb33b&#x26;sv=1" alt=""><figcaption></figcaption></figure>

## <img src="/files/kPHNoG61TYuQEZbLIP3L" alt="" data-size="line"> Workspace menu

You can manage as many workspaces as you wish in AgenaTrader. You can switch between any of the available workspaces just by clicking on them.

Simply start off with one of the ready-made workspaces in order to get a feeling for how to use the Docking tab technology.

<figure><img src="https://docs.agenatrader.com/~gitbook/image?url=https%3A%2F%2F2805764894-files.gitbook.io%2F%7E%2Ffiles%2Fv0%2Fb%2Fgitbook-legacy-files%2Fo%2Fassets%252F-MKZSsJBtSP9L4sqIe_q%252F-MQC3l0dmZCpivZIGAO3%252F-MQC4HC37DRTbB-6R2qs%252FWorkspace.png%3Falt%3Dmedia%26token%3D708efd92-e1ed-4d53-8e98-b77572bca200&#x26;width=768&#x26;dpr=4&#x26;quality=100&#x26;sign=3f6156b0&#x26;sv=1" alt=""><figcaption></figcaption></figure>

For each new workspace, you may create or add to existing Category. This is made for more convenient navigation through the workspaces.

<figure><img src="https://docs.agenatrader.com/~gitbook/image?url=https%3A%2F%2F2805764894-files.gitbook.io%2F%7E%2Ffiles%2Fv0%2Fb%2Fgitbook-legacy-files%2Fo%2Fassets%252F-MKZSsJBtSP9L4sqIe_q%252F-MQC3l0dmZCpivZIGAO3%252F-MQC4KomN4EJJvrE5PeC%252FCategory.png%3Falt%3Dmedia%26token%3Dea264423-b9fe-43bb-a35d-4c8faac03e2d&#x26;width=768&#x26;dpr=4&#x26;quality=100&#x26;sign=a7830c5a&#x26;sv=1" alt=""><figcaption></figcaption></figure>

| Option          | Meaning                                                                                                                 |
| --------------- | ----------------------------------------------------------------------------------------------------------------------- |
| Save            | Saves the current workspace, or opens a popup for entering the name and location for a new workspace, if not yet saved. |
| Save as         | Allows you to create a copy of an existing workspace under a different name.                                            |
| New             | Opens a blank workspace.                                                                                                |
| Remove          | Deletes a workspace                                                                                                     |
| Import from URL | Allows to import a workspace with a provided link (Link provider could be some trading mentor or Agena team).           |

A notification will appear in the **protocol tab** once the workspace has been saved.

The workspace will be stored by default in the "Documents" folder in the user directory AgenaTrader/Workspaces.

<figure><img src="https://docs.agenatrader.com/~gitbook/image?url=https%3A%2F%2F2805764894-files.gitbook.io%2F%7E%2Ffiles%2Fv0%2Fb%2Fgitbook-legacy-files%2Fo%2Fassets%252F-MKZSsJBtSP9L4sqIe_q%252F-MQC3l0dmZCpivZIGAO3%252F-MQC4PmsC2NtJA7a5iLg%252FWorkspace%2520%281%29.png%3Falt%3Dmedia%26token%3D2e0d0f48-13e9-45c4-be4b-66c7d5085901&#x26;width=768&#x26;dpr=4&#x26;quality=100&#x26;sign=dbce3a48&#x26;sv=1" alt=""><figcaption></figcaption></figure>

A notification will appear in the **protocol tab** once the workspace has been saved.

| Option          | Meaning                                                                                                                 |
| --------------- | ----------------------------------------------------------------------------------------------------------------------- |
| Save            | Saves the current workspace, or opens a popup for entering the name and location for a new workspace, if not yet saved. |
| Save as         | Allows you to create a copy of an existing workspace under a different name.                                            |
| New             | Opens a blank workspace.                                                                                                |
| Remove          | Deletes a workspace                                                                                                     |
| Import from URL | Allows to import a workspace with a provided link (Link provider could be some trading mentor or Agena team).           |

The workspace will be stored by default in the "Documents" folder in the user directory AgenaTrader/Workspaces.

<figure><img src="https://docs.agenatrader.com/~gitbook/image?url=https%3A%2F%2F2805764894-files.gitbook.io%2F%7E%2Ffiles%2Fv0%2Fb%2Fgitbook-legacy-files%2Fo%2Fassets%252F-MKZSsJBtSP9L4sqIe_q%252F-MQC3l0dmZCpivZIGAO3%252F-MQC4TbVc8B5YTuQ0z1O%252FWorkspace%2520%282%29.png%3Falt%3Dmedia%26token%3Dd0fb438e-2375-4554-bf05-1a03d492a865&#x26;width=768&#x26;dpr=4&#x26;quality=100&#x26;sign=28ce9491&#x26;sv=1" alt=""><figcaption></figcaption></figure>

### Docking tabs <a href="#docking-tabs" id="docking-tabs"></a>

*The technology of docking tabs assumes:*

1. The possibility to place and/or group the tabs manually on the screen and categorize anchors logically. For example, you can bring together all positions/trading/executions lists in one control center.
2. Other tabs such as News/Protocol/Strategy Escort etc. can be assembled to form an info center if required.
3. Charts and chart containers can be placed within an appropriate charting space.

<figure><img src="https://docs.agenatrader.com/~gitbook/image?url=https%3A%2F%2F2805764894-files.gitbook.io%2F%7E%2Ffiles%2Fv0%2Fb%2Fgitbook-legacy-files%2Fo%2Fassets%252F-MKZSsJBtSP9L4sqIe_q%252F-MPinJIpmc2clAcUejgw%252F-MPirUcvINwblLAtp95M%252Fdocking%2520tabs.png%3Falt%3Dmedia%26token%3D50a91ea5-15a0-432e-ae3f-44b3031f6c6a&#x26;width=768&#x26;dpr=4&#x26;quality=100&#x26;sign=45caee92&#x26;sv=1" alt=""><figcaption></figcaption></figure>

The AgenaTrader workspace design and grouping is highly flexible, and can be customized to adapt the layout to suit your needs:

* If you drag a tab (by clicking and holding the left mouse button), the docking buttons will become visible. Now you can release the tab over one of these buttons and it will be placed accordingly.
* Alternatively, you can distribute them manually as you wish across multiple monitors (6-8).
* Using the same drag and drop method you can also change the order of tabs within a group.

<figure><img src="https://docs.agenatrader.com/~gitbook/image?url=https%3A%2F%2F2805764894-files.gitbook.io%2F%7E%2Ffiles%2Fv0%2Fb%2Fgitbook-legacy-files%2Fo%2Fassets%252F-MKZSsJBtSP9L4sqIe_q%252F-MPinJIpmc2clAcUejgw%252F-MPirUcwvidyvygVq2BX%252Fdocking%2520tabs1.png%3Falt%3Dmedia%26token%3D0d0c1002-c033-4d8d-9212-20e207f7a571&#x26;width=768&#x26;dpr=4&#x26;quality=100&#x26;sign=8976ec2f&#x26;sv=1" alt=""><figcaption></figcaption></figure>

#### Detaching a tab when using a multi-display system <a href="#detaching-a-tab-when-using-a-multi-display-system" id="detaching-a-tab-when-using-a-multi-display-system"></a>

1\. A right click on the tab will open the following contextualized menu:

<figure><img src="https://docs.agenatrader.com/~gitbook/image?url=https%3A%2F%2F2805764894-files.gitbook.io%2F%7E%2Ffiles%2Fv0%2Fb%2Fgitbook-legacy-files%2Fo%2Fassets%252F-MKZSsJBtSP9L4sqIe_q%252F-MPinJIpmc2clAcUejgw%252F-MPirUcxN6z0bnwMhsfL%252Fdocking%2520tabs2.png%3Falt%3Dmedia%26token%3D8b797951-b0a2-4fa6-b785-aab5ef128457&#x26;width=768&#x26;dpr=4&#x26;quality=100&#x26;sign=23ffae86&#x26;sv=1" alt=""><figcaption></figcaption></figure>

2\. Select the **Detach** menu item to move the tab to a different display.

<figure><img src="https://docs.agenatrader.com/~gitbook/image?url=https%3A%2F%2F2805764894-files.gitbook.io%2F%7E%2Ffiles%2Fv0%2Fb%2Fgitbook-legacy-files%2Fo%2Fassets%252F-MKZSsJBtSP9L4sqIe_q%252F-MPinJIpmc2clAcUejgw%252F-MPirUctMqHbh-Folifc%252FDocking%2520%281%29.jpg%3Falt%3Dmedia%26token%3D036b9b6a-d3e0-4696-867a-c9f8672c157d&#x26;width=768&#x26;dpr=4&#x26;quality=100&#x26;sign=af34bf8d&#x26;sv=1" alt=""><figcaption></figcaption></figure>

3\. To reattach the tab, right click on it and select the **Attach** option from the context menu.

<figure><img src="https://docs.agenatrader.com/~gitbook/image?url=https%3A%2F%2F2805764894-files.gitbook.io%2F%7E%2Ffiles%2Fv0%2Fb%2Fgitbook-legacy-files%2Fo%2Fassets%252F-MKZSsJBtSP9L4sqIe_q%252F-MPinJIpmc2clAcUejgw%252F-MPirUcyeKwYBrgap-CG%252Fdocking%2520tabs4.png%3Falt%3Dmedia%26token%3D92ac43de-d346-4a2b-99b9-75ba5e788806&#x26;width=768&#x26;dpr=4&#x26;quality=100&#x26;sign=1d63b298&#x26;sv=1" alt=""><figcaption></figcaption></figure>

4\. To add a further tab to a detached tab, right mouse click on the tab to be attached and select the **Attach to** option.

<figure><img src="https://docs.agenatrader.com/~gitbook/image?url=https%3A%2F%2F2805764894-files.gitbook.io%2F%7E%2Ffiles%2Fv0%2Fb%2Fgitbook-legacy-files%2Fo%2Fassets%252F-MKZSsJBtSP9L4sqIe_q%252F-MPinJIpmc2clAcUejgw%252F-MPirUd0bobpVcXy1hbL%252Fdocking%2520tabs5.png%3Falt%3Dmedia%26token%3Daec330ca-76de-40bd-bdf4-bfb3c850ec98&#x26;width=768&#x26;dpr=4&#x26;quality=100&#x26;sign=6f816955&#x26;sv=1" alt=""><figcaption></figcaption></figure>

5\. If you want to move a detached tab back to the main window (or to a different window) use the **Attach to** option in the context menu again. The selected window will display the background color as slightly transparent during this process to clarify the user's choice.

Select the **Rename** option to change the name of an existing tab and the **Close** option to close the tab.

**Potential issues may arise when working with multiple PCs and Dropbox.**

If you save your AgenaTrader data in Dropbox in order to use the same settings on different PCs, then you may face problems involving disappearing windows due to the difference in display settings of your monitors. To avoid this issue, save your AgenaTrader workspace without detached windows. You can detach them once more after loading the configurations.

### Data feed histories <a href="#workspace__data_feed_histories" id="workspace__data_feed_histories"></a>

#### Loading histories <a href="#loading_histories" id="loading_histories"></a>

AgenaTrader loads historical prices for active instruments from the data feed provider's server. Sometimes the system may need some time to proceed. If this is the case, you can check the progress of the data download at the bottom right of your screen. The progress bar indicates the current state and quantity of bars requested. Please note that as long as this bar remains yellow, you may see only empty charts.

<figure><img src="https://docs.agenatrader.com/~gitbook/image?url=https%3A%2F%2F2805764894-files.gitbook.io%2F%7E%2Ffiles%2Fv0%2Fb%2Fgitbook-legacy-files%2Fo%2Fassets%252F-MKZSsJBtSP9L4sqIe_q%252F-MPisC4L5s2CsJagKeQD%252F-MPisYywaBZU7DGg29Yb%252Fbars%2520history.png%3Falt%3Dmedia%26token%3D67616b54-9f91-4104-b8b6-3b51272ba116&#x26;width=768&#x26;dpr=4&#x26;quality=100&#x26;sign=e7f8dac5&#x26;sv=1" alt=""><figcaption></figcaption></figure>

*Historical data are necessary when using the following tools:*

* Chart
  * [Chart Container: Single Chart](https://docs.agenatrader.com/main/chart-area/chart-container/chart-container#single-chart)
  * [Chart Container: Single Chart Group](https://docs.agenatrader.com/main/chart-area/chart-container/chart-container#single-chart-group)
  * [Chart Container: List Chart Group](https://docs.agenatrader.com/main/chart-area/chart-container/chart-container#Chart_Container__List_Chart_Group)(LCG)
  * [Chart Container: Tab Chart Group](https://docs.agenatrader.com/main/chart-area/chart-container/chart-container#Chart_Container__Tab_Chart_Group)(TCG)
* [Indicators in the scanner](https://docs.agenatrader.com/main/chart-area/realtime-scanner) ("bars required" for loading)
* [Indicators in the chart](https://docs.agenatrader.com/main/chart-area/untitled/indicators) ("bars required" for evaluation)
* [Strategies in the Strategy Escort](https://docs.agenatrader.com/create-your-own-trading-strategy/strategy-escort) ("bars required" for loading)
* [Strategies in the chart](https://docs.agenatrader.com/create-your-own-trading-strategy/scripting#Scripting__Programming_of_strategies) ("bars required" for evaluation)

### History Overflow <a href="#history_overflow" id="history_overflow"></a>

This problem may in fact occur with most data feeds.

The Interactive Brokers data feed may cause significant problems. IB only permits 60 historical queries within 10 minutes. This means that if you have a List Chart Group with 20 instruments and 3 time frames per instrument, the amount of queries is already exhausted. If you then change the time frame of a chart after the limit has been reached, the chart remains empty since Interactive Brokers will no longer deliver historical data.

Barchart offers historical packages with 100, 200 and 500 requests – but a package of 100 queries is also quickly exhausted.

It should be noted that every data feed has its own limitations. Once you have exceeded the maximum number of history requests with IB you must wait 10 minutes to load new histories. Barchart, on the other hand, may require up to one hour to load new historical prices.

<figure><img src="https://docs.agenatrader.com/~gitbook/image?url=https%3A%2F%2F2805764894-files.gitbook.io%2F%7E%2Ffiles%2Fv0%2Fb%2Fgitbook-legacy-files%2Fo%2Fassets%252F-MKZSsJBtSP9L4sqIe_q%252F-MPisC4L5s2CsJagKeQD%252F-MPisYyyuxMyBwgQ7jOA%252Fhistories2.png%3Falt%3Dmedia%26token%3D41ef6330-11c5-4ec0-9275-1668cd324e81&#x26;width=768&#x26;dpr=4&#x26;quality=100&#x26;sign=91487af0&#x26;sv=1" alt=""><figcaption></figcaption></figure>

### Status Indicators <a href="#status-indicators" id="status-indicators"></a>

On the bottom of AgenaTrader main workspace, you can see the status indicators.

They are displaying System, Internet traffic (ping), Cpu usage and DataFeed (Broker) connection status.

Colors of indicators :

* **Green:** System and connection are good
* **Yellow:** There are some problems with system and connection (ping is higher than usual), loading of charts takes longer. Please check if there are any error messages in the log and try to fix issue.
* **Red:** Serious problems with system and connections (ping is very high). Please check if there are any error messages in the log and try to fix it

<figure><img src="https://docs.agenatrader.com/~gitbook/image?url=https%3A%2F%2F2805764894-files.gitbook.io%2F%7E%2Ffiles%2Fv0%2Fb%2Fgitbook-legacy-files%2Fo%2Fassets%252F-MKZSsJBtSP9L4sqIe_q%252F-MPisC4L5s2CsJagKeQD%252F-MPisYz-0qFli3fYbwQt%252FStatus_Indicators.png%3Falt%3Dmedia%26token%3Db2b209e4-3ffd-43d5-8e54-8385066d7e3c&#x26;width=768&#x26;dpr=4&#x26;quality=100&#x26;sign=184b671a&#x26;sv=1" alt=""><figcaption></figcaption></figure>

### Application toolbar <a href="#application-toolbar" id="application-toolbar"></a>

Aside from using the [**MAIN - MENU**](https://docs.agenatrader.com/main/main-menu), [**TOOLS - MENU**](https://docs.agenatrader.com/tools/tools), [**CREATE YOUR OWN TRADING STRATEGY**](https://docs.agenatrader.com/create-your-own-trading-strategy/semi-automated-trading) and **FLATTEN** menus, the basic and most important functionalities of AgenaTrader can be accessed with the space-friendly application toolbar

<figure><img src="https://docs.agenatrader.com/~gitbook/image?url=https%3A%2F%2F2805764894-files.gitbook.io%2F%7E%2Ffiles%2Fv0%2Fb%2Fgitbook-legacy-files%2Fo%2Fassets%252F-MKZSsJBtSP9L4sqIe_q%252F-MPisC4L5s2CsJagKeQD%252F-MPisYz0Q5qG9G6Sk3YU%252FToolbar.png%3Falt%3Dmedia%26token%3D31dcc8b1-7992-44d2-b2bd-44d42403f07e&#x26;width=768&#x26;dpr=4&#x26;quality=100&#x26;sign=df5c9cb0&#x26;sv=1" alt=""><figcaption></figcaption></figure>

On the Top left of the main window, the user may find search toolbar. It allows you to search information through the Online Help in a quick way. Just type the exact term, as used in the software and click the search <img src="/files/7BmctVTbVYJkddzsu5lC" alt="" data-size="line"> button

<figure><img src="https://docs.agenatrader.com/~gitbook/image?url=https%3A%2F%2F2805764894-files.gitbook.io%2F%7E%2Ffiles%2Fv0%2Fb%2Fgitbook-legacy-files%2Fo%2Fassets%252F-MKZSsJBtSP9L4sqIe_q%252F-MPisC4L5s2CsJagKeQD%252F-MPisuqF37bmYfbYzqZm%252FSearch%2520area.jpg%3Falt%3Dmedia%26token%3D6d5791e5-0519-495d-8cb9-d05b673f10be&#x26;width=768&#x26;dpr=4&#x26;quality=100&#x26;sign=9f335bd&#x26;sv=1" alt=""><figcaption></figcaption></figure>

The application toolbar can be shifted to all four edges of your display or unpinned from the edges completely and moved to wherever needed

<figure><img src="https://docs.agenatrader.com/~gitbook/image?url=https%3A%2F%2F2805764894-files.gitbook.io%2F%7E%2Ffiles%2Fv0%2Fb%2Fgitbook-legacy-files%2Fo%2Fassets%252F-MKZSsJBtSP9L4sqIe_q%252F-MPisC4L5s2CsJagKeQD%252F-MPisYyzePV1XJrG1xdb%252FManu%2520Toolbar.png%3Falt%3Dmedia%26token%3D3115b061-4ede-4451-8995-6e00c41c8aef&#x26;width=768&#x26;dpr=4&#x26;quality=100&#x26;sign=e9596379&#x26;sv=1" alt=""><figcaption></figcaption></figure>

{% hint style="info" %}
**Important tip regarding an unpinned menu bar**: when AgenaTrader is restarted the bar will appear in the place where your cursor is currently located.
{% endhint %}

Select the **Add/Remove Commands** menu item to choose which symbols are displayed in the application toolbar. If the menu bar is compressed due to a reduction in window size, you can display the obscured symbols by clicking the **Hidden Commands** button

<figure><img src="https://docs.agenatrader.com/~gitbook/image?url=https%3A%2F%2F2805764894-files.gitbook.io%2F%7E%2Ffiles%2Fv0%2Fb%2Fgitbook-legacy-files%2Fo%2Fassets%252F-MKZSsJBtSP9L4sqIe_q%252F-MPisC4L5s2CsJagKeQD%252F-MPisYz1P1bB04QEFAh8%252FApplication%2520toolbar2.PNG%3Falt%3Dmedia%26token%3D6b3354e0-abb2-41c3-826d-dd6850cc2afc&#x26;width=768&#x26;dpr=4&#x26;quality=100&#x26;sign=790e5b07&#x26;sv=1" alt=""><figcaption></figcaption></figure>

The **Customize** button is currently not activated.

## Flatten

By clicking on Flatten -> all all running positions and open orders will be closed.

<figure><img src="https://docs.agenatrader.com/~gitbook/image?url=https%3A%2F%2F1347375179-files.gitbook.io%2F%7E%2Ffiles%2Fv0%2Fb%2Fgitbook-legacy-files%2Fo%2Fassets%252F-MKZSsJBtSP9L4sqIe_q%252F-MPdGVdakovIBe-xwvur%252F-MPdICijAg992f5eGBMK%252FFlatten.png%3Falt%3Dmedia%26token%3D94fedff3-f552-47a2-8b5f-8e908b44c523&#x26;width=768&#x26;dpr=4&#x26;quality=100&#x26;sign=3b4648fe&#x26;sv=1" alt=""><figcaption></figcaption></figure>

<br>


# Chart Area


# Charting

&#x20;*AgenaTrader's innovative chart container concept enables you to:*

* display a [single chart](https://docs.agenatrader.com/main/chart-area/chart-container/chart-container#single-chart) in one tab
* display multiple charts of the same specified instrument in a charting area as:
  * [Single Chart Groups](https://docs.agenatrader.com/main/chart-area/chart-container/chart-container#single-chart-group)
  * [List Chart Groups](https://docs.agenatrader.com/main/chart-area/chart-container/chart-container#Chart_Container__List_Chart_Group) (LCG)
  * [Tab Chart Groups](https://docs.agenatrader.com/main/chart-area/chart-container/chart-container#Chart_Container__Tab_Chart_Group) (TCG)

<figure><img src="/files/A7PWnwfYXC1iTfaUYSnu" alt=""><figcaption></figcaption></figure>

## Navigating a chart

You can navigate within the chart using:

**mouse** or **keyboard.**

On the bottom left of chart you may see status Indicators:

<img src="https://docs.agenatrader.com/~gitbook/image?url=https%3A%2F%2F2805764894-files.gitbook.io%2F%7E%2Ffiles%2Fv0%2Fb%2Fgitbook-legacy-files%2Fo%2Fassets%252F-MKZSsJBtSP9L4sqIe_q%252F-MPitS9BSauRKmMOB8-x%252F-MPittEB0dahWq2UP54X%252Fdemo.png%3Falt%3Dmedia%26token%3Dfa8dc2f0-2c30-4dd3-86d5-d5a6c3b13455&#x26;width=300&#x26;dpr=4&#x26;quality=100&#x26;sign=11ec78ad&#x26;sv=1" alt="Demo" data-size="original"> Demo Account Broker connected

![Real](https://docs.agenatrader.com/~gitbook/image?url=https%3A%2F%2F2805764894-files.gitbook.io%2F%7E%2Ffiles%2Fv0%2Fb%2Fgitbook-legacy-files%2Fo%2Fassets%252F-MKZSsJBtSP9L4sqIe_q%252F-MPitS9BSauRKmMOB8-x%252F-MPittECoDMYQ87wVk3Q%252Freal.png%3Falt%3Dmedia%26token%3Ddfecd071-acbb-43eb-b4e0-9f823bc54301\&width=300\&dpr=4\&quality=100\&sign=9181b572\&sv=1) Real Account Broker connected

![Simulation](https://docs.agenatrader.com/~gitbook/image?url=https%3A%2F%2F2805764894-files.gitbook.io%2F%7E%2Ffiles%2Fv0%2Fb%2Fgitbook-legacy-files%2Fo%2Fassets%252F-MKZSsJBtSP9L4sqIe_q%252F-MPitS9BSauRKmMOB8-x%252F-MPittEDiWHiElM7h-wW%252Fsimulation.png%3Falt%3Dmedia%26token%3Df4319a06-b4b0-4c4a-a331-5b948559af6b\&width=300\&dpr=4\&quality=100\&sign=c0bcacad\&sv=1) Simulated Account Broker connected

![Delayed](https://docs.agenatrader.com/~gitbook/image?url=https%3A%2F%2F2805764894-files.gitbook.io%2F%7E%2Ffiles%2Fv0%2Fb%2Fgitbook-legacy-files%2Fo%2Fassets%252F-MKZSsJBtSP9L4sqIe_q%252F-MPitS9BSauRKmMOB8-x%252F-MPittEAM-hY_UIDityx%252FDelayed.png%3Falt%3Dmedia%26token%3Da0d7db5b-352c-4ac2-be52-4071f32f1958\&width=300\&dpr=4\&quality=100\&sign=5b97849c\&sv=1) Delayed Data Datafeed connected (Depending on your data feed provider you may receive delayed data. Typical time lags are 10-20 min.)

<img src="/files/zFoeqcOA68JOLsGM3uOB" alt="" data-size="original">RealTime Data Datafeed connected

![](/files/BYSb3zBLRhCDn9be8M6D) account

### Mouse <a href="#mouse" id="mouse"></a>

This section covers the mouse functionalities when using AgenaTrader.

#### Double-clicking an indicator or drawing object <a href="#double-clicking-an-indicator-or-drawing-object" id="double-clicking-an-indicator-or-drawing-object"></a>

By double-clicking an indicator, an indicator panel or a drawing object, you will open the associated parameter dialog window. If you double-click on an indicator then it will be automatically selected within the indicator list dialog

<figure><img src="/files/A9knHwAlnNbnflSwLtpF" alt=""><figcaption></figcaption></figure>

#### Clicking in the charting area <a href="#clicking-in-the-charting-area" id="clicking-in-the-charting-area"></a>

Left click in the charting area to open the data box

<figure><img src="/files/GKlg4dFQFiKv5KJXbLK3" alt=""><figcaption></figcaption></figure>

According to the current position of the cursor on the chart, the data box displays the following information concerning the price period (candles, etc.):

* Date & Time
* Opening price
* High
* Low
* Closing price
* Volume
* Additionally, the values of all indicators currently displayed on the chart.

#### Time scale <a href="#time-scale" id="time-scale"></a>

Depending on the specified time interval, the horizontal time scale includes time markers for a chart. Intraday charts display day/period breaks as date + time, whereas all other time markers are represented in the "HH:MM" or "HH:MM:SS" format.

If the cross-hair pointer is enabled, the current date/time will be highlighted in color

<figure><img src="/files/wohECk7F7eNdfNbUiNdS" alt=""><figcaption></figcaption></figure>

Click and hold the **left mouse button** in the time scale area to move the chart to the left or right. Click and hold the **right mouse button** in the time scale area to zoom in or zoom out on the chart horizontally.

The arrow located in the upper right corner of the chart indicates that part of it has been shifted or hidden. In other words, the currently displayed position is not the original position of the chart

<figure><img src="/files/lg8OOvwm0V9VDf2q7ESh" alt=""><figcaption></figcaption></figure>

To revert the chart to its original position, double-click on the time scale or left click on the arrow.

#### Price scale <a href="#price-scale" id="price-scale"></a>

The vertical price scale contains various prices and price markers for different chart objects such as:

* Current market price
* Indicator values
* Values of horizontal lines etc

<div align="left"><figure><img src="/files/rcOxykElFWlU8BpsU8Lb" alt=""><figcaption></figcaption></figure></div>

Click and hold the **left mouse button** in the price scale area to move the chart up and down. Click and hold the **right mouse button** in the price scale area to zoom in or zoom out on the chart horizontally.

To revert the chart to its original position, double-click on the time scale or left click on one of the <img src="/files/ocj2HiwbABIjDkuO8r7n" alt="" data-size="line"> pins&#x20;

<div align="left"><figure><img src="/files/1d7JWCdG693qg9IN7vmL" alt=""><figcaption></figcaption></figure></div>

**Auto scale after modifying the chart**

If pins are visible on the chart, this means that the auto scale mode for the chart is disabled (the chart will not align itself automatically). Once a new candlestick has occurred and is displayed outside of the viewing pane (below or above) then the pin icon will turn red. This indicates that the current candle is not within the visible part of the chart space. Clicking the pin will activate the auto scale mode and re-align the chart properly

<figure><img src="/files/KFHycYwHQrpMINCNYMgA" alt=""><figcaption></figcaption></figure>

#### Mouse wheel <a href="#mouse-wheel" id="mouse-wheel"></a>

Hold **Ctrl** and use the mouse wheel to zoom the chart vertically. Hold **Alt** and use the mouse wheel to zoom the chart horizontally.

#### Price\&Time scale <a href="#price-and-time-scale" id="price-and-time-scale"></a>

As a new feature in the AgenaTrader development of version 1.7.x.x it is now possible to scale the price and time axis simultaneously. Press and hold **STRG** resp. **CTRL** on the keyboard as well as press and hold the left mouse button within the chart and move the pointer.

### Keyboard <a href="#keyboard" id="keyboard"></a>

You can navigate a chart also from the keyboard. To configure or edit the navigation settings for the keyboard please consult the [Hot keys](https://agenatrader.com/wiki/tiki-index.php?page=Hot+Keys) section

<figure><img src="/files/p5toM18MfrOd13E1NvVj" alt=""><figcaption></figcaption></figure>

## <img src="/files/zLA15jgkP9tQwgnjoa5L" alt="" data-size="line"> Single Chart <a href="#single-chart" id="single-chart"></a>

*In order to display only one chart inside the container use one of the options:*

1. Select **Single chart** by using **Main -> New -> Chart Container** or
2. click the icon ![](/files/ziieOE9HZEfdeSoRQ34O) in the application toolbar within the main window.

<figure><img src="/files/GPxrL0u3Yyucu1NqLV9V" alt=""><figcaption></figcaption></figure>

The chart definitions popup allows you to input the following parameters:

| Parameter   | Meaning                                                                                                                                                                              |
| ----------- | ------------------------------------------------------------------------------------------------------------------------------------------------------------------------------------ |
| Instrument  | The instrument's market symbol. Use the ![](/files/GoqovmGm8uHNaB5oBuzs) button to open the [Instrument Editor](https://docs.agenatrader.com/tools/instrument-escort) selection tree |
| Periodicity | Seconds, minutes, hours, days, etc.                                                                                                                                                  |
| Interval    | This is the interval for periodicity. (i.e. 5 minutes on the image)                                                                                                                  |
| Price style | Candle, Bar, Line Chart, etc.                                                                                                                                                        |
| Bars count  | Defines the number of periods                                                                                                                                                        |
| Time period | Defines the time interval, for which the chart should display the data. **Days back** defines the length of the past data history.                                                   |
| Template    | Saved [Chart Toolbar: Chart templates](https://docs.agenatrader.com/main/chart-area/untitled/chart-templates) can be selected here                                                   |

Once you have confirmed the entry data, the single chart will be opened and placed within the workspace as shown in the picture. In the case below, the chart has been added next to an existing tab group.

<figure><img src="/files/UurSoXSI5uKwmNGe1hNd" alt=""><figcaption></figcaption></figure>

Once you have confirmed the entry data, the single chart will be opened and placed within the workspace as shown in the picture. In the case below, the chart has been added next to an existing tab group.

[AgenaTrader ++ (plus plus](https://docs.agenatrader.com/create-your-own-trading-strategy/setup-escort)) setups also work in the single chart group.

## <img src="/files/MKk7Vbkv7QygwxvHZ3qE" alt="" data-size="line"> Single Chart Group <a href="#single-chart-group" id="single-chart-group"></a>

In order to open a single chart group inside the container use one of the options:

1. Select **Single chart group** by using **Main -> New -> Chart container** or
2. Click the icon <img src="/files/CNbInWuAQktiOoPMFhU8" alt="" data-size="line"> in the application toolbar within the main window.

<figure><img src="/files/cxOx9SVljbrG0OYTDUDl" alt=""><figcaption></figcaption></figure>

Single Chart Group displays the selected instrument in multiple charts within different time frames.

The following parameters are available for configuration in the dialog window:

| Parameter   | Meaning                                                                                                                                                                                                            |
| ----------- | ------------------------------------------------------------------------------------------------------------------------------------------------------------------------------------------------------------------ |
| Instrument  | The instrument's market symbol. Use the ![](/files/GoqovmGm8uHNaB5oBuzs)button to open the [Instrument Editor](https://agenatrader.com/wiki/tiki-index.php?page=Instrument+Escort) selection tree                  |
| Price style | Candle, bar, line chart, etc                                                                                                                                                                                       |
| Bars count  | Defines the number of periods                                                                                                                                                                                      |
| Time period | Defines the time interval, from the start date to the end date (days back), for which the chart should display the data.                                                                                           |
| Time frame  | Includes the predefined time frames. You can set these up using the **Configuration Еscort** and tabs **General ->** [**Action Bar**](https://docs.agenatrader.com/main/chart-area/actionbar#time-frame-regulator) |
| Add         | <p>Allows you to add a non-predefined time frame into the chart group. <br><img src="/files/BH3wQx942GK0rGZ2Mrro" alt=""></p>                                                                                      |
| Template    | Saved [Chart Toolbar: Chart templates](https://docs.agenatrader.com/main/chart-area/untitled/chart-templates) can be selected here.                                                                                |

Once you have confirmed the entry data, the single chart group will be opened.

<figure><img src="/files/cJREcFz1OFkzPHof1WSw" alt=""><figcaption></figcaption></figure>

Now you can rearrange the chart positions using the **Settings -> Chart group ->** [**Set Container Style**](https://docs.agenatrader.com/main/chart-area/untitled/chart-group#Set_container_style). Other functions are described in the section [Chart Toolbar: Chart Group](https://docs.agenatrader.com/main/chart-area/untitled/chart-group).

<figure><img src="/files/rS2d9dqOz7o22qYM1bsj" alt=""><figcaption></figcaption></figure>

[AgenaTrader ++ (plus plus](https://docs.agenatrader.com/create-your-own-trading-strategy/setup-escort)) setups also work in the single chart group.

## <img src="/files/9tmLlLkNucBL89J4XQRt" alt="" data-size="line"> List Chart Group <a href="#chart_container__list_chart_group" id="chart_container__list_chart_group"></a>

#### Create List chart group <a href="#create_list_chart_group" id="create_list_chart_group"></a>

A list chart group is a chart container that includes a [scanner](https://docs.agenatrader.com/main/chart-area/realtime-scanner) and a charting area. Within this charting area you can select 1-4 charts with different time frames linked to the scanner list.

*In order to open a list chart group inside the container use one of the options:*

1. Select **List chart group** by using **Main -> New -> Chart container** or
2. Click the icon <img src="/files/StRUAoP8jF4xEXcaBWh8" alt="" data-size="line"> in the application toolbar within the main window

<figure><img src="/files/3ArtrUNAtL5HQmoXa7PS" alt=""><figcaption></figcaption></figure>

The List Chart Group definition popup allows you to input the following values:

| Parameter             | Meaning                                                                                                                                                                                                                                                                                  |
| --------------------- | ---------------------------------------------------------------------------------------------------------------------------------------------------------------------------------------------------------------------------------------------------------------------------------------- |
| Instrument List       | The name of the instrument list to be displayed on the scanner list. You can set this manually or click the icon ![](/files/GoqovmGm8uHNaB5oBuzs) and select from the drop down list.                                                                                                    |
| Fav.                  | Check this box if you wish to assign the current instrument list to your favorite lists. The "favorite" instrument list will be offered as the first option for the next LCG/TCG created.                                                                                                |
| Price style           | Candle, bar, line chart, etc. or if you have chosen a template "From Template".                                                                                                                                                                                                          |
| Bars count            | Defines the number of periods                                                                                                                                                                                                                                                            |
| Time period           | Defines the time interval, from the start date to the end date (days back), for which the chart should display the data.                                                                                                                                                                 |
| Predefined time frame | The predefined time frames in the **Tools -> Configuration Еscort** in tabs **General ->** [**Global Configuration: ActionBar**](https://docs.agenatrader.com/tools/configuration-escort#actionbar) -> **Time-Frames** tab can be selected here (maximum 4 time frames per chart group). |
| Add                   | <p>Allows you to add a non-predefined time frame into the chart group.</p><p><img src="/files/1k0MenokxtwBwuVT8Zk1" alt="" data-size="original"></p>                                                                                                                                     |
| Template              | Saved [List chart group templates](https://docs.agenatrader.com/main/chart-area/untitled/chart-group#Templates) can be selected here                                                                                                                                                     |

<figure><img src="/files/xog2wK4LwTQKjYuI2aOE" alt=""><figcaption></figcaption></figure>

Once you have confirmed the entry data, the list chart group will be opened.

You can rearrange the chart positions using the **Settings -> Chart group ->** [**Set Container Style**](https://docs.agenatrader.com/main/chart-area/untitled/chart-group#Set_container_style).

Double clicking on a borderline between the chart and the LCG allows you to minimize it to the width of the symbol names or the size of the first column.

The image below shows the context menu of a list chart group (separate functions are described in the next section)

<figure><img src="/files/Ophvb6FybRL2Wcf1cXMh" alt=""><figcaption></figcaption></figure>

[AgenaTrader ++ (plus plus](https://docs.agenatrader.com/create-your-own-trading-strategy/setup-escort)) setups also work in the single chart group

#### Reload the List Chart Group <a href="#reload-the-list-chart-group" id="reload-the-list-chart-group"></a>

This topic is explained in detail in the section:[ Reload instrument lists](https://docs.agenatrader.com/main/chart-area/realtime-scanner/scanner-settings#reload-instrument-lists).

## <img src="/files/SuQmH4VIirC3lKxoBw38" alt="" data-size="line"> Tab Chart Group <a href="#chart_container__tab_chart_group" id="chart_container__tab_chart_group"></a>

#### Create a tab chart group <a href="#create_a_tab_chart_group" id="create_a_tab_chart_group"></a>

A Tab Chart Group is a chart container that simultaneously opens multiple charts for various instruments and shows the symbols for instruments in the bottom tab bar.

<figure><img src="/files/gCAKbOWHqkRBSiiwDvRK" alt=""><figcaption></figcaption></figure>

AgenaTrader is able to display hundreds of instruments within 4 charts in different time frames. All charts within a tab chart group container display real time data.

In order to open a tab chart group inside the container use one of the options:''

1. Select **Tab Chart Group** by using **Main -> New -> Chart container** or
2. click the icon <img src="/files/wKx9VEyGtxLJyMrPo55T" alt="" data-size="line"> in the application toolbar within the main window.

<figure><img src="/files/Pot6OMHdsaWl3HjFOnru" alt=""><figcaption></figcaption></figure>

You can make the following changes using the tab chart group definition popup:

| Parameter             | Meaning                                                                                                                                                                                                                                                                                 |
| --------------------- | --------------------------------------------------------------------------------------------------------------------------------------------------------------------------------------------------------------------------------------------------------------------------------------- |
| Instrument List       | The name of the instrument list to be displayed on the scanner list. You can set this manually or select from the drop down list.                                                                                                                                                       |
| Fav.                  | Check this box if you wish to assign the current instrument list to your favorite lists. The "favorite" instrument list will be offered as the first option for the next LCG/TCG created.                                                                                               |
| Price style           | Candle, bar, line chart, etc. or if you have chosen a template "From Template".                                                                                                                                                                                                         |
| Bars count            | Defines the number of periods                                                                                                                                                                                                                                                           |
| Time period           | Defines the time interval, from the start date to the end date (days back), for which the chart should display the data.                                                                                                                                                                |
| Predefined time frame | The predefined time frames in the **Tools -> Configuration Еscort** in tabs **General ->** [**Global Configuration: ActionBar**](https://docs.agenatrader.com/tools/configuration-escort#actionbar) -> tab **Action bar** can be selected here (maximum 4 time frames per chart group). |
| Add                   | <p>Allows you to add a non-predefined time frame into the chart group.</p><p><img src="/files/8T1ZSvefpIXHInrXUQzk" alt="" data-size="original"></p>                                                                                                                                    |
| Template              | Saved [Tab chart group templates](https://docs.agenatrader.com/main/chart-area/untitled/chart-group#Templates) can be selected here                                                                                                                                                     |

<figure><img src="/files/vnSGfLo61RGqCGkBtWpQ" alt=""><figcaption></figcaption></figure>

Once you have confirmed the entry data, the list chart group will be opened.

Now you can rearrange the chart positions using the **Settings -> Chart group ->** [**Set Container Style**](https://docs.agenatrader.com/main/chart-area/untitled/chart-group#Set_container_style).

The image below shows the context menu of a tab chart group

<div align="left"><figure><img src="/files/6iApMZAcgg7m0wKuX1jR" alt=""><figcaption></figcaption></figure></div>

You can find a detailed description of the functions in the section [Chart Toolbar: Chart Group](https://agenatrader.com/wiki/tiki-index.php?page=Chart+Toolbar%3A+Chart+Group).

#### Moveable bottom tabs <a href="#moveable-bottom-tabs" id="moveable-bottom-tabs"></a>

The bottom tabs of the tab chart group can be moved to the desired position via drag & drop

<figure><img src="/files/TGv184WTJlGI7UACcI40" alt=""><figcaption></figcaption></figure>

#### Coloring the background of the bottom tabs <a href="#coloring-the-background-of-the-bottom-tabs" id="coloring-the-background-of-the-bottom-tabs"></a>

Right click on the symbol and select the **Mark item** menu option to pick a color for the tab. By selecting the **Reset Marked Item** menu the color can be removed

<figure><img src="/files/Wi42d5rI24ul3hUsCQZn" alt=""><figcaption></figcaption></figure>

#### AgenaTrader ++ (plus plus) setups in tab chart groups <a href="#agenatrader--plus-plus-setups-in-tab-chart-groups" id="agenatrader--plus-plus-setups-in-tab-chart-groups"></a>

Once AgenaTrader++ plusplus is activated in a chart within the tab chart group, the system may suggest orders using the defined strategy according to the market events. If this happens you will see a marker with a grey dot next to the name of the corresponding instrument inside the chart group / tab chart group.

Later on, the long position in a chart group or tab chart group will be marked with a green dot and the short position with a red dot

<figure><img src="/files/cLeAW0dEcba9R7VM62MN" alt=""><figcaption></figcaption></figure>

#### Reload the Tab Chart Group <a href="#reload-the-tab-chart-group" id="reload-the-tab-chart-group"></a>

Tab chart group lists should be distinguished from instrument lists.

If, for example, you expand your instrument list with another instrument (Currency-Long-List), the newly added instrument will not be shown automatically in the TabChartGroup. It is necessary to reload the TabChartGroup together with the Instrument List (Currency-Long-List).

AgenaTrader enables you to select and reload multiple instrument lists using the **Reload Instrument List** menu item. Please note that these selections will only be valid for the chosen tab chart group.

This makes it possible to choose the **Reload Selected** menu option to update the edited lists for the current tab chart group on a daily basis.

This is especially useful if you wish to retrieve the current configuration of a dynamic instrument list or stock **EOD Screener Presets** on a daily basis

<figure><img src="/files/bl0EJim3BMys9njYLChb" alt=""><figcaption></figcaption></figure>

## <img src="/files/tTvWii7E2xid74GnSRCw" alt="" data-size="line"> Chart Gallery (add on) <a href="#chart_container__chart_gallery" id="chart_container__chart_gallery"></a>

#### Chart Gallery Actionbar <a href="#chart-gallery-actionbar" id="chart-gallery-actionbar"></a>

The Gallery ActionBar is located on the right-hand side of the chart and is equipped with various functions to improve trading management.

It has several new functions available only for Charts Galleries:

* **Add New Chart** ![](/files/1TEcfTu0whptitFQ5zZG) button allows user to add a copy of this chart to the chart gallery.
* Left mouse click on **Remove Chart** ![](/files/SsQdg0njQZr9vsbcmDDB) button will remove existing chart.
* With **Maximize/Minimize** ![](/files/qe8qwXI41OdEPfMvvNlx) button chart can be moved to the desired position via drag & drop:

<figure><img src="/files/wD5qJwrKmbcjmzbasu9L" alt=""><figcaption></figcaption></figure>

{% hint style="info" %}
**Important!** Please find details about standard functions in [**ActionBar**](https://docs.agenatrader.com/main/chart-area/actionbar) section.
{% endhint %}

## <img src="/files/BsW0JhsLiVtdY0WQ3IUc" alt="" data-size="line"> Single Chart Gallery <a href="#single-chart-gallery" id="single-chart-gallery"></a>

Allows you to view one symbol in numerous time frames.

In order to open a single chart gallery inside the container use one of the following options:

1. Select Single Chart Gallery by using Main -> New -> Chart container -> Chart Gallery or
2. click the icon <img src="/files/DWx7SgomMuN8S78uC1iY" alt="" data-size="line"> in the application toolbar within the main window.

<figure><img src="/files/XwXhs2tRAbJmbLYXdOXp" alt=""><figcaption></figcaption></figure>

The Single Chart Gallery definition popup allows you to input the following values:

| Paremeter             | Meaning                                                                                                                                                                                                                                                                                              |
| --------------------- | ---------------------------------------------------------------------------------------------------------------------------------------------------------------------------------------------------------------------------------------------------------------------------------------------------- |
| Instrument            | The name of the instrument to be displayed on the instrument's market symbol. Use the  ![](/files/GoqovmGm8uHNaB5oBuzs)  button to open the [Instrument Editor](https://docs.agenatrader.com/tools/instrument-escort) selection tree                                                                 |
| Bars count            | Defines the number of periods                                                                                                                                                                                                                                                                        |
| Time period           | Defines the time interval, from the start date to the end date (days back), for which the chart should display the data.                                                                                                                                                                             |
| Predefined time frame | There are predefined time frames, but you can add your own preferred timeframes in the **Tools -> Configuration Еscort** in tabs **General ->** [**Global Configuration: ActionBar**](https://docs.agenatrader.com/tools/configuration-escort#actionbar) -> tab **Action bar** can be selected here. |
| Add                   | <p>Allows you to add a non-predefined time frame into the chart group.<br><img src="/files/yot9YbihCmvEAeJLDfeI" alt=""></p>                                                                                                                                                                         |
| Template              | Saved [Tab chart group templates](https://docs.agenatrader.com/main/chart-area/untitled/chart-group#Templates) can be selected here.                                                                                                                                                                 |

**Example**

<figure><img src="/files/Ki8uLBIF9C2IublHfz9v" alt=""><figcaption></figcaption></figure>

## <img src="/files/7gRrrQEGwP1UuADXHFJA" alt="" data-size="line"> List Chart Gallery <a href="#list-chart-gallery" id="list-chart-gallery"></a>

Allows you create a list based chart gallery where you can view multiple symbols in numerous time periods

In order to open a List Chart Gallery inside the container use one of the options:

1. Select List Chart Gallery by using Main -> New -> Chart container -> Chart Gallery or
2. click the icon <img src="/files/dnEHAzUIe9ERjkENzspE" alt="" data-size="line"> in the application toolbar within the main window.

<figure><img src="/files/MNJs7JE046GKte7Lbx5U" alt=""><figcaption></figcaption></figure>

The List Chart Gallery definition popup allows you to input the following values:

| Parameter             | Meaning                                                                                                                                                                                                                                                                                              |
| --------------------- | ---------------------------------------------------------------------------------------------------------------------------------------------------------------------------------------------------------------------------------------------------------------------------------------------------- |
| Instrument List       | The name of the instrument list to be displayed on the scanner list. You can set this manually or click the icon <img src="/files/SlOWS0zzWTvoZzfpCcy5" alt="" data-size="line">and select from the drop down list.                                                                                  |
| Fav.                  | Check this box if you wish to assign the current instrument list to your favorite lists. The "favorite" instrument list will be offered as the first option for the next LCG/TCG created.                                                                                                            |
| Bars count            | Defines the number of periods                                                                                                                                                                                                                                                                        |
| Time period           | Defines the time interval, from the start date to the end date (days back), for which the chart should display the data.                                                                                                                                                                             |
| Predefined time frame | There are predefined time frames, but you can add your own preferred timeframes in the **Tools -> Configuration Еscort** in tabs **General ->** [**Global Configuration: ActionBar**](https://docs.agenatrader.com/tools/configuration-escort#actionbar) -> tab **Action bar** can be selected here. |
| Add                   | <p>Allows you to add a non-predefined time frame into the chart group.</p><p><img src="/files/Qm0NQaRpfmd9t7epVEgf" alt="" data-size="original"></p>                                                                                                                                                 |
| Template              | Saved [List chart group templates](https://docs.agenatrader.com/main/chart-area/untitled/chart-group#Templates) can be selected here.                                                                                                                                                                |

**Example**

<figure><img src="/files/E7wPp7p1kS61cAzjMGNY" alt=""><figcaption></figcaption></figure>

## <img src="/files/qy9iKRgCOD4E3x5dFr8B" alt="" data-size="line"> Tab Chart Gallery <a href="#tab-chart-gallery" id="tab-chart-gallery"></a>

Allows you to create a tab based chart gallery where you can view multiple symbols in numerous time periods

1. Select Chart Gallery by using Main -> New -> Chart container -> Chart Gallery or
2. click the icon <img src="/files/gW8T7cM6GYUWM8xw7oGy" alt="" data-size="line"> in the application toolbar within the main window.

<figure><img src="/files/3r4BZL1VJZJZUGSiuq8h" alt=""><figcaption></figcaption></figure>

The Tab Chart Gallery definition popup allows you to input the following values:

| Parameter             | Meaning                                                                                                                                                                                                                                                                                              |
| --------------------- | ---------------------------------------------------------------------------------------------------------------------------------------------------------------------------------------------------------------------------------------------------------------------------------------------------- |
| Instrument List       | The name of the instrument list to be displayed on the scanner list. You can set this manually or select from the drop down list. Instrument list should contain less than 100 instruments.                                                                                                          |
| Fav.                  | Check this box if you wish to assign the current instrument list to your favorite lists. The "favorite" instrument list will be offered as the first option for the next LCG/TCG created.                                                                                                            |
| Bars count            | Defines the number of periods. The user may load maximum 1000 bars                                                                                                                                                                                                                                   |
| Time period           | Defines the time interval, from the start date to the end date (days back), for which the chart should display the data.                                                                                                                                                                             |
| Predefined time frame | There are predefined time frames, but you can add your own preferred timeframes in the **Tools -> Configuration Еscort** in tabs **General ->** [**Global Configuration: ActionBar**](https://docs.agenatrader.com/tools/configuration-escort#actionbar) -> tab **Action bar** can be selected here. |
| Add                   | <p>Allows you to add a non-predefined time frame into the chart group.</p><p><img src="/files/5QzMaeZU1Bzz9rIidb3Z" alt="" data-size="original"></p>                                                                                                                                                 |
| Template              | Saved [Tab chart group templates](https://docs.agenatrader.com/main/chart-area/untitled/chart-group#Templates) can be selected here.                                                                                                                                                                 |

**Example**

<figure><img src="/files/z2XGoN6CCAh49J65RNvE" alt=""><figcaption></figcaption></figure>

## <img src="/files/hkI3jD7xai9uxNbObsgz" alt="" data-size="line"> Single Chart Gallery for Instrument List <a href="#single-chart-gallery-for-instrument-list" id="single-chart-gallery-for-instrument-list"></a>

Create a chart gallery to view multiple securities in numerous time periods.

In order to open Single Chart Gallery for Instrument List inside the container use one of the options:''

1. Select Single Chart Gallery by using Main -> New -> Chart container -> Chart Gallery or
2. click the icon <img src="/files/e1H6uy3ZDNItJY0Q9sQ0" alt="" data-size="line"> in the application toolbar within the main window.

<figure><img src="/files/F1REkWAVU1gOylgyFus3" alt=""><figcaption></figcaption></figure>

Please be advised that there is a limit of 100 charts when you create a “Single Chart Gallery for Instrument List“, however after creating the list you are able to add more charts manually. The Single Chart Gallery for Instrument List definition popup allows you to input the following values:

| Parameter             | Meaning                                                                                                                                                                                                                                                                                              |
| --------------------- | ---------------------------------------------------------------------------------------------------------------------------------------------------------------------------------------------------------------------------------------------------------------------------------------------------- |
| Instrument List       | The name of the instrument list to be displayed on the scanner list. You can set this manually or select from the drop down list. Instrument list should contain less than 100 of instruments                                                                                                        |
| Fav.                  | Check this box if you wish to assign the current instrument list to your favorite lists. The "favorite" instrument list will be offered as the first option for the next LCG/TCG created.                                                                                                            |
| Bars count            | Defines the number of periods0. The user may load maximum 1000 bars                                                                                                                                                                                                                                  |
| Time period           | Defines the time interval, from the start date to the end date (days back), for which the chart should display the data.                                                                                                                                                                             |
| Predefined time frame | There are predefined time frames, but you can add your own preferred timeframes in the **Tools -> Global Configuration** in tabs **General ->** [**Global Configuration: ActionBar**](https://docs.agenatrader.com/tools/configuration-escort#actionbar) -> tab **Action bar** can be selected here. |
| Add                   | <p>Allows you to add a non-predefined time frame into the chart group.</p><p><img src="/files/k3EIhZVHS97seDlZAhVZ" alt="" data-size="original"></p>                                                                                                                                                 |
| Template              | Saved [Tab chart group templates](https://docs.agenatrader.com/main/chart-area/untitled/chart-group#Templates) can be selected here.                                                                                                                                                                 |

**Example**

<figure><img src="/files/40Xj2XiqkBn2ah6XjzGs" alt=""><figcaption></figcaption></figure>

## &#x20;<img src="/files/zjXDIsa7th1Mg3M6u91D" alt="" data-size="line"> Dynamic Scanner <a href="#dynamic-scanner" id="dynamic-scanner"></a>

Open the Dynamic Scanner via **Main->New->Chart Container,** and from the list, select a template to be used for the Dynamic Scanner.

<figure><img src="/files/DlbOsIbF4zSLhPqfL5kq" alt=""><figcaption></figcaption></figure>

The Dynamic Scanner opens up, and now automatically collects all available signals that are active in one of your opened charts/chart groups. By default, it searches according to all Analyzer Sessions, i.e. every signal that you have activated in one of your Analyzer Sessions. If you would like to limit the display to certain sessions, simply use the dropdown menu to select the sessions for which the Dynamic Scanner should collect the signals.

<figure><img src="/files/siR5Lzuu8qRzGbbvjHOd" alt=""><figcaption></figcaption></figure>

The Dynamic Scanner is now the only tab in AgenaTrader on which you need to focus your attention. You no longer need to switch between individual tabs and check whether you are receiving signals; every signal automatically lands in the Dynamic Scanner, and you can very easily place the orders for all active signals.

<figure><img src="/files/oRc7IB9mOkOlR09qJtsR" alt=""><figcaption></figcaption></figure>

**Please note**: You may edit Analyzer column via Edit Column button. Please find details on page [Edit Columns](https://agenatrader.com/wiki/tiki-index.php?page=Scanner+context+menu%3A+Edit+Columns)

**Show open trades:** If activated Dynamic Scanner display open trades **Show open orders:** If activated Dynamic Scanner display open orders

<figure><img src="/files/7U9i2KBwUUFYpaWqx8FF" alt=""><figcaption></figcaption></figure>

Each new signal that is shown in the Dynamic Scanner appears with the symbol name written in bold. As soon as you click on the signal, the signal is accepted as “seen”, and the symbol name appears in normal font once more. This behavior is designed to help you keep an overview of which signals you have already checked, and which have just been newly loaded to the Dynamic Scanner.

As soon as a new signal is generated somewhere in your AgenaTrader, it is immediately shown in the Dynamic Scanner in real time.

With the Dynamic Scanner, your daily trading becomes one step more convenient, and starting immediately, you now only have to concentrate on one single tab in AgenaTrader, then place your orders, and finally hand the trade management back to the AT++ algorithm once again.

**Please note**: When Dynamic Scanner is active and you add a new session in Setup Builder, in order to reload and add this new session, Dynamic Scanner needs to be closed and reopened.

Allow the Dynamic Scanner to remove another work step for you, and simply concentrate 100% on the direct trading decision of whether to place a suggested order in the market or not – this is semi-automatic trading to perfection!


# Chart Types

Introduction

Charts in AgenaTrader divides into two groups:

**TB** (Time based) charts:

* Candle chart
* Line chart
* Mountain chart
* Bar chart
* EquiVolume chart
* EquiVolume Shadow chart
* Candle Volume chart
* Heikin Ashi

**NTB** (Non time based) charts:

* Ticks
* Range
* Line Break
* Kagi
* Point & Figure
* Renko
* Volume

All AgenaTrader++ functions can be used for these data series. Create conditions in the Signal Builder based on, for example, Heikin Ashi, but also on all others. Have your indicators displayed by means of the Range chart, and you will see the difference to the normal time-based chart. A further milestone are the combinations in the Signal Builder, with which you can, for example, mix Line Break conditions with regular timeframes. Finally, the multi-timeframe as well as the multi-data series scanner now also scan for these conditions and signals.

### Timeframes and Period settings <a href="#time_frames_and_interval_settings_for_a_chart" id="time_frames_and_interval_settings_for_a_chart"></a>

*You can access available time frames in one of the three following ways:*

1. Left click on the ![](/files/BMnmW1nAcz7HiNjyqFmi) icon within the chart toolbar.
2. Right click in the charting area to bring up the chart context menu, then select **Settings** followed by the **Time Frame** menu item.
3. Click on chart and press **Space** button, then type interval in open dialog:&#x20;

<figure><img src="/files/EtvpKw2OnaAtt69ZZ8ob" alt=""><figcaption></figcaption></figure>

TimeFrame Template

\
Select the [Global Configuration -> General -> ActionBar](https://docs.agenatrader.com/tools/configuration-escort#actionbar) tab from the **Tools** main menu to define your own time frames  or change existing time frames (periodicity and interval).

The settings for the  charts can be found under timeframes. To add a preset for charts to the list of the timeframes, open the Global Configuration and the Action Bar settings. Under Timeframes, you can now enter your desired chart timeframe settings.

<figure><img src="/files/nd2A0Xhb4HroKfq4cHsT" alt=""><figcaption></figcaption></figure>

**The following periodicities are available within the Global Configuration:**

* Seconds: x seconds per candle
* Minutes: x minutes per candle
* Hours: x hours per candle
* Days: x days per candle
* Weeks: x weeks per candle
* Months: x months per candle
* Ticks: x ticks per candle (a tick = one trade)
* Volumes: x traded shares/contracts per candle
* Range: x cents/pips/points/ticks per candle (price range)

In this case x corresponds to the interval entered.

<figure><img src="/files/1ALsaW6OkUsfSLGjIBwm" alt=""><figcaption></figcaption></figure>

Once all necessary changes have been made, the time frames will become available within the toolbar on the chart. Left click on one of these time intervals to apply it to the current chart.

#### Switch Instrument

By using **Custom Parameter**, you can open the **Instrument Dialog** to make the following chart settings:

* Instrument: Enter the instrument symbol. You can use one of the following methods:
  * Manually tept the instrument symbol name. During input, it is checked if the instrument is registered in the Instrument Manager. If no registration exists, the input is automatically deleted.
  * The Instrument Manager can be accessed through a button![](/files/CMVNrjR3g3VyLm0sM4OA).&#x20;
* Periodicity: This allows you to define the time unit for the chart.
* PriceStyle: defines the Chart Type (candle chart, bar chart, line chart, etc.)
* History:
  * The **Bars** will determine the exact number of historical periods displayed on the chart.
  * For **Time period**, you can use "Days back" or "Start date/End Date" to display the history over selected period.
* Template: Once chart templates are defined and saved, they can be used to construct charts. If no template is selected, the default template will be applied.

<figure><img src="/files/XJyZK4ra5HECFuh3Y0QY" alt=""><figcaption></figcaption></figure>

### **Direct Chart** <a href="#direktes-chart" id="direktes-chart"></a>

Data and presentation should adhere strictly to the provided data feed.

<figure><img src="/files/wQO0gufRUEhLLoZQ6z2x" alt=""><figcaption></figcaption></figure>

{% hint style="warning" %}
**Attention!**&#x20;

For minute charts (like 3min, 7min, etc.), calculations start when markets open.
{% endhint %}

### **Processed Chart** <a href="#verarbeitetes-chart" id="verarbeitetes-chart"></a>

Data is sourced from a data feed and the chart style is determined using AgenaTrader.

<figure><img src="/files/rpTlVSqMZ8TIm8YjsmJA" alt=""><figcaption></figcaption></figure>

## Time Based <a href="#actionbar" id="actionbar"></a>

*You can access the price styles (i.e. chart types) options in one of the following two ways:*

1. Left click on the <img src="/files/eq3GWTzWwVWqQdybdhnk" alt="" data-size="line"> icon within the chart toolbar.
2. Right click in the charting area to bring up the chart context menu, then select **Settings** followed by the **Price Style** menu item.

<figure><img src="/files/l79jCN0pSKm3HPuemMHY" alt=""><figcaption></figcaption></figure>

#### **Darvas boxes** <a href="#darvas-boxes" id="darvas-boxes"></a>

Darvas boxes are a powerful trading method. Graphical representation of boxes is based on trending methodology (momentum). If you wish for Darvas boxes to be displayed on the chart, select this option in the context menu.

In the subsequent parts we will describe each price style separately.

### &#x20;<img src="/files/m5cgpgtCjBB3VGwzH3eI" alt="" data-size="line">  Candle chart <a href="#candle-chart" id="candle-chart"></a>

Candle charts display the following information within the selected interval:

* 'open' price
* 'highest' price
* 'lowest' price
* 'close' price

<figure><img src="/files/MiVJFy7bYYlTGFwLoYfZ" alt=""><figcaption></figcaption></figure>

You can recognize the 'open' and 'close' prices by the candle body and color (see [color settings](https://docs.agenatrader.com/main/chart-area/untitled/color)). The 'highs' and 'lows' of prices can be recognized by observing the candle wicks (tails), which are located above and below the candlestick body.

### <img src="/files/vyAtyBy0gTCoFd6M80wa" alt="" data-size="line"> Line chart <a href="#line-chart" id="line-chart"></a>

The line chart connects closing prices with each other for the specified time frame.

<figure><img src="/files/Tpaz4S6d54gqV1ozoO8T" alt=""><figcaption></figcaption></figure>

## <img src="/files/9sms0j8OjlNV0AYYfCRa" alt="" data-size="line"> Mountain chart <a href="#mountain-chart" id="mountain-chart"></a>

The mountain chart connects closing prices from a certain time period with each other. It is similar to the line chart, except that the entire area below this line is filled with color.

<figure><img src="/files/Ztr6G1id6uvbU3vh2LjF" alt=""><figcaption></figcaption></figure>

## &#x20; <img src="/files/kpHcb9nDKF4fWelkJa0H" alt="" data-size="line"> Bar chart <a href="#bar-chart" id="bar-chart"></a>

The bar chart plots prices similarly to the candle chart. The difference is that the opening price is indicated by a small horizontal stroke on the left side of a bar and the closing price by a small horizontal stroke on the right side of a bar.

<figure><img src="/files/w1fHhMcazbCoEFzpTI4Z" alt=""><figcaption></figcaption></figure>

## <img src="/files/DlhTyYQpUk6bgjFSAgYt" alt="" data-size="line">  EquiVolume chart <a href="#equivolume-chart" id="equivolume-chart"></a>

The EquiVolume chart plots price movements, taking into consideration the volume, time and price components.

Thus, the EquiVolume chart consists only of the 'high' and 'low' prices of a period. The thickness of the candle lets you estimate the volume associated with a specific period.

<figure><img src="/files/oJtgmq3WuwyPTAABjDQu" alt=""><figcaption></figcaption></figure>

## &#x20; <img src="/files/Ov52F3Z2V35rlwUEPeCb" alt="" data-size="line"> EquiVolume Shadow  <a href="#equivolume-shadow-chart" id="equivolume-shadow-chart"></a>

This chart essentially conveys the same data as the EquiVolume chart.

The main difference is that the candle body is displayed, showing upward trends from the lowest price to the closing price and downward trends from the highest price to the closing price. The remaining price changes, which went against the candle, will be shown as shadows. These shadows enable you to see how strong the trend is.

<figure><img src="/files/UGo8ICVAKRDtg8vQuVzn" alt=""><figcaption></figcaption></figure>

## &#x20;<img src="/files/lIXWi1obnz9sbNlEWpwn" alt="" data-size="line"> Candle volume  <a href="#candle-volume-chart" id="candle-volume-chart"></a>

The candle volume chart looks similar to the candle chart, yet it analyses not only price movements but also the corresponding trading volume. You can observe on this chart as well as the high and low price for the period, along with the opening and closing price. The thicker the candlestick the higher the volume.

<figure><img src="/files/yINg3v2Sc3Zy7wFeG3MM" alt=""><figcaption></figcaption></figure>

## **Non Time Based** <a href="#how_to_create_renko_chart_and_calculate_indicators" id="how_to_create_renko_chart_and_calculate_indicators"></a>

### Ticks <a href="#ticks" id="ticks"></a>

<figure><img src="/files/T6519k4aLNC8jTA2xO6s" alt=""><figcaption></figcaption></figure>

In tick charts, a new candle is drawn whenever a specific number of trades (e.g., 150 ticks/trades) have been executed.

{% hint style="warning" %}
NOTE: We have increased the limit for using tick data to 20 business days (capped at 10,000 bars). We hope this meets the demand for more historical data.
{% endhint %}

#### **How to create Renko chart and calculate indicators** <a href="#how_to_create_renko_chart_and_calculate_indicators" id="how_to_create_renko_chart_and_calculate_indicators"></a>

In the example, a Renko chart based on daily data with a box size of 25 points is set. This NTB chart can now be found in the Timeframes dropdown; with a click, the Renko chart is loaded.

Since the NTB charts are now completely available as an individual data series, you can calculate every available indicator based on, for example, Renko charts. You can see the result in the screenshot above. With this, you now have an unprecedented selection of calculation methods and areas of application for indicators. You can already see in the screenshot above just how strongly the display of the RSI in the Renko chart differs from the normal daily chart.

<figure><img src="/files/OJDzN04AO6x4jBiVaOO3" alt=""><figcaption></figcaption></figure>

#### Signal Builder **- RSI with Renko** <a href="#condition_escort_-_rsi_with_renko" id="condition_escort_-_rsi_with_renko"></a>

In addition, you can also have conditions and signals calculated with these indicators. To do so in the Signal Builder, you have to select the Renko chart as the timeframe again. Here, all NTB charts that you enter in the Global Configuration are available, as described further above. The generated signal is outputted when the RSI – calculated with the Renko data – cuts upwards through the 30 signal line. This condition could have also been implemented with a “cr-a” order.

<figure><img src="https://docs.agenatrader.com/~gitbook/image?url=https%3A%2F%2F2805764894-files.gitbook.io%2F%7E%2Ffiles%2Fv0%2Fb%2Fgitbook-legacy-files%2Fo%2Fassets%252F-MKZSsJBtSP9L4sqIe_q%252F-MRKx3J1QfOTre9v3M5l%252F-MRKyGswKbUpbXmfcmET%252FHistory%2520management%2520cond%2520escort.PNG%3Falt%3Dmedia%26token%3Db51487bd-a012-45da-bb77-7fe0dfac70cd&#x26;width=768&#x26;dpr=4&#x26;quality=100&#x26;sign=b03d6aa8&#x26;sv=1" alt=""><figcaption></figcaption></figure>

You can now also deposit a setup with this condition as well, e.g. a BarByBar stop that is now also calculated on the Renko chart and trails the stop behind every Renko bar.

#### **Multi-timeframe and multi-data series scanner** <a href="#multi-timeframe_and_multi-data_series_scanner" id="multi-timeframe_and_multi-data_series_scanner"></a>

Besides this, you can now use the Analyzer Column to have this signal scanned for in real time, allowing you to keep an eye on thousands of instruments based on Renko or any other NTB style, so that you do not miss a single signal.

To screen using Renko data in the Analyzer Column, in the settings for the Analyzer Column column, again select the data series previously set in the Global Configuration for the timeframe.

<figure><img src="https://docs.agenatrader.com/~gitbook/image?url=https%3A%2F%2F2805764894-files.gitbook.io%2F%7E%2Ffiles%2Fv0%2Fb%2Fgitbook-legacy-files%2Fo%2Fassets%252F-MKZSsJBtSP9L4sqIe_q%252F-MRKx3J1QfOTre9v3M5l%252F-MRKyTIS5h445w78GCjA%252FHistory%2520managemen%2520columns.png%3Falt%3Dmedia%26token%3Dbc57b070-2594-4450-9e58-5f7efcc20a79&#x26;width=768&#x26;dpr=4&#x26;quality=100&#x26;sign=cbf1e499&#x26;sv=1" alt=""><figcaption></figcaption></figure>

### <img src="/files/ruGMcVw95F8OZMoJbCyA" alt="" data-size="line">  **Point\&Figure** <a href="#point_amp_figure" id="point_amp_figure"></a>

The Point & Figure (P\&F) chart was developed by Charles Dow and first described in his book in 1898, making this chart the oldest Western chart type. The interesting aspect of this price representation is the absence of a time axis. The aim is to highlight the changes in the direction of existing trends. The P\&F chart plots an 'X' when the price rises and an 'O' when the price falls. The height of a column depends upon the so-called 'box size' - the price range for X's or O's. As soon as the price has exceeded the current box size, a new X is displayed in an upward trend (and consequently, O is displayed in a downward trend).

**Example.** Let's assume that the Daimler's current price is 35.10€. If the box size is set to 1€, a new X will only be plotted if the price reaches a minimum of 36€. All values between 35€ and 36€ will not initiate a change.

Along with the box size, another important element of the P\&F chart is the reversal setting. The reversal setting determines whether a change between the X and O columns occurs. The trader determines the reversal setting as a multiple of “box sizes” that creates a reversal signal after the last high or low in a price.

**Example.** Let's assume that the Daimler's last 'low' price is 15€. If reversal is set as 5x the box size (1€ x 5), a change from O to X columns will occur at a price level of 20€. Should the price only reach 19€, a reversal signal will not be generated and the O column will continue to be plotted.

![](https://docs.agenatrader.com/~gitbook/image?url=https%3A%2F%2F2805764894-files.gitbook.io%2F%7E%2Ffiles%2Fv0%2Fb%2Fgitbook-legacy-files%2Fo%2Fassets%252F-MKZSsJBtSP9L4sqIe_q%252F-MRKx3J1QfOTre9v3M5l%252F-MRKyYfOFcD0PTL-SRpk%252FPoint%2526Figure.PNG%3Falt%3Dmedia%26token%3D8be5ed52-e170-4d23-901b-d7443efc4b91\&width=768\&dpr=4\&quality=100\&sign=dd865fb9\&sv=1)

The following settings can be adjusted within the Time Frame:

![](https://docs.agenatrader.com/~gitbook/image?url=https%3A%2F%2F2805764894-files.gitbook.io%2F%7E%2Ffiles%2Fv0%2Fb%2Fgitbook-legacy-files%2Fo%2Fassets%252F-MKZSsJBtSP9L4sqIe_q%252F-MRKx3J1QfOTre9v3M5l%252F-MRKycUV4cL7AelC-bHw%252FFigure%2520and%2520point%2520time%2520frame.PNG%3Falt%3Dmedia%26token%3D87f4c499-d3fa-4416-b7d2-169265bc7814\&width=768\&dpr=4\&quality=100\&sign=a5918894\&sv=1)

1. Box Size: shows the box size (in fixed/points/etc.) that defines when a new X or O is drawn. The smaller the box size, the more sensitive the chart. ATR (20): shows the ATR multiplier that defines box size/reversal based on the average size of the last 20 candles.
2. Reversal Size: shows the multiplier for the box size that defines after how many reversal boxes a new column with X or O symbols will be plotted.

### <img src="/files/5CENNKLZekwv98W3Ix1x" alt="" data-size="line"> **Renko chart** <a href="#renko_chart" id="renko_chart"></a>

The Renko chart is another chart type that plots prices with no regard to time. The Renko chart was invented in Japan. Its name is translated from the Japanese “renga”, meaning “brick”. The Renko chart is similar to the P\&F chart developed by Charles Dow, in that the time axis is also missing in this chart. This chart consists of black and white bricks. Black bricks are plotted when the price falls, and white bricks, when the price rises. When constructing the Renko chart, only the closing prices of an instrument are considered. New bricks are created when the current closing price exceeds the minimum brick size. If price volatility during a specific period is minimal or the brick size is too large, it can take several days before a new brick is plotted.

The fundamental characteristic of the Renko chart (much like the P\&F chart) is a clear representation of existing trends and trend reversals. This is why it is important to assign the correct brick size. A brick size that is too small increases chart sensitivity, leading to too many trend changes (and also bad signals) being plotted. A brick size that is too large results in significantly late detection of trend changes.

![](https://docs.agenatrader.com/~gitbook/image?url=https%3A%2F%2F2805764894-files.gitbook.io%2F%7E%2Ffiles%2Fv0%2Fb%2Fgitbook-legacy-files%2Fo%2Fassets%252F-MKZSsJBtSP9L4sqIe_q%252F-MRKx3J1QfOTre9v3M5l%252F-MRKygi1MsyTCU-RdPV4%252FRENKO.PNG%3Falt%3Dmedia%26token%3D3995a214-fbb7-4c4d-813a-364826f7ee41\&width=768\&dpr=4\&quality=100\&sign=1e878784\&sv=1)

The following settings can be adjusted within the Time Frame::

![](https://docs.agenatrader.com/~gitbook/image?url=https%3A%2F%2F2805764894-files.gitbook.io%2F%7E%2Ffiles%2Fv0%2Fb%2Fgitbook-legacy-files%2Fo%2Fassets%252F-MKZSsJBtSP9L4sqIe_q%252F-MRKx3J1QfOTre9v3M5l%252F-MRKymHkRXpuT4Ie4KAH%252FRENKO%2520time%2520frame.PNG%3Falt%3Dmedia%26token%3De9d4b7c6-1fc7-41ef-8b7c-c76e2ecd4113\&width=768\&dpr=4\&quality=100\&sign=19a66af5\&sv=1)

1. Box Size: shows the box size (in fixed/points/etc.) that defines when a new X or O is drawn. The smaller the box size, the more sensitive the chart.
2. Use ATR (20): shows the ATR multiplier that defines box size/reversal based on the average size of the last 20 candles.

### <img src="/files/z49REQ6d34TMsihuhEqb" alt="" data-size="line">  **Kagi chart** <a href="#kagi_chart" id="kagi_chart"></a>

Kagi charts can be useful for trend analysis and making buy or sell decisions. Thick (yang) lines are drawn when demand exceeds supply, indicating an upward trend and consequent bull market. Thin (yin) lines are drawn when supply exceeds demand, indicating a downward trend and consequent bear market. When the Kagi line goes from thin to thick then buy signals are generated, and when it goes from thick to thin then sell signals are generated.

![](https://docs.agenatrader.com/~gitbook/image?url=https%3A%2F%2F2805764894-files.gitbook.io%2F%7E%2Ffiles%2Fv0%2Fb%2Fgitbook-legacy-files%2Fo%2Fassets%252F-MKZSsJBtSP9L4sqIe_q%252F-MRKx3J1QfOTre9v3M5l%252F-MRKz4URzhvKtTtB6Ij3%252FKagi.PNG%3Falt%3Dmedia%26token%3Daaa4719c-01a0-47d3-b46b-1bc284e8d41b\&width=768\&dpr=4\&quality=100\&sign=8fbb8ba0\&sv=1)

The following settings can be adjusted within the Time Frame::

![](https://docs.agenatrader.com/~gitbook/image?url=https%3A%2F%2F2805764894-files.gitbook.io%2F%7E%2Ffiles%2Fv0%2Fb%2Fgitbook-legacy-files%2Fo%2Fassets%252F-MKZSsJBtSP9L4sqIe_q%252F-MRKx3J1QfOTre9v3M5l%252F-MRKz8uit3VqC-Q5_tH_%252FKagi%2520timeframe.PNG%3Falt%3Dmedia%26token%3D77c496ea-ec25-4c75-8842-7fb89c0c2399\&width=768\&dpr=4\&quality=100\&sign=ab396fbd\&sv=1)

1. Reversal Size: shows the multiplier for the box size that defines after how many reversal boxes a new column with X or O symbols will be plotted.
2. Use ATR (20): shows the ATR multiplier that defines reversal size based on the average size of the last 20 candles.

### &#x20;<img src="/files/jSgUq9OvZhqN1g0atBCh" alt="" data-size="line"> **Three line break chart** <a href="#three_line_break_chart" id="three_line_break_chart"></a>

The three line break chart responds to the dynamic of price changes (without regard to time) and is considered to be able to show changes in the trend. The bars on this chart have different heights. White bars indicate rising prices and red bars indicate falling prices.

When the current closing price exceeds the high of the previous day, the next white bar is plotted. The next red bar is plotted when the current closing price falls below the low of the previous day. If the price does not exceed the high or low of the previous day, no new bar will be plotted.

If there is a strong trend in which three white bars have been plotted following each other in direct succession, then a trend reversal will be only initiated when the low of these three bars is broken by the current price.

![](https://docs.agenatrader.com/~gitbook/image?url=https%3A%2F%2F2805764894-files.gitbook.io%2F%7E%2Ffiles%2Fv0%2Fb%2Fgitbook-legacy-files%2Fo%2Fassets%252F-MKZSsJBtSP9L4sqIe_q%252F-MRKx3J1QfOTre9v3M5l%252F-MRKzCjghpxJRbLHZ_su%252FLine%2520Break.PNG%3Falt%3Dmedia%26token%3Dbc5c722b-d111-4ff3-a418-8335fd75fed7\&width=768\&dpr=4\&quality=100\&sign=447bf731\&sv=1)

The following settings can be adjusted within the Time Frame:

![](https://docs.agenatrader.com/~gitbook/image?url=https%3A%2F%2F2805764894-files.gitbook.io%2F%7E%2Ffiles%2Fv0%2Fb%2Fgitbook-legacy-files%2Fo%2Fassets%252F-MKZSsJBtSP9L4sqIe_q%252F-MRKx3J1QfOTre9v3M5l%252F-MRKzHZTrfwb4vnWDBb-%252Fthree%2520liness%2520time%2520frame.PNG%3Falt%3Dmedia%26token%3D2e1dc3c2-448d-44f6-bb6c-6391b167dfbb\&width=768\&dpr=4\&quality=100\&sign=cf108308\&sv=1)

### <img src="/files/7zLArgAbvPLwdIt5ufq1" alt="" data-size="line"> **Heikin Ashi** <a href="#heikin_ashi" id="heikin_ashi"></a>

Within the daily time frame, each Heikin Ashi candlestick represents an interval of exactly one day. Days on which prices moved down (on average) are plotted as red candles, whereas an average upward pace of prices is plotted as a green candle.

Heikin Ashi charts are suitbable for all markets but are mostly used in the stock and commodities markets.

**There are five important signals which will help you to identify trends:**

* Green candles indicate an upward trend - a favorable time to expand long positions or get rid of short positions.
* Green candles without a long shadow indicate a strong upwards trend (it is recommended to continue running long positions until the market changes direction)
* A short candle with shadows on the bottom and top (lines above and below the candle body) indicates a trend reversal. Risk-loving traders can make decisions on whether to buy or sell, whereas risk-averse traders should await confirmation of the trend before opening a short or long position.
* Red candles indicate a downtrend - time to expand short positions or get rid of long positions to limit losses.
* Red candles without long shadows indicate a strong downtrend (it is recommended to continue running short positions until the market changes direction).

![](https://docs.agenatrader.com/~gitbook/image?url=https%3A%2F%2F2805764894-files.gitbook.io%2F%7E%2Ffiles%2Fv0%2Fb%2Fgitbook-legacy-files%2Fo%2Fassets%252F-MKZSsJBtSP9L4sqIe_q%252F-MRKx3J1QfOTre9v3M5l%252F-MRKzM8z1hHoYTBQpoAo%252FHeik%2520Akashi.PNG%3Falt%3Dmedia%26token%3Def86cd02-1d63-4294-addf-870a51650580\&width=768\&dpr=4\&quality=100\&sign=3cafb8b8\&sv=1)

The following settings can be adjusted within the Time Frame:

![](https://docs.agenatrader.com/~gitbook/image?url=https%3A%2F%2F2805764894-files.gitbook.io%2F%7E%2Ffiles%2Fv0%2Fb%2Fgitbook-legacy-files%2Fo%2Fassets%252F-MKZSsJBtSP9L4sqIe_q%252F-MRKx3J1QfOTre9v3M5l%252F-MRKzRqIPOygS4BpXmBN%252FHA%2520timeframe.PNG%3Falt%3Dmedia%26token%3D3f990cf5-818e-4fe3-8294-fe3646cc75b6\&width=768\&dpr=4\&quality=100\&sign=600350b8\&sv=1)

### **Volume** <a href="#volume" id="volume"></a>

With the volume bar chart each bar will be drawn when a certain amount of volume was reached. With a setting of 1.000.000 volume for e.g. shares the chart will draw a bar whenever this volume is reached and move on to the next bar. A small amount of ticks of the 1.000.000 bar indicates high volatility and movement while a high amount of ticks of the 1.000.000 indicates low volatility and movement.

![](https://docs.agenatrader.com/~gitbook/image?url=https%3A%2F%2F2805764894-files.gitbook.io%2F%7E%2Ffiles%2Fv0%2Fb%2Fgitbook-legacy-files%2Fo%2Fassets%252F-MKZSsJBtSP9L4sqIe_q%252F-MRKx3J1QfOTre9v3M5l%252F-MRL2PQH4z3GyrGVBxOi%252FVolume%2520chart.PNG%3Falt%3Dmedia%26token%3D0ddd4756-96a2-4834-9657-90a8b165273e\&width=768\&dpr=4\&quality=100\&sign=39af3237\&sv=1)

The following settings can be adjusted within the Time Frame:

![](https://docs.agenatrader.com/~gitbook/image?url=https%3A%2F%2F2805764894-files.gitbook.io%2F%7E%2Ffiles%2Fv0%2Fb%2Fgitbook-legacy-files%2Fo%2Fassets%252F-MKZSsJBtSP9L4sqIe_q%252F-MRKx3J1QfOTre9v3M5l%252F-MRL2TmIa8X_U57XDIsB%252FVOl%2520timeframe.PNG%3Falt%3Dmedia%26token%3Db1cb567b-4c19-48ee-b311-c386fcbef5b0\&width=768\&dpr=4\&quality=100\&sign=d002b94\&sv=1)

### **Range** <a href="#range" id="range"></a>

Range bars take only price into consideration; therefore, each bar represents a specified movement of price. Range Bars, on the other hand, can have any number of bars printing during a trading session: during times of higher volatility, more bars will print; conversely, during periods of lower volatility, fewer bars will print. The number of range bars created during a trading session will also depend on the instrument being charted and the specified price movement of the range bar.

Three rules of range bars:

Each range bar must have a high/low range that equals the specified range. Each range bar must open outside the high/low range of the previous bar. Each range bar must close at either its high or its low.

**Read more on an** [**Investopedia**](http://www.investopedia.com/articles/trading/10/range-bar-charts-different-view.asp#ixzz4HUtd774Y%C2%A0)**.**

![](https://docs.agenatrader.com/~gitbook/image?url=https%3A%2F%2F2805764894-files.gitbook.io%2F%7E%2Ffiles%2Fv0%2Fb%2Fgitbook-legacy-files%2Fo%2Fassets%252F-MKZSsJBtSP9L4sqIe_q%252F-MRKx3J1QfOTre9v3M5l%252F-MRL2YtfCfynqC2SKi5F%252FRange%2520chart.PNG%3Falt%3Dmedia%26token%3D3488512d-d0a2-47a7-ab97-61f984f483a0\&width=768\&dpr=4\&quality=100\&sign=8cd00471\&sv=1)

The following settings can be adjusted within the Time Frame:

![](https://docs.agenatrader.com/~gitbook/image?url=https%3A%2F%2F2805764894-files.gitbook.io%2F%7E%2Ffiles%2Fv0%2Fb%2Fgitbook-legacy-files%2Fo%2Fassets%252F-MKZSsJBtSP9L4sqIe_q%252F-MRKx3J1QfOTre9v3M5l%252F-MRL2cRlTAmeK9D3igoj%252FRange%2520timeframe.PNG%3Falt%3Dmedia%26token%3D1cdb09ed-80c6-4911-9f02-f0c6fc20fcf2\&width=768\&dpr=4\&quality=100\&sign=16300e\&sv=1)


# Chart Tools

## Instrument

To access the **Instrument Editor**, use one of the following methods:

1. Left click on the ![](/files/L5zflUd5OaCKNxjJnziM) icon within the chart toolbar.
2. Right-click in the charting area to bring up the chart context menu. Then select **Settings** followed by the **Select Instrument** menu item.&#x20;

The Instruments window will appear, displaying the features of the selected instrument. This functionality ensures that users can make changes promptly, such as updating the expiry month for a futures contract, etc.

<figure><img src="/files/zIs2rspDUwcn73FrOcKp" alt=""><figcaption></figcaption></figure>

## Time frame

#### Time frames and interval settings for a chart <a href="#time_frames_and_interval_settings_for_a_chart" id="time_frames_and_interval_settings_for_a_chart"></a>

*You can access available time frames in one of the three following ways:*

1. Left click on the ![](/files/KNbUY3ruabmcDeNvYPnS) icon within the chart toolbar.
2. Right click in the charting area to bring up the chart context menu, then select **Settings** followed by the **Time Frame** menu item.
3. Click on chart and press **Space** button, then type interval in open dialog:

&#x20;

<figure><img src="/files/KlHLC7AjHwFdhnEBSlBm" alt=""><figcaption></figcaption></figure>

Select the [Preferences -> ActionBar](/main/actionbar) tab from the **Tools** main menu to define your own time frames or change existing time frames (periodicity and interval).

**The following periodicities are available within the Preferences:**

* Seconds: x seconds per candle
* Minutes: x minutes per candle
* Hours: x hours per candle
* Days: x days per candle
* Weeks: x weeks per candle
* Months: x months per candle
* Ticks: x ticks per candle (a tick = one trade)
* Volumes: x traded shares/contracts per candle
* Range: x cents/pips/points/ticks per candle (price range)

In this case x corresponds to the interval entered.

After making all necessary changes, time frames will appear in the toolbar on the chart. Click on a time interval to apply it to the current chart.

<figure><img src="/files/6JFhCxGIt588jsZBNt4U" alt=""><figcaption></figcaption></figure>

Using **Custom Parameter**, you can open the **Instrument Dialog**, where you can configure the following **chart settings**:

* **Instrument:** Enter the instrument symbol. There are two ways to do this:
  * Manually enter the instrument symbol. The system will check if the instrument is registered in the **Instrument Manager**. If the symbol is not found, the entry will be automatically deleted.
  * Click the  ![Instr](https://docs.agenatrader.com/~gitbook/image?url=https%3A%2F%2F1347375179-files.gitbook.io%2F%7E%2Ffiles%2Fv0%2Fb%2Fgitbook-legacy-files%2Fo%2Fassets%252F-MKZSsJBtSP9L4sqIe_q%252F-MP9P3vFZH_eTVbqUMdh%252F-MP9POm3UlFx_libN7z-%252Finstr.png%3Falt%3Dmedia%26token%3D28e160d5-a371-4f3c-a508-8d9222889d07\&width=300\&dpr=4\&quality=100\&sign=b78a9dba\&sv=1) **button** to open the **Instrument Manager**, where you can select an instrument from the available list.
* **Period Type/Interval:** Defines the **time unit** for the chart.
* **Price Style:** Determines the **chart type** (e.g., candlestick chart, bar chart, line chart, etc.).

**Historical Data:**

* **Number of Candles:** Displays the exact number of historical periods in the chart.
* **Time Range:** You can select a historical time span using either **"Days Back"** or **"From/To Date"** to display past data accordingly.

**Templates:**

* If you have saved **chart templates**, you can apply them to build the chart.
* If no template is selected, the **default template** will be used.

<figure><img src="/files/XDeUPGl2rPTIMNAGOM0i" alt=""><figcaption></figcaption></figure>

{% hint style="info" %}

**Note: Direct vs. Processed Charts**

* **"Direct"** refers to a chart where **both data and style** are received **exactly as provided by the data feed**.
* **"Processed"** means that while the **data comes from the data feed**, the **specific chart style is generated by AgenaTrader**.
  {% endhint %}

## <img src="/files/wV2m46Z3tPbvl5xDyVeI" alt="" data-size="line"> Multidata

This feature enables the addition of multiple data series within a single chart.

*In order to add secondary data series please:*

Left click on the <img src="/files/dhhO2MZRXs2P30GThDTM" alt="" data-size="line"> icon within the chart toolbar.

In open dialog please type data series you want to add:

<figure><img src="/files/Ch0gAVpRMrSh5zIPAvoS" alt=""><figcaption></figcaption></figure>

Secondary data series is displayed as a mountain chart.

<figure><img src="/files/joPMQzyW7PATa4mNhkWQ" alt=""><figcaption></figcaption></figure>

In **Preferences->Environment->**[ **Chart**](https://docs.agenatrader.com/tools/configuration-escort#chart) you may set secondary data series starting point:

<figure><img src="/files/Vgdt6ifrbdCFzJ7uYHeA" alt=""><figcaption></figcaption></figure>

* **First Requested:** Date\&Time when the data series was added
* **First Visible:** the first point on the left site chart which is visible.

When you add secondary data series, the following settings are determined:

| Icon                                                            | Meaning                                                                                                                                                                                                |
| --------------------------------------------------------------- | ------------------------------------------------------------------------------------------------------------------------------------------------------------------------------------------------------ |
| <img src="/files/nhmJbhsFZL0jxNdgQxRI" alt="" data-size="line"> | Secondary data series replace main data series (All current settings of main chart wouldn't be changed)                                                                                                |
| <img src="/files/czQf6IAJ9RsGdHw2qgS9" alt="" data-size="line"> | Here you can invert display of secondary data series.                                                                                                                                                  |
| <img src="/files/UpCDgNiCMpALRG1M0lrV" alt="" data-size="line"> | This function allows you to set color and line width of secondary data series (For more details please visit [Chart Toolbar: Color](https://docs.agenatrader.com/main/chart-area/untitled/color) page) |
| <img src="/files/Ag4VXEI4DZQMDgrEpc6P" alt="" data-size="line"> | Delete secondary data series                                                                                                                                                                           |

## &#x20;<img src="/files/isvITC0FR7lwOf5pAFbl" alt="" data-size="line"> Drawing objects

*You can insert drawing objects into a chart by doing one of the following:*

1. Left click on the icon<img src="/files/PyEhZAKi3hb8GQkbC1Do" alt="" data-size="line"> within the chart toolbar.
2. Right click in the charting area to bring up the chart context menu, then select **Settings** followed by the **Drawing Tools** menu item.

<figure><img src="/files/1uW0MG4ZHJ0FSfAJoDIS" alt=""><figcaption></figcaption></figure>

To apply a drawing object to the chart follow these steps:

* Select a drawing object from the list. The mouse cursor will change into a pencil.
* Left click on the chart where you wish to place the object.
* Hold the left mouse button and release it on the closest anchor point.

To delete drawing object please select it by Left mouse click and then press **DEL** button.

In order to draw a second object of the same type, repeat the process. To quit drawing mode press **ESC** or the right mouse button.

Double-clicking on the drawing object in a chart will open the Properties dialog window, enabling adjustment of its parameters. This dialog window already displays the current settings of the selected drawing object. Once the settings are modified, they will be immediately applied to the current drawing object.

<figure><img src="/files/bq5HjHUcfZ8urBc5DYVG" alt=""><figcaption></figcaption></figure>

When the chart contains multiple drawing objects, it is unnecessary to open a new dialog window to modify the settings of other objects. Simply select the desired drawing object, and the dialog window will automatically update accordingly. In the previous instance, a trend line was chosen as a drawing tool. Upon selecting the Fibonacci Retracements, the following dialog window will be displayed:

<figure><img src="/files/1EB5DcgMwEogM7pEEWDl" alt=""><figcaption></figcaption></figure>

If you press the **Default** button, then standard settings will be applied to drawing objects once more.

Should you wish to visualize drawing objects differently, then you can create a preset drawing object's template in AgenaTrader. Define your parameters and enter a name inside the drop-down box, then either press the **ENTER** button on the keyboard or the <img src="/files/G7NdHgYwjSqkJYpWW80i" alt="" data-size="line">  button.

<figure><img src="/files/VIWrmKrCaZ636okZMNYp" alt=""><figcaption></figcaption></figure>

**To Delete the template** please select from templates list and click <img src="/files/nf7u3acW6GpON6dMOwqO" alt="" data-size="line"> button.

<figure><img src="/files/HRFfe9Xd5Vij0UH9XOjg" alt=""><figcaption></figcaption></figure>

Once entered you will see a new submenu with the list of your presets inside the drawing object menu. Additionally, you can assign hot keys to your templates. See more in the [hot keys](https://docs.agenatrader.com/tools/configuration-escort#Configuration_Escort__Hot_Keys) section.&#x20;

By left clicking the horizontal line  price you can manually enter the exact value using the keyboard.

<figure><img src="/files/dMH6LT8YsReptG20fnVq" alt=""><figcaption></figcaption></figure>

All drawing objects can be copied (Ctrl C ) and pasted (Ctrl V) within a chart or removed (Ctrl Del) from it. The indicators will not be deleted in this case

**Remove Drawings**

<img src="/files/LqMFqyHGEKgiFTkZB33b" alt="" data-size="line"> **Remove Object**: remove selected drawing object&#x20;

<img src="/files/F71DcB7xc1N0drLuWU1s" alt="" data-size="line"> **Remove All Objects**: remove all drawing objects.

<figure><img src="/files/VkTisSn9lWhhMZj6OmUq" alt=""><figcaption></figcaption></figure>

{% hint style="warning" %}
**Attention!** "Drawing objects only remain in the chart as long as the chart is opened in the workspace. Saving the workspace and shut down AgenaTrader will not remove the drawing objects. However when the chart is closed manually and hence is removed from the workspace all drawing objects will be removed as well and cannot be recovered."
{% endhint %}

#### **Global drawing objects**

**"Enable global drawings" = display drawing objects on all charts**:

<figure><img src="/files/uXsJpc2CsIOu8yOXi4Mg" alt=""><figcaption></figcaption></figure>

Click on the **Drawing tools** icon followed by the "Enable global drawings" menu item to display drawing objects on all charts. **"Show on all charts" = global display for a single drawing object**:

<figure><img src="/files/lDfp3xcvs3PJszBelM4f" alt=""><figcaption></figcaption></figure>

Double click on a drawing object to bring up the dialog box. Within the properties box, enable this functionality for a specific drawing object by checking the **Show on all charts** checkbox. Once enabled, the single drawing object for a particular instrument will be displayed on all charts.

For settings of specific drawing objects you then have to proceed as follows:

* Place the drawing object of your choice in the chart.
* With a double click on this object you brng up the dialog box
* Activate "Show on all all charts" by ticking the check box and then close dialog box.

**And vice versa:**

If you for example have a chart container showing 4 charts (eg. minute, hour, day and week) and you put a drawing object in the daily chart but also want to show it in one or all other charts of this instrument, you will have activate "Show on all charts" in the dialog box of your drawing object. Afterwards - and of course only if this function is not yet activated - you have to activate "Enable global drawings" in every chart you want this drawing object to be shown.

Likewise you can take over the drawing object - yet only within the actual workspace - into another chart container, eg. into the single chart of this instrument.

**"Show Marker" = If activated display drawings markers**:

<figure><img src="/files/egd90OuUzpU2FagISP6J" alt=""><figcaption></figcaption></figure>

**Drawing objects in the indicator panel**

You can apply drawing objects to the indicator panel the same way you draw them on the chart.

<figure><img src="/files/nHzFwTWishfaSN2QfIJZ" alt=""><figcaption></figcaption></figure>

{% hint style="warning" %}
**Attention!** "Trendlines that are created on highter times frames and watched in lower time frames are often missinterpreted. The following picture should clarify why the trend line can differ."
{% endhint %}

<figure><img src="https://docs.agenatrader.com/~gitbook/image?url=https%3A%2F%2F2805764894-files.gitbook.io%2F%7E%2Ffiles%2Fv0%2Fb%2Fgitbook-legacy-files%2Fo%2Fassets%252F-MKZSsJBtSP9L4sqIe_q%252F-MPn3oT4OcTPQ1g6g2-L%252F-MPnFfKSXKDRQnrG53wW%252FTrendline.png%3Falt%3Dmedia%26token%3D10cb0bde-f255-41f4-84e0-2b0f26b429fc&#x26;width=768&#x26;dpr=4&#x26;quality=100&#x26;sign=a54ed0a2&#x26;sv=1" alt=""><figcaption></figcaption></figure>

### Types of drawing objects

In this section, we provide a comprehensive description of all the available drawing objects. Each drawing object is detailed separately to ensure clarity and ease of understanding. Our aim is to give you a thorough insight into the features and functionalities of each object.

#### <img src="/files/iNvIDRmnOYUr03xGhD5k" alt="" data-size="line"> Text <a href="#text" id="text"></a>

Select **Text object** from the list to apply text to the chart.

<figure><img src="/files/VCZxatl887aWMqVxNYZ7" alt=""><figcaption></figcaption></figure>

If you need to add multiline text objects press **Shift+Enter** inside the text object. This enables you to edit the text with a double click.

<figure><img src="/files/3PzgF0Q8UdMHm16lSTM9" alt=""><figcaption></figcaption></figure>

#### <img src="/files/qlH1b1pLzB2fZIis0IEX" alt="" data-size="line"> Line shapes <a href="#line-shapes" id="line-shapes"></a>

AgenaTrader lets you locate different types of lines in the chart:

<figure><img src="/files/0KaupDUAaDE510Oy54HY" alt=""><figcaption></figcaption></figure>

#### <img src="/files/g95eXfnDkB7BplCtVBst" alt="" data-size="line"> **Trend line** <a href="#trend-line" id="trend-line"></a>

One of the methods of capturing the price movements is drawing a trend line. The basic principle is simple: the extreme points of "low" prices are connected with each other, creating an uptrend, and the extreme points of "high" prices are connected with each other, creating a downtrend.

<figure><img src="/files/XJvkSQGpFM3ITe3pN4Mv" alt=""><figcaption></figcaption></figure>

#### <img src="/files/ZxHNKyE9e524leWOh9BN" alt="" data-size="line"> **Trend line advanced** <a href="#trend-line-advanced" id="trend-line-advanced"></a>

This is the advanced version of a trend line, which extends indefinitely into the future. There are two points creating the advanced trend line - a starting point and the second point.

<figure><img src="/files/QIzVJg3x43EYbDSkcipI" alt=""><figcaption></figcaption></figure>

This trend line is automatically placed on the nearest opening, closing, high or low price of a candle. To deactivate this functionality double click on the trend line and then uncheck the **Is magnetized** checkbox inside the properties dialog box.

<figure><img src="/files/gf0RPwMvc6K0GZnWMVWB" alt=""><figcaption></figcaption></figure>

*Further drawing possibilities:*

* In order to draw a horizontal line, simply left click in the desired area.
* By default the line will be drawn from left to right but you can change this in the properties dialog box if necessary.

#### <img src="/files/hEHrXvKemXDLdctva1oe" alt="" data-size="line"> Geometric shapes <a href="#geometric-shapes" id="geometric-shapes"></a>

Various geometric shapes are available within the chart:

<figure><img src="/files/Oy8HG9u4gQpA22cLRuwk" alt=""><figcaption></figcaption></figure>

The image below shows several examples of geometric objects applied to the chart:

<figure><img src="/files/50Py4ivCyinqmMcm3d8W" alt=""><figcaption></figcaption></figure>

#### <img src="/files/MX3SiOtjl2os2vWY0jgG" alt="" data-size="line"> Chart markers <a href="#chart-markers" id="chart-markers"></a>

You can apply the following chart markers to a chart:

<img src="/files/SIzo3S4VsqlCPxqw3gdI" alt="" data-size="line"> Dots

<img src="/files/TtxDg7amrDKINJ2br9zb" alt="" data-size="line"> Squares

<img src="/files/DRsmUvisrPvYVO0JDUU6" alt="" data-size="line"> Diamonds

<figure><img src="/files/mZk2vZB7U7lPuUNzj0Vc" alt=""><figcaption></figcaption></figure>

#### <img src="/files/xGo9Ew1T4Vjy6P21m36Y" alt="" data-size="line"> Fibonacci shapes <a href="#fibonacci-shapes" id="fibonacci-shapes"></a>

The Fibonacci sequence was discovered in the 13th century by mathematician Leonardo Fibonacci (Pisano Bogollo). The sequence is as follows: 0,1,1,2,3,5,8,13,21,34,55,89,144,233 and so on. In this sequence, each number (after the first 1) is the sum of the two numbers before it. The interesting characteristic of this sequence is that dividing any number by the following number approximates the ratio 0.618. Dividing any number by the number two places above it (e.g. 5/13) approximates a ratio of 0.382. The larger the numbers, the nearer the approximate value draws to the values 0.382 and 0.618. Other approximate ratios from dividing other numbers are 0.236; 0.5; 0.764; 1.382; 1.618 etc.

In technical analysis these numbers correspond to retracement levels and provide hints about potential corrections, trend reversal, and areas of resistance or support. Retracements are based on the prior price movements and are used to forecast the length of a trend/correction. The most common Fibonacci levels are 23.6%, 38.2%, 50% and 61.8% . Using Fibonacci retracements in a combination with other technical analysis tools will improve the effectiveness of your trading.

&#x20;<img src="/files/gXJCMt4fZhNHait2ly2H" alt="" data-size="line">Time zones and  <img src="/files/xGo9Ew1T4Vjy6P21m36Y" alt="" data-size="line"> retracements

<figure><img src="/files/XCTqL1VdN2moBWvFaXOs" alt=""><figcaption></figcaption></figure>

&#x20;<img src="/files/7y1OcSkKJOxp4bgcMVQD" alt="" data-size="line"> Fans and  <img src="/files/kK8L1JKGbhXwrCijsuHL" alt="" data-size="line"> arcs

<figure><img src="/files/JIpHnJ8UcpDxkWZMdDKm" alt=""><figcaption></figcaption></figure>

<img src="/files/xGo9Ew1T4Vjy6P21m36Y" alt="" data-size="line"> Projections

Correct use of Projections: select the **Projection** and select the first point in the chart. Press and hold the left mouse button and navigate to the next point in the chart and release the mouse button. Finish the projection by navigating to the last point in the chart and click the left mouse button again. If you don't hold the mouse button in the beginning the projection will not be displayed properly.

<figure><img src="/files/J2yGQs0esWnQ21u1Nujy" alt=""><figcaption></figcaption></figure>

**Extended dialog**

You can change Fibonacci levels, color, and line style inside the extended dialog window for this drawing object:

<figure><img src="/files/8ViI2H4opzYq7WBI51Jj" alt=""><figcaption></figcaption></figure>

The extended dialog window offers the selection of the following possibilities:

| Function            | Meaning                                                                        |
| ------------------- | ------------------------------------------------------------------------------ |
| Right Aligned       | If enabled, this extends the Fibonacci levels to the right of the screen.      |
| Is Magnetized       | If enabled, the anchor lines are magnetized when drawing the Fibonacci levels. |
| Display Percents    | If enabled, shows percentages                                                  |
| Display Price       | If enabled, shows a price                                                      |
| Extend Left         | If enabled, extends lines to the left                                          |
| Extend Right        | If enabled, extends lines to the right                                         |
| Display Anchor Line | If enabled, displays an anchor line                                            |
| Lock                | If enabled, prevents you from making changes                                   |
| Auto Scale          | If enabled, scales the object automatically                                    |
| Show On All Charts  | If enabled, shows Fibonacci drawing object on all charts                       |

**Delete the whole object or single levels** After the drawing object has been created it can be selected by the left mouse click and deleted by pressing the **Del** button on the keyboard. Besides, you can delete a single object level by pressing and holding the **Shift** button on the keyboard and left clicking the mouse button.

{% hint style="warning" %}
**Attention!** AgenaTrader saves the settings of the latest drawing object, therefore a new object will be displayed in the same manner. It means that deleted levels will not be shown anymore when using a new Fibonacci object. In order to activate the display of all levels double-click on the object and edit the object settings manually inside the popup.
{% endhint %}

<figure><img src="/files/KMpqzv5DvqpQkdif2xEu" alt=""><figcaption></figcaption></figure>

#### <img src="/files/MElCF3ZXwrFAD1AZ44iH" alt="" data-size="line"> Speed Resistance Line <a href="#speed-resistance-line" id="speed-resistance-line"></a>

Speed resistance lines serve to estimate potential areas of support or resistance. The tool was developed by Edson Gould and is similar to the Gann Fan or the Fibonacci Fan. Speed resistance lines consist of three trend lines; the first line extends from a low to a high (uptrend) or from a high to a low (downtrend). The other resistance lines are displayed below (or above) at 1/3 and 2/3 intervals of the original line.

<figure><img src="/files/UaJkddLv8RT1i2R76Hok" alt=""><figcaption></figcaption></figure>

#### <img src="/files/cFUoGHi9Y3SQn0vtT36u" alt="" data-size="line"> Gann Fan Up / Gann Fan Down <a href="#gann-fan-up-gann-fan-down" id="gann-fan-up-gann-fan-down"></a>

The Gann Fan is an analytical tool developed by professional broker W\.D. Gann. It shows how prices that have originated from significant highs or lows have developed over time, and can help to identify potential trend reversals or to predict price movements. The lines extend from one point (high or low) dividing the charting area into proportional parts. Gann considered the prime line (1x1 = 45°) to be the most important. If the current price is above the 45° line this indicates a bull market, and if it is below the 45° line this indicates a bear market. Gann interprets the 1x1 line (45°) as a strong support or resistance line (depending which direction the market is moving in).

*Other important Gann angles:* 1x8 - 82.5 degrees 1x4 - 75 degrees 1x3 - 71.25 degrees 1x2 - 63.75 degrees 1x1 - 45 degrees 2x1 - 26.25 degrees 3x1 - 18.75 degrees 4x1 - 15 degrees 8x1 - 7.5 degrees

The following image shows the Gann Fan applied to the chart:

<figure><img src="/files/B0Obr1kOu7vCoi3wj0Ue" alt=""><figcaption></figcaption></figure>

#### <img src="/files/9yqYcJaFIwU8Cl6WD9Fu" alt="" data-size="line"> Andrew's Pitchfork <a href="#andrews-pitchfork" id="andrews-pitchfork"></a>

Andrew’s Pitchfork is not a primary but a supplementary tool in trading, since it is not as commonly used on a daily basis as other indicators (trend lines, regression channels etc.). Nevertheless, Andrew's Pitchfork can be used as a supporting indicator to solidify existing analyses. Andrew's Pitchfork was developed by Dr. Alan Andrews decades ago, and consists of three parallel trend lines that extend into the charting space. The composition of the lines resembles a pitchfork, which gives this instrument its name. The lower and upper line represent zones of support and resistance.

<figure><img src="/files/kKfyMAwgEGdormthOA7r" alt=""><figcaption></figcaption></figure>

You can apply this drawing object to the chart in all time intervals. In an uptrend, the lower line acts as a support line, the middle line defines the strength of a trend and the upper line acts as a resistance line. 'Swing' traders developed Andrew's Pitchfork even further by drawing the additional parallel line between the support and resistance lines. This line is used each time the price reaches the corresponding support or resistance line.

#### <img src="/files/Q0OP3Jex9s1ukBpkE3bn" alt="" data-size="line"> Tirone Levels <a href="#tirone-levels" id="tirone-levels"></a>

Tirone levels (developed by John Tirone) are a series of three horizontal lines that, like the Fibonacci levels or quadrant lines, represent support or resistance levels. The calculation of Tirone levels is based upon the lowest low and the highest high during a specified time interval:

* The middle line is calculated as the difference between the high and low points divided by 2.
* The upper line is calculated as the difference between the high and low points divided by 3.
* The lower line is the difference between the high and low points adjusted by the coefficient 2/3.

<figure><img src="/files/iA4w5u5GnnozoLpX7NnU" alt=""><figcaption></figcaption></figure>

#### <img src="/files/MupQwVOx1yEHI1tGCZAv" alt="" data-size="line"> Quadrant Lines <a href="#quadrant-lines" id="quadrant-lines"></a>

Quadrant lines divide the price area into four equally sized areas. There are five lines and four quadrants, which are calculated as follows:

* The upper line corresponds to the high price
* The lower line corresponds to the low price
* The middle line retraces 50% of the price range.
* The other two lines are calculated as a sum of the previous line level and quadrant size.

The quadrant lines are not considered to be a typical indicator, but more of a stick of price action. The lines allow a technical analyst to visualize the quantification of price levels relative to the price range.

<figure><img src="/files/fP5oVMsiRitMT6BTLKxG" alt=""><figcaption></figcaption></figure>

#### <img src="/files/q242n5iQnCvxFq8wexug" alt="" data-size="line"> Raff Regression Channel <a href="#raff-regression-channel" id="raff-regression-channel"></a>

The Raff regression channel is a linear regression tool consisting of a line fitting the price series as closely as possible, as estimated by the ordinal least squares (OLS) method, and two lines of equal distance from this line.

This drawing object will be applied to the chart in the following way:

* First, a straight line for the closing prices is drawn using the OLS approach. This method allows you to place the regression line in such a way that the distance from this line to each closing price is minimal. In other words, the regression line represents the best fit for closing prices for the considered period.
* Once the line is estimated, the first parallel line is shifted to the first high or low point.
* In the next step, the second trend line is drawn on the other side of the regression line so that the distance between the regression line and both trend lines is equal. Thus, the regression line is drawn exactly in the middle of the falling trend channel.

<figure><img src="/files/NynPBfXbO5HsE2LTEpB5" alt=""><figcaption></figcaption></figure>

Now the regression channel consisting of 3 lines is complete and much more precise than if you were to draw this manually.

#### <img src="/files/albLvoqfPhszpZ3NGwjd" alt="" data-size="line"> Trend channel <a href="#trend-channel" id="trend-channel"></a>

The trend channel can be drawn by hand. To apply this drawing object to a chart, select a low or high point on the chart and connect this to another low or high point. The opposite parallel line will be adjusted accordingly.

<figure><img src="/files/hzFdCFNEsYj1jnExqjyb" alt=""><figcaption></figcaption></figure>

#### <img src="/files/Yow94swU9gUG6i6LDupe" alt="" data-size="line"> Free Hand Drawing <a href="#free-hand-drawing" id="free-hand-drawing"></a>

Use the **Free Hand Drawing** option to make various markings on a chart.

<figure><img src="/files/pHr1UmWNOuuQn958yxa8" alt=""><figcaption></figcaption></figure>

#### <img src="/files/XXhKIlOnadMxSo2dtvXY" alt="" data-size="line">Chart distance meter <a href="#chart-distance-meter" id="chart-distance-meter"></a>

Use the **Chart distance meter** option to increase or decrease the distance from price, bars & percent.

<figure><img src="/files/2eoxJtnEMJCcE5bS1Ddi" alt=""><figcaption></figcaption></figure>

## <img src="/files/Mk00Tv4hKT75WfXWffGz" alt="" data-size="line"> Indicators

This section provides a way for you to create, edit and apply various indicators to the chart. More detailed descriptions of indicators can be found on our [Github indicator help](https://agenatrader.github.io/AgenaIndicator-documentation/index.html).

*In order to apply indicators to a chart use one of the options:*

1. Left click on the <img src="/files/tVlmg8MjU97obNumaUTE" alt="" data-size="line"> icon within the chart toolbar.
2. Right click in the charting area to bring up the chart
   1. context menu, then select **Settings** followed by the **Indicators** menu item.

This will open the **Indicators popup window**, which contains 5 different lists:

<figure><img src="/files/95bCj5ZVavMmlCnCORp0" alt=""><figcaption></figcaption></figure>

| Name | Description |
| ---- | ----------- |

| Indicators | Shows standard indicators integrated into the AgenaTrader trading platform |
| ---------- | -------------------------------------------------------------------------- |

| Premium indicators | Shows indicators from add-on packages |
| ------------------ | ------------------------------------- |

| [Custom](https://docs.agenatrader.com/create-your-own-trading-strategy/scripting#Scripting__Programming_of_indicators) | Shows self-programmed or imported indicators |
| ---------------------------------------------------------------------------------------------------------------------- | -------------------------------------------- |

| [Conditions](https://docs.agenatrader.com/create-your-own-trading-strategy/condition-escort) | Shows conditions entered in the Signal Builder |
| -------------------------------------------------------------------------------------------- | ---------------------------------------------- |

| [Scripted conditions](https://docs.agenatrader.com/create-your-own-trading-strategy/scripting#Scripting__Programming_of_conditions) | Shows self-programmed conditions |
| ----------------------------------------------------------------------------------------------------------------------------------- | -------------------------------- |

{% hint style="info" %}
**Important!** If you want to find out more about each specific indicator, you can find detailed description [here](https://agenatrader.github.io/AgenaIndicator-documentation/index.html)
{% endhint %}

The dialog window consists of three parts:

1. List of available indicators
2. List of selected indicators
3. Parameters box

The buttons inside the popup window have the following functions:

* ОК: accepts all defined settings and closes the dialog window.
* Apply: accepts all settings but does not close the dialog window.
* Cancel: closes the dialog window without saving the changes.

Please note:

<figure><img src="/files/r4OQgc4N4nJI6FexCTMx" alt=""><figcaption></figcaption></figure>

Show Candles At Front: if this function is activated, all indicators are displayed behind the chart candles or other styles.

### List of available indicators <a href="#list_of_available_indicators" id="list_of_available_indicators"></a>

The list of available indicators can be found within the three sections of the **Indicators window**.

For better performance user may use Indicator Search function. You can search indicators through subcategories:

<figure><img src="/files/8nQPgJSa9heEq2iTqqXk" alt=""><figcaption></figcaption></figure>

*The list is divided into the following subcategories:*

* **Standard system indicators** (AgenaTrader offers approx.100 standard indicators),
* **Cumulative Indices.** Only displayed and can be added to the chart if connected to one of the following datafeeds: Taipan, IQFeed or Barchart. They display an oscillator of cumulated data of the specific index.

<figure><img src="https://docs.agenatrader.com/~gitbook/image?url=https%3A%2F%2F2805764894-files.gitbook.io%2F%7E%2Ffiles%2Fv0%2Fb%2Fgitbook-legacy-files%2Fo%2Fassets%252F-MKZSsJBtSP9L4sqIe_q%252F-MPnJBQf73uIOGhK2XwX%252F-MPnKZGrLaoopU0wQm-2%252FCumulative%2520indices.png%3Falt%3Dmedia%26token%3D31ac3712-41a4-4f64-9cae-acb8fd8eed7d&#x26;width=768&#x26;dpr=4&#x26;quality=100&#x26;sign=d5e22cae&#x26;sv=1" alt=""><figcaption></figcaption></figure>

* **Premium indicators**
* **Scripted indicators** (self-programmed),
* **Conditions in the** Signal Builder
* **Scripted condition**

<figure><img src="/files/95bCj5ZVavMmlCnCORp0" alt=""><figcaption></figcaption></figure>

Double click on a selected indicator would add it to indicator list.

### List of selected indicators <a href="#list_of_selected_indicators" id="list_of_selected_indicators"></a>

This section displays all indicators and conditions applied to the chart or just added from the list of available indicators.

<figure><img src="/files/EM5bcMHCoYKXDVSQc2vW" alt=""><figcaption></figcaption></figure>

Click the **Remove** button to delete an indicator from this list. Left clicking on an indicator will make it "active" in the parameters section and allow you to modify parameters. Click the **OK** or **Apply** button to save new settings for an indicator and apply it to the chart.

### Parameters box <a href="#parameters_box" id="parameters_box"></a>

The parameter box on the right hand side of the **Parameter window** displays the indicator-specific settings that are available for editing.

<figure><img src="/files/be16Qzwb4Psxez4pNhgw" alt=""><figcaption></figcaption></figure>

In this section we will see which parameters can be changed within the parameter box.

#### General settings <a href="#general-settings" id="general-settings"></a>

You can change the following parameters:

* **Auto adjusted:** Default setting is "false". In this case the indicator will be displayed inside a separate panel below the chart. If set to "true", the indicator is a part of the chart panel's scaling and is always fully visible on the chart. This means that if the indicator's extreme values are far away from the market value, then the chart display will be adjusted in such a way as to show the indicator completely.

<figure><img src="https://docs.agenatrader.com/~gitbook/image?url=https%3A%2F%2F2805764894-files.gitbook.io%2F%7E%2Ffiles%2Fv0%2Fb%2Fgitbook-legacy-files%2Fo%2Fassets%252F-MKZSsJBtSP9L4sqIe_q%252F-MPnJBQf73uIOGhK2XwX%252F-MPnKqIq8RzrLOcaImlO%252FparameterBox3.png%3Falt%3Dmedia%26token%3Dcee138a2-93fb-435c-af6a-a6cfb04c95df&#x26;width=768&#x26;dpr=4&#x26;quality=100&#x26;sign=50490d84&#x26;sv=1" alt=""><figcaption></figcaption></figure>

* **Calc. on finished Bars:** allows to change the calculation mode from close price to every new tick. If set to "false" **Calculation Updates Times Frame** parameter appears which allows selecting a timeframe in which the indicator is re-calculated. If set to "true", AgenaTrader will calculate the indicator each time a bar has been closed and the next tick is sent.

{% hint style="warning" %}
**ATTENTION!** the calculation of some (especially self-programmed) indicators can be quite complex. If your workspace contains too many indicators with **Calculate on bar close** set to "false", AgenaTrader's performance may be negatively affected.
{% endhint %}

* **Caption:** displays the technical descriptions. You can change these settings if required. For example, to display a shorter name for an indicator (BB-W instead of BBWidth) input the following information: (Close, 2, 20) -> BB-W.
* **Display in Chart Box:** if set to "true", the indicator values will be displayed in the chart box when you left click on the chart.

<figure><img src="/files/Tql2y7rj4uMB0Tb1xpif" alt=""><figcaption></figcaption></figure>

* **Left/Right shifting:** shifts the indicator to the left or right.
* **Bars required:** defines the number of periods after which the indicator will be shown. For example, SMA(20) requires at least 20 periods (bars) to correctly calculate the moving average.
* **Show price scale markers :** if set to "true", the indicator values within the price scale on the right side of the chart will be shown in color.

<figure><img src="/files/DusPMRHiAYbSaa8tUgVE" alt=""><figcaption></figcaption></figure>

#### Input settings <a href="#input-settings" id="input-settings"></a>

You can change the following parameters:

* **InSeries:** allows you to select data series for which the indicator should be calculated. The standard setting is "close", which means that the indicator will be calculated based on the closing prices of a specific period. Other available options are displayed below::

<figure><img src="/files/HwqmEU5zBGdzKep8PIfS" alt=""><figcaption></figcaption></figure>

This image displays the settings for calculating the Bollinger Bands indicator based on RSI values:

<figure><img src="/files/ECy3V2ajGkzO7H1vH5II" alt=""><figcaption></figcaption></figure>

Once you have confirmed the changes, the RSI indicator will be displayed in the same panel as the Bollinger band:

<figure><img src="/files/BUOhmCBCNEKkgsIK4Boh" alt=""><figcaption></figcaption></figure>

* **Instrument:** allows you to select a data series from a different instrument for which the indicator should be calculated. The default setting corresponds to the instrument for which the indicator was selected.
* **Time-Frame:** allows you to display the indicator for the current instrument within different time frames on the same chart. For example, on the 1-day EURUSD chart, the same indicator SMA(14) is displayed in two time frames simultaneously: 1 hour and 1 week.

<figure><img src="https://docs.agenatrader.com/~gitbook/image?url=https%3A%2F%2F2805764894-files.gitbook.io%2F%7E%2Ffiles%2Fv0%2Fb%2Fgitbook-legacy-files%2Fo%2Fassets%252F-MKZSsJBtSP9L4sqIe_q%252F-MPnJBQf73uIOGhK2XwX%252F-MPnLPbfBIgZLWj7t_kw%252FparameterBox10.png%3Falt%3Dmedia%26token%3D5dacc0c4-5c1c-4d96-ada1-ea618b189322&#x26;width=768&#x26;dpr=4&#x26;quality=100&#x26;sign=27a8a2de&#x26;sv=1" alt=""><figcaption></figcaption></figure>

#### Parameters settings <a href="#parameters-settings" id="parameters-settings"></a>

These settings display indicator-specific parameters. If you change the values here, the behavior of the indicator also changes.

<figure><img src="/files/iIe5AQIwVLOaaQ5c1RCQ" alt=""><figcaption></figcaption></figure>

#### Visual settings <a href="#visual-settings" id="visual-settings"></a>

These settings allow you to customize the appearance of the indicator.

You can change the following parameters:

* **Levels:** allow you to edit the indicator lines by setting the following parameters:
  * Appearance (dotted, striped, etc.)
  * Color
  * Width
  * Line value

<figure><img src="/files/zngLbGTETQlIM9ZPnnV6" alt=""><figcaption></figcaption></figure>

* **Chart Panel:** allows you to customize the appearance and style of specific indicators and to display several indicators within the same panel.

<figure><img src="/files/35r7luEmwDQ72f4CuQB2" alt=""><figcaption></figcaption></figure>

If you select **Chart Panel** the indicator will be linked to the input series. As in the previous example, you can display the RSI in the same panel as the Bollinger bands.

* **Outputs:** pertains to the visual display for the indicator output values. The following changes can be made:
  * Indicator name
  * Appearance (dotted, striped, etc.)
  * Color
  * Line width

<figure><img src="/files/ZMU9VNpo0HKppMOu2FAL" alt=""><figcaption></figcaption></figure>

#### Visualization settings <a href="#visualization-settings" id="visualization-settings"></a>

These settings allow you to apply a color to the area between two indicator lines.

<figure><img src="/files/T79MXQjhLLnTFlav0Jkl" alt=""><figcaption></figcaption></figure>

**Outputs Display Style**

Offers three style settings for displaying prices.

<figure><img src="https://docs.agenatrader.com/~gitbook/image?url=https%3A%2F%2F2805764894-files.gitbook.io%2F%7E%2Ffiles%2Fv0%2Fb%2Fgitbook-legacy-files%2Fo%2Fassets%252F-MKZSsJBtSP9L4sqIe_q%252F-MPnJBQf73uIOGhK2XwX%252F-MPnLpYlxVbiiPR6o-Bx%252FparameterBox17.png%3Falt%3Dmedia%26token%3D6300986a-4e5d-4d05-9a24-99ed74549dac&#x26;width=768&#x26;dpr=4&#x26;quality=100&#x26;sign=80d00e4c&#x26;sv=1" alt=""><figcaption></figcaption></figure>

## <img src="/files/F9MBb6L5PrW7HXzrmspV" alt="" data-size="line"> Strategies

*To open the strategy dialog window, which allows you to apply self-programmed or 3rd party strategies to the chart:*

1. Left click on the  icon <img src="/files/0g4kCsRV6cVRhfrAwsFG" alt="" data-size="line"> within the chart toolbar.
2. Right click in the charting area to bring up the chart context menu, then select **Settings** followed by the **Strategies** menu item.

Then the **Strategies dialog window** will be opened:

<figure><img src="https://docs.agenatrader.com/~gitbook/image?url=https%3A%2F%2F2805764894-files.gitbook.io%2F%7E%2Ffiles%2Fv0%2Fb%2Fgitbook-legacy-files%2Fo%2Fassets%252F-MKZSsJBtSP9L4sqIe_q%252F-MPnJBQf73uIOGhK2XwX%252F-MPnM63IUeOt_T9Mwp8T%252FStrategies.png%3Falt%3Dmedia%26token%3Dfcfc012b-a560-48aa-83eb-ac611482dc4b&#x26;width=768&#x26;dpr=4&#x26;quality=100&#x26;sign=5aa5974a&#x26;sv=1" alt=""><figcaption></figcaption></figure>

The dialog window consists of 3 sections:

1. List of available strategies
2. List of selected strategies
3. Strategies: Parameters box

The buttons inside the popup window have the following functions:

* ОК: accepts all defined settings and closes the dialog window.
* Apply: accepts all settings but does not close the dialog window.
* Cancel: closes the dialog window without saving the changes.

Strategies can be started manually:

* from the chart,
* from the watch list (scanner),
* from the list chart group and
* within the StrategyEscort.

### List of available strategies <a href="#list_of_available_strategies" id="list_of_available_strategies"></a>

The list of available strategies can be found within the three sections of the **Strategies window**.

For better performance user may use Strategies Search function.

Indicator Search

Double-clicking or clicking the **New** button will add the selected strategy to the strategy list.

**Please note that only one strategy can be run on a chart.**

<figure><img src="https://docs.agenatrader.com/~gitbook/image?url=https%3A%2F%2F2805764894-files.gitbook.io%2F%7E%2Ffiles%2Fv0%2Fb%2Fgitbook-legacy-files%2Fo%2Fassets%252F-MKZSsJBtSP9L4sqIe_q%252F-MPnJBQf73uIOGhK2XwX%252F-MPnMENqC65twmVqheOi%252FStrategies%2520%281%29.png%3Falt%3Dmedia%26token%3D33d6518b-f271-43ac-95c5-33c7e399989a&#x26;width=768&#x26;dpr=4&#x26;quality=100&#x26;sign=b411deb0&#x26;sv=1" alt=""><figcaption></figcaption></figure>

#### List of selected strategies <a href="#list_of_selected_strategies" id="list_of_selected_strategies"></a>

This section displays all strategies currently running on the chart or just added from the list of available strategies.

<figure><img src="https://docs.agenatrader.com/~gitbook/image?url=https%3A%2F%2F2805764894-files.gitbook.io%2F%7E%2Ffiles%2Fv0%2Fb%2Fgitbook-legacy-files%2Fo%2Fassets%252F-MKZSsJBtSP9L4sqIe_q%252F-MPnJBQf73uIOGhK2XwX%252F-MPnMJpGKn1YuSNV_2O0%252Flist1.PNG%3Falt%3Dmedia%26token%3D39963e13-e4f5-45d8-b4ea-be6cc5f47b41&#x26;width=768&#x26;dpr=4&#x26;quality=100&#x26;sign=272c7161&#x26;sv=1" alt=""><figcaption></figcaption></figure>

Click the **Remove** button to delete a strategy from this list. Left clicking on a strategy will make it "active" in the parameters section and will allow you to modify parameters. Click the **OK** or **Apply** button to save new settings for a strategy and apply it to the chart.

#### Parameters box <a href="#parameters_box" id="parameters_box"></a>

The parameter box on the right hand side of the **Parameters window** displays the strategy-specific settings available for editing.

<figure><img src="https://docs.agenatrader.com/~gitbook/image?url=https%3A%2F%2F2805764894-files.gitbook.io%2F%7E%2Ffiles%2Fv0%2Fb%2Fgitbook-legacy-files%2Fo%2Fassets%252F-MKZSsJBtSP9L4sqIe_q%252F-MPnJBQf73uIOGhK2XwX%252F-MPnMMrEVh6hwkGCnvzv%252FparameterBox_strategy1.png%3Falt%3Dmedia%26token%3D9eb756f2-e9b9-48da-9f5e-476cc76d0e2c&#x26;width=768&#x26;dpr=4&#x26;quality=100&#x26;sign=2139d1a8&#x26;sv=1" alt=""><figcaption></figcaption></figure>

In this section we will see which parameters can be changed within the parameter box.

**General settings**

You can change the following parameters:

* Bars required: defines the number of periods after which the strategy will be calculated (adjusted). For example, SMA(20) requires at least 20 periods (bars) to correctly calculate the moving average and consequently formulate accurate conclusions for the strategy calculation. It is especially important for the backtesting.
* Calculate on bar close: if set to "false", the strategy will be calculated each time a tick occurs. If set to "true", AgenaTrader will calculate the strategy each time a bar has been closed and the next tick is sent.

{% hint style="warning" %}
**ATTENTION!** The adjustment of a strategy can be quite complex. If your workspace contains too many strategies running at the same time with **Calculate on bar close** set to "false", AgenaTrader's performance may be affected negatively.
{% endhint %}

* Caption: displays a strategy's technical description. You can change these settings if required. For example, to display a shorter name for the strategy (MMR instead of MakeMeRichStrategy) input the following information: MakeMeRichStrategy -> MMR.
* Input Price Type: allows you to select data series for strategy calculation. The standard setting is "close", which means that the strategy will be calculated based on the closing prices of a specific period. Other available options are displayed below:

<figure><img src="https://docs.agenatrader.com/~gitbook/image?url=https%3A%2F%2F2805764894-files.gitbook.io%2F%7E%2Ffiles%2Fv0%2Fb%2Fgitbook-legacy-files%2Fo%2Fassets%252F-MKZSsJBtSP9L4sqIe_q%252F-MPnJBQf73uIOGhK2XwX%252F-MPnMThtAAPjVnVEFNTj%252FparameterBox_strategy2.png%3Falt%3Dmedia%26token%3D3671f083-f1cc-40ba-bc5e-08a5564ca2b5&#x26;width=768&#x26;dpr=4&#x26;quality=100&#x26;sign=d89a70c&#x26;sv=1" alt=""><figcaption></figcaption></figure>

**Parameters settings**

These settings allow you to enter strategy-specific parameters. If you change these values, the strategy's behavior will also change.

<figure><img src="https://docs.agenatrader.com/~gitbook/image?url=https%3A%2F%2F2805764894-files.gitbook.io%2F%7E%2Ffiles%2Fv0%2Fb%2Fgitbook-legacy-files%2Fo%2Fassets%252F-MKZSsJBtSP9L4sqIe_q%252F-MPnJBQf73uIOGhK2XwX%252F-MPnMZJGZu1PngZ00GPm%252FparameterBox_strategy3.png%3Falt%3Dmedia%26token%3Df7afebb6-d939-4e39-83c4-3cda07d97458&#x26;width=768&#x26;dpr=4&#x26;quality=100&#x26;sign=911b1357&#x26;sv=1" alt=""><figcaption></figcaption></figure>

**Strategy settings**

You can change the following parameters:

* DefaultQuantity: If there is no possibility of overruling the order size for a strategy, the default quantity will be retrieved from the instrument-specific settings in the [Instrument Editor](https://docs.agenatrader.com/tools/instrument-escort). The default quantity cannot be entered here.
* TraceOrders: If set to "true", information about all executed orders will appear in the [messages window](https://docs.agenatrader.com/tools/system-information). This functionality serves informational purposes only. You can also view this information within the [Trading Information: Order Manager](https://docs.agenatrader.com/tools/trading-information#Trading_Information__Order_Manager).

<figure><img src="https://docs.agenatrader.com/~gitbook/image?url=https%3A%2F%2F2805764894-files.gitbook.io%2F%7E%2Ffiles%2Fv0%2Fb%2Fgitbook-legacy-files%2Fo%2Fassets%252F-MKZSsJBtSP9L4sqIe_q%252F-MPnJBQf73uIOGhK2XwX%252F-MPnMbcMoXTTrDMJfn3W%252FparameterBox_strategy4.png%3Falt%3Dmedia%26token%3Df079f931-0fab-44e0-a748-17782309ca0c&#x26;width=768&#x26;dpr=4&#x26;quality=100&#x26;sign=1c725e89&#x26;sv=1" alt=""><figcaption></figcaption></figure>

## &#x20;<img src="/files/lWRYqxMWYUqxvENvxi2X" alt="" data-size="line"> Start AgenaTrader (plusplus)

*To activate AgenaTrader++ (plusplus) for the selected time frame use one of the options:*

1. Left click on the <img src="/files/lWRYqxMWYUqxvENvxi2X" alt="" data-size="line"> icon within the chart toolbar.
2. Right click in the charting area to bring up the chart context menu, then select **Settings** followed by the **Start AgenaTrader++** menu item.

Two "++" signs displayed next to the logo at the bottom left of the chart will indicate that AgenaTrader++ (plusplus) has been activated. This visualization helps you to identify which strategy is currently running on the chart.

<figure><img src="https://docs.agenatrader.com/~gitbook/image?url=https%3A%2F%2F2805764894-files.gitbook.io%2F%7E%2Ffiles%2Fv0%2Fb%2Fgitbook-legacy-files%2Fo%2Fassets%252F-MKZSsJBtSP9L4sqIe_q%252F-MPnJBQf73uIOGhK2XwX%252F-MPnMkFxSoVULrGbEsLS%252FAT%252B%252B.png%3Falt%3Dmedia%26token%3D4c881e14-45b1-4adb-bdf6-b8c7fc2c612a&#x26;width=768&#x26;dpr=4&#x26;quality=100&#x26;sign=85831076&#x26;sv=1" alt=""><figcaption></figcaption></figure>

You can also keep track of the running strategies within the [Strategy Escort](https://docs.agenatrader.com/create-your-own-trading-strategy/strategy-escort). By clicking on the ![Icon23](https://docs.agenatrader.com/~gitbook/image?url=https%3A%2F%2F2805764894-files.gitbook.io%2F%7E%2Ffiles%2Fv0%2Fb%2Fgitbook-legacy-files%2Fo%2Fassets%252F-MKZSsJBtSP9L4sqIe_q%252F-MPnJBQf73uIOGhK2XwX%252F-MPnMn7IDQblprhSb-6X%252Ficon23.png%3Falt%3Dmedia%26token%3D6ca73635-ef58-46d3-a780-6ccc57c61163\&width=300\&dpr=4\&quality=100\&sign=f947f2bf\&sv=1) symbol you can select which [**Analyzer Session**](https://docs.agenatrader.com/create-your-own-trading-strategy/setup-escort#analyzer-sessions-1) should be scanned for.

You can find further information on the functionalities of AgenaTrader++ (plusplus) in the section: [AgenaTrader++ and further versions](https://docs.agenatrader.com/faq/more-help#general-information).

## <img src="/files/xktKVezbesRatgYz0Vzd" alt="" data-size="line"><img src="/files/PsOJ1JgwlzrYvuDnlkLE" alt="" data-size="line"> Zoom

Using the<img src="/files/xktKVezbesRatgYz0Vzd" alt="" data-size="line"> <img src="/files/PsOJ1JgwlzrYvuDnlkLE" alt="" data-size="line"> zoom icons in the toolbar you can zoom in and zoom out on the current chart.

<figure><img src="https://docs.agenatrader.com/~gitbook/image?url=https%3A%2F%2F2805764894-files.gitbook.io%2F%7E%2Ffiles%2Fv0%2Fb%2Fgitbook-legacy-files%2Fo%2Fassets%252F-MKZSsJBtSP9L4sqIe_q%252F-MPnJBQf73uIOGhK2XwX%252F-MPnMuJDNJ5eq63IpCyL%252FZoom%281%29.jpg%3Falt%3Dmedia%26token%3D6d027aac-1cd7-4b8d-a0b2-0c967589c0cb&#x26;width=768&#x26;dpr=4&#x26;quality=100&#x26;sign=3609fcb6&#x26;sv=1" alt=""><figcaption></figcaption></figure>

**Zoom in on a chart frame area**

To create a zoom area on a chart, click and hold the right mouse button whilst marking the desired zoom frame.

<figure><img src="https://docs.agenatrader.com/~gitbook/image?url=https%3A%2F%2F2805764894-files.gitbook.io%2F%7E%2Ffiles%2Fv0%2Fb%2Fgitbook-legacy-files%2Fo%2Fassets%252F-MKZSsJBtSP9L4sqIe_q%252F-MPnJBQf73uIOGhK2XwX%252F-MPnMxnZz3G341YKR8uJ%252FZoom%282%29.jpg%3Falt%3Dmedia%26token%3Da4e049b9-4ba1-4ed5-925a-c72c354570f1&#x26;width=768&#x26;dpr=4&#x26;quality=100&#x26;sign=326c4ba2&#x26;sv=1" alt=""><figcaption></figcaption></figure>

Once you release the right mouse button, the selected frame area will be displayed in full on the chart.

<figure><img src="https://docs.agenatrader.com/~gitbook/image?url=https%3A%2F%2F2805764894-files.gitbook.io%2F%7E%2Ffiles%2Fv0%2Fb%2Fgitbook-legacy-files%2Fo%2Fassets%252F-MKZSsJBtSP9L4sqIe_q%252F-MPnJBQf73uIOGhK2XwX%252F-MPnN0GpO52bISj4DWMC%252FZoom%283%29.jpg%3Falt%3Dmedia%26token%3D33cdce14-aecc-4590-8b24-a13d65292921&#x26;width=768&#x26;dpr=4&#x26;quality=100&#x26;sign=8467cfd5&#x26;sv=1" alt=""><figcaption></figcaption></figure>

To undo the selected zoom level, double click the time scale at the bottom of the chart or click the arrow at the top right of the chart.

## <img src="/files/einaYuSW2NKQTZHKO4qd" alt="" data-size="line">Show All History

Click this button to display the entire loaded history in the chart with a single mouse click.

*In order to display the whole price history on a chart use one of the methods:*

1. Left click on the <img src="/files/einaYuSW2NKQTZHKO4qd" alt="" data-size="line"> icon within the chart toolbar.
2. Right click in the charting area to bring up the chart context menu, then select **Settings** followed by the **Show all history** menu item.

<figure><img src="https://docs.agenatrader.com/~gitbook/image?url=https%3A%2F%2F2805764894-files.gitbook.io%2F%7E%2Ffiles%2Fv0%2Fb%2Fgitbook-legacy-files%2Fo%2Fassets%252F-MKZSsJBtSP9L4sqIe_q%252F-MPnJBQf73uIOGhK2XwX%252F-MPnN9V4QNA9AzUSCk_s%252Fshow_all_history_custom.png%3Falt%3Dmedia%26token%3D400a3870-6326-4ef3-ba48-41c8ba74b3c6&#x26;width=768&#x26;dpr=4&#x26;quality=100&#x26;sign=569bbeb1&#x26;sv=1" alt=""><figcaption></figcaption></figure>

## <img src="/files/YvsMd8gBcFxOTRY1cXgZ" alt="" data-size="line">Cursor type

*To access cursor type settings use one of the following options:*

1. Left click on the icon <img src="/files/tUvrEzlG8lvQzFVXjiyB" alt="" data-size="line">within the chart toolbar.
2. Right click in the charting area to bring up the chart context menu, then select **Settings** followed by the **Pointer** menu item.

You can use the following cursor types when navigating the charts:

<img src="/files/A2ao2LkVsdo7AnLRBwEu" alt="" data-size="line"> Arrow

<img src="/files/GqaxEQ7Rey5J1eskewVf" alt="" data-size="line"> Arrow with markers

<img src="/files/OZcYJXpOOTXbE16Uh4al" alt="" data-size="line"> CrossHair

<img src="/files/azniRu80NxAEb2d06s1p" alt="" data-size="line"> Global Cross Hair

<img src="/files/mDmnM055KOSzxYOKLMUm" alt="" data-size="line"> Global Cross Hair with Scrolling

<figure><img src="https://docs.agenatrader.com/~gitbook/image?url=https%3A%2F%2F2805764894-files.gitbook.io%2F%7E%2Ffiles%2Fv0%2Fb%2Fgitbook-legacy-files%2Fo%2Fassets%252F-MKZSsJBtSP9L4sqIe_q%252F-MPnJBQf73uIOGhK2XwX%252F-MPnNIz5QANnJZ_B3GGX%252Fcursor_type3.png%3Falt%3Dmedia%26token%3D9b04ddd5-e9ed-4bbf-9fe3-af203c01b844&#x26;width=768&#x26;dpr=4&#x26;quality=100&#x26;sign=af393aa3&#x26;sv=1" alt=""><figcaption></figcaption></figure>

* Arrow: displays only the cursor.
* Arrow with markers: additionally highlights time and price.

<figure><img src="https://docs.agenatrader.com/~gitbook/image?url=https%3A%2F%2F2805764894-files.gitbook.io%2F%7E%2Ffiles%2Fv0%2Fb%2Fgitbook-legacy-files%2Fo%2Fassets%252F-MKZSsJBtSP9L4sqIe_q%252F-MPnJBQf73uIOGhK2XwX%252F-MPnNM4QpnUV4iGF30dA%252Farrow.jpg%3Falt%3Dmedia%26token%3D608dccb3-64bb-4743-a272-cc1efc06d98d&#x26;width=768&#x26;dpr=4&#x26;quality=100&#x26;sign=f287958c&#x26;sv=1" alt=""><figcaption></figcaption></figure>

* CrossHair: displays the cursor as a crossing of vertical and horizontal lines.

<figure><img src="https://docs.agenatrader.com/~gitbook/image?url=https%3A%2F%2F2805764894-files.gitbook.io%2F%7E%2Ffiles%2Fv0%2Fb%2Fgitbook-legacy-files%2Fo%2Fassets%252F-MKZSsJBtSP9L4sqIe_q%252F-MPnJBQf73uIOGhK2XwX%252F-MPnNPbBeOekPrL7VRgw%252Fcrosshaair.jpg%3Falt%3Dmedia%26token%3D74a3ef29-9679-430e-813a-da548297ce0f&#x26;width=768&#x26;dpr=4&#x26;quality=100&#x26;sign=c6a4bcde&#x26;sv=1" alt=""><figcaption></figcaption></figure>

* Global Cross Hair: if enabled, links **crosshairs** for the same instruments on two or more charts within different time frames.
* Global Cross Hair with Scrolling: if enabled, in addition to having the functions of the **Global Cross Hair**, it also allows you to scroll the chart within underlying time frames.

## <img src="/files/LnadWF06vvC9Rm2Q6Pgi" alt="" data-size="line"> Public Mode

The **Public Mode** function allows to share your trading ideas and trading strategies without violating your account information.

*In order to activate the Public mode use one of the options:*

1. Left click on the  <img src="/files/6LYR0P8MrwGiPqQKDfgm" alt="" data-size="line"> icon within the chart toolbar.
2. Right click in the charting area to bring up the chart context menu, then select **Settings** followed by the **Public mode** menu item.

<figure><img src="https://docs.agenatrader.com/~gitbook/image?url=https%3A%2F%2F2805764894-files.gitbook.io%2F%7E%2Ffiles%2Fv0%2Fb%2Fgitbook-legacy-files%2Fo%2Fassets%252F-MKZSsJBtSP9L4sqIe_q%252F-MPnJBQf73uIOGhK2XwX%252F-MPnNZDxiuPLHj-UM_Hk%252Fpublic_mode_custom_2.png%3Falt%3Dmedia%26token%3Dc060f82b-cf55-41a6-ae13-000cbf140641&#x26;width=768&#x26;dpr=4&#x26;quality=100&#x26;sign=d4da8db7&#x26;sv=1" alt=""><figcaption></figcaption></figure>

If this function is activated the order size and profit loss calculation will not be displayed.

<figure><img src="https://docs.agenatrader.com/~gitbook/image?url=https%3A%2F%2F2805764894-files.gitbook.io%2F%7E%2Ffiles%2Fv0%2Fb%2Fgitbook-legacy-files%2Fo%2Fassets%252F-MKZSsJBtSP9L4sqIe_q%252F-MPnJBQf73uIOGhK2XwX%252F-MPnNcbm2ogRRfiRK3xY%252Fpublic_mode_custom.png%3Falt%3Dmedia%26token%3D1f83653e-814c-43c1-b6e6-b3b4c62b432c&#x26;width=768&#x26;dpr=4&#x26;quality=100&#x26;sign=c857e41b&#x26;sv=1" alt=""><figcaption></figcaption></figure>

## <img src="/files/jm0Rue1FzAu8R4b3mc1p" alt="" data-size="line"> Bar Timer

With this button it is possible to generally display the bar timer or not set the position and stlye which means if the timer shall be set as **Time Bar** or **Text**.

*In order to change this use one of the options:*

1. Left click on the <img src="/files/aIm1jjTaIL2JnuXQQjuC" alt="" data-size="line"> icon within the chart toolbar.
2. Right click in the charting area to bring up the chart context menu, then select **Settings** followed by the **Bar Timer** menu item.

<figure><img src="https://docs.agenatrader.com/~gitbook/image?url=https%3A%2F%2F2805764894-files.gitbook.io%2F%7E%2Ffiles%2Fv0%2Fb%2Fgitbook-legacy-files%2Fo%2Fassets%252F-MKZSsJBtSP9L4sqIe_q%252F-MPnJBQf73uIOGhK2XwX%252F-MPnNjg0SV_K7AS3jAxZ%252Fbar_timer_custom.png%3Falt%3Dmedia%26token%3D97e4b5db-797a-4dc6-8b9f-dc823073a391&#x26;width=768&#x26;dpr=4&#x26;quality=100&#x26;sign=20c760bd&#x26;sv=1" alt=""><figcaption></figcaption></figure>

## <img src="/files/16z3FtuRZnpEVoLvDi7Z" alt="" data-size="line"> Switch to pre- and post-market data

*To display price movements outside the regular market hours on the chart use one of the options:*

1. Left click on the <img src="/files/l5g70Dwmz3qGh9QKtPPH" alt="" data-size="line"> icon within the chart toolbar.
2. Right click in the charting area to bring up the chart context menu, then select **Settings** followed by the **Switch to Pre/Post Market Data** menu item.

This is only possible, however, if you receive these data from your data feed provider. To differentiate between these periods and the regular exchange hours you can set a different [color](https://docs.agenatrader.com/main/chart-area/untitled/color) for them according to your preferences.

{% hint style="warning" %}
**Warning!** For pre-/post-market you CANNOT start the AT++ setup.
{% endhint %}

{% hint style="info" %}
**Notice:** Not all data feeds support pre-/post-market data. For **Barchart** and **TaiPan**, AgenaTrader does not display pre/post data in the chart. For **IQ-Feed** and **InteractiveBrokers**, AgenaTrader does display pre/post data.
{% endhint %}

<figure><img src="https://docs.agenatrader.com/~gitbook/image?url=https%3A%2F%2F2805764894-files.gitbook.io%2F%7E%2Ffiles%2Fv0%2Fb%2Fgitbook-legacy-files%2Fo%2Fassets%252F-MKZSsJBtSP9L4sqIe_q%252F-MPnJBQf73uIOGhK2XwX%252F-MPnO0F9eBm_x3VNaD1r%252FPostMarket.jpg%3Falt%3Dmedia%26token%3D4ba89053-1c34-4cb7-91ca-ab934afc3c19&#x26;width=768&#x26;dpr=4&#x26;quality=100&#x26;sign=b075260d&#x26;sv=1" alt=""><figcaption></figcaption></figure>

You can manage the pre-/post-market time intervals within the Preferences[: Market Place Escort](https://docs.agenatrader.com/tools/configuration-escort#Configuration_Escort__Market_Place_Escort).

<figure><img src="https://docs.agenatrader.com/~gitbook/image?url=https%3A%2F%2F2805764894-files.gitbook.io%2F%7E%2Ffiles%2Fv0%2Fb%2Fgitbook-legacy-files%2Fo%2Fassets%252F-MKZSsJBtSP9L4sqIe_q%252F-MPnJBQf73uIOGhK2XwX%252F-MPnO46UjhTd4ukpTINS%252FTrading_Hours.png%3Falt%3Dmedia%26token%3D25012703-034f-432c-8050-25914fd906a1&#x26;width=768&#x26;dpr=4&#x26;quality=100&#x26;sign=28531a08&#x26;sv=1" alt=""><figcaption></figcaption></figure>

## <img src="/files/ym5ZoJtMBFSormpvhv7l" alt="" data-size="line"> Chart Group

*To access functions of a chart croup use one of the following methods:*

1. Left click on the <img src="/files/okHsnsXKVikk8wD1jQER" alt="" data-size="line"> icon within the chart toolbar.
2. Right click in the charting area to bring up the chart context menu, then select **Settings** followed by the **Chart Group** menu item.

Similar options are available for a list chart group (LCG) and tab chart group (TCG).

* List chart group (LCG)

<figure><img src="https://docs.agenatrader.com/~gitbook/image?url=https%3A%2F%2F2805764894-files.gitbook.io%2F%7E%2Ffiles%2Fv0%2Fb%2Fgitbook-legacy-files%2Fo%2Fassets%252F-MKZSsJBtSP9L4sqIe_q%252F-MPnJBQf73uIOGhK2XwX%252F-MPnOcZ8Y7iWJPrzKsmZ%252FtoolbarChartGroup.png%3Falt%3Dmedia%26token%3Dcf63e750-c9d5-4f63-aba8-f77e5c1a760b&#x26;width=768&#x26;dpr=4&#x26;quality=100&#x26;sign=1e535ae1&#x26;sv=1" alt=""><figcaption></figcaption></figure>

* Tab chart group (TCG)

<figure><img src="https://docs.agenatrader.com/~gitbook/image?url=https%3A%2F%2F2805764894-files.gitbook.io%2F%7E%2Ffiles%2Fv0%2Fb%2Fgitbook-legacy-files%2Fo%2Fassets%252F-MKZSsJBtSP9L4sqIe_q%252F-MPnJBQf73uIOGhK2XwX%252F-MPnOgcySz7ezPUSIbci%252FtoolbarChartGroup2.png%3Falt%3Dmedia%26token%3D7641d11a-b17d-44bf-8847-b86538e96e3d&#x26;width=768&#x26;dpr=4&#x26;quality=100&#x26;sign=b807ca3&#x26;sv=1" alt=""><figcaption></figcaption></figure>

### Add a chart <a href="#add_a_chart" id="add_a_chart"></a>

Select **Settings -> Chart Group -> Add chart** from the context menu to add a chart inside the container.

The new chart will have the same time frame as the one applied to the container. You can change the time frame manually using the toolbar.

![](https://docs.agenatrader.com/~gitbook/image?url=https%3A%2F%2F2805764894-files.gitbook.io%2F%7E%2Ffiles%2Fv0%2Fb%2Fgitbook-legacy-files%2Fo%2Fassets%252F-MKZSsJBtSP9L4sqIe_q%252F-MPnJBQf73uIOGhK2XwX%252F-MPnOkX6oi2H3cymDZRz%252FChart_groups3.png%3Falt%3Dmedia%26token%3Dcd022ecc-8b9f-4210-a1db-30bcfc4f5fe9\&width=768\&dpr=4\&quality=100\&sign=14909a43\&sv=1)![](https://docs.agenatrader.com/~gitbook/image?url=https%3A%2F%2F2805764894-files.gitbook.io%2F%7E%2Ffiles%2Fv0%2Fb%2Fgitbook-legacy-files%2Fo%2Fassets%252F-MKZSsJBtSP9L4sqIe_q%252F-MPnJBQf73uIOGhK2XwX%252F-MPnOnzUpZt3ds7JF0D_%252FChartGroup%281%29.jpg%3Falt%3Dmedia%26token%3D679ae50f-ce3b-4ed7-8752-f7f166f31395\&width=768\&dpr=4\&quality=100\&sign=4ce95df7\&sv=1)

### Delete a chart <a href="#delete_a_chart" id="delete_a_chart"></a>

Select **Settings -> Chart Group -> Delete chart** from the context menu to delete a chart from the container.

When you move the cursor over one of the chart names, both the text and the action bar of the corresponding chart will be highlighted in red (see image below). Once you confirm the selection by left clicking, the chart will be removed.

<figure><img src="https://docs.agenatrader.com/~gitbook/image?url=https%3A%2F%2F2805764894-files.gitbook.io%2F%7E%2Ffiles%2Fv0%2Fb%2Fgitbook-legacy-files%2Fo%2Fassets%252F-MKZSsJBtSP9L4sqIe_q%252F-MPnJBQf73uIOGhK2XwX%252F-MPnOsSp0mLKmdYdrynX%252FDeleteChart.jpg%3Falt%3Dmedia%26token%3Df5f80db7-5260-4f86-bb65-b7a3dfdf7c08&#x26;width=768&#x26;dpr=4&#x26;quality=100&#x26;sign=2d03af5d&#x26;sv=1" alt=""><figcaption></figcaption></figure>

### Set container style <a href="#set_container_style" id="set_container_style"></a>

You can create a new list (or tab) chart group by left clicking the corresponding icon within the toolbar. This will bring up the list (tab) chart group dialog window, in which you can select a maximum of four chart time frames.

<figure><img src="https://docs.agenatrader.com/~gitbook/image?url=https%3A%2F%2F2805764894-files.gitbook.io%2F%7E%2Ffiles%2Fv0%2Fb%2Fgitbook-legacy-files%2Fo%2Fassets%252F-MKZSsJBtSP9L4sqIe_q%252F-MPnJBQf73uIOGhK2XwX%252F-MPnOw6w5yN4dElzq2CV%252FCreateListaChartGroup.png%3Falt%3Dmedia%26token%3D95010026-1e8d-4909-818b-b7d0ea71560c&#x26;width=768&#x26;dpr=4&#x26;quality=100&#x26;sign=aecd6f60&#x26;sv=1" alt=""><figcaption></figcaption></figure>

The option "Set Container Style" allows you to display charts differently. Select **Settings -> Chart Group -> Set Container Style** from the context menu to rearrange charts by selecting one of the following styles:

* horizontal
* vertical
* right (1 larger chart on the left side and 2 small charts on the right)
* left (1 larger chart on the right side and 2 small charts on the left)

<figure><img src="https://docs.agenatrader.com/~gitbook/image?url=https%3A%2F%2F2805764894-files.gitbook.io%2F%7E%2Ffiles%2Fv0%2Fb%2Fgitbook-legacy-files%2Fo%2Fassets%252F-MKZSsJBtSP9L4sqIe_q%252F-MPnJBQf73uIOGhK2XwX%252F-MPnP1LQkCOydXNk_nnI%252FSetContainer%2520Style.jpg%3Falt%3Dmedia%26token%3Dbb4765a8-ca9a-47ff-a3e5-5c220a3d5b2d&#x26;width=768&#x26;dpr=4&#x26;quality=100&#x26;sign=23ae36dc&#x26;sv=1" alt=""><figcaption></figcaption></figure>

### Print a chart <a href="#print_a_chart" id="print_a_chart"></a>

Select **Settings -> Chart Group -> Print Chart Group** or **Print Chart Group List** from the context menu to print the whole tab chart group (TCG) or list chart group (LCG):

Meaning of printing options:

* Print Chart Group: prints only the current chart group.
* Print Chart Group List: prints everything contained inside the LCG or TCG.

<figure><img src="https://docs.agenatrader.com/~gitbook/image?url=https%3A%2F%2F2805764894-files.gitbook.io%2F%7E%2Ffiles%2Fv0%2Fb%2Fgitbook-legacy-files%2Fo%2Fassets%252F-MKZSsJBtSP9L4sqIe_q%252F-MPnJBQf73uIOGhK2XwX%252F-MPnP4rg1VDNCNh-L17r%252FPrintChartGroup.jpg%3Falt%3Dmedia%26token%3Df81ed0ca-95fc-4510-a182-345055c9e5a9&#x26;width=768&#x26;dpr=4&#x26;quality=100&#x26;sign=ee1327ca&#x26;sv=1" alt=""><figcaption></figcaption></figure>

#### Save as Image <a href="#save_as_image" id="save_as_image"></a>

Select **Settings -> Chart Group -> Save as Image** to save the current chart group as an Image.

<figure><img src="https://docs.agenatrader.com/~gitbook/image?url=https%3A%2F%2F2805764894-files.gitbook.io%2F%7E%2Ffiles%2Fv0%2Fb%2Fgitbook-legacy-files%2Fo%2Fassets%252F-MKZSsJBtSP9L4sqIe_q%252F-MPnJBQf73uIOGhK2XwX%252F-MPnP8N8WxZwAlOlCdr3%252Fchartgroup_save_as_image.png%3Falt%3Dmedia%26token%3D6aaeacd5-1b63-4c9b-a348-af60d3b0d750&#x26;width=768&#x26;dpr=4&#x26;quality=100&#x26;sign=7c44d13d&#x26;sv=1" alt=""><figcaption></figcaption></figure>

### Templates <a href="#templates" id="templates"></a>

#### Saving of templates <a href="#saving_of_templates" id="saving_of_templates"></a>

Select **Settings -> Chart Group -> Template -> Save (Save as...)** from the context menu to save your favorite templates for a tab chart group (TCG) or list chart group (LCG). You can customize various chart properties and save them as a chart template.

The following chart information may be saved and later applied to a new chart:

| Icon                                                                                                                                                                                                                                                                                                                                                                                               | Feature                                                                                 | Save template                                                                                                                                                                                                                                                                                                                                                                                    |   |
| -------------------------------------------------------------------------------------------------------------------------------------------------------------------------------------------------------------------------------------------------------------------------------------------------------------------------------------------------------------------------------------------------- | --------------------------------------------------------------------------------------- | ------------------------------------------------------------------------------------------------------------------------------------------------------------------------------------------------------------------------------------------------------------------------------------------------------------------------------------------------------------------------------------------------ | - |
| -                                                                                                                                                                                                                                                                                                                                                                                                  | [ActionBar settings](https://docs.agenatrader.com/tools/configuration-escort#actionbar) | ![Blue Checkmark Ms](https://docs.agenatrader.com/~gitbook/image?url=https%3A%2F%2F2805764894-files.gitbook.io%2F%7E%2Ffiles%2Fv0%2Fb%2Fgitbook-legacy-files%2Fo%2Fassets%252F-MKZSsJBtSP9L4sqIe_q%252F-MPnJBQf73uIOGhK2XwX%252F-MPnPEqPllK3ltBHgWKD%252Fblue_checkmark_ms.png%3Falt%3Dmedia%26token%3D30e92bd2-9b94-40c3-b9d8-a01685686124\&width=300\&dpr=4\&quality=100\&sign=cecb57bb\&sv=1) |   |
| <img src="/files/OtpTWyw4Yd2bAm5WXg1B" alt="" data-size="line">                                                                                                                                                                                                                                                                                                                                    | Bar timer                                                                               | ![Blue Checkmark Ms](https://docs.agenatrader.com/~gitbook/image?url=https%3A%2F%2F2805764894-files.gitbook.io%2F%7E%2Ffiles%2Fv0%2Fb%2Fgitbook-legacy-files%2Fo%2Fassets%252F-MKZSsJBtSP9L4sqIe_q%252F-MPnJBQf73uIOGhK2XwX%252F-MPnPEqPllK3ltBHgWKD%252Fblue_checkmark_ms.png%3Falt%3Dmedia%26token%3D30e92bd2-9b94-40c3-b9d8-a01685686124\&width=300\&dpr=4\&quality=100\&sign=cecb57bb\&sv=1) |   |
| <img src="/files/9SK3m7XCNZS7BJB1HwUU" alt="" data-size="line">                                                                                                                                                                                                                                                                                                                                    | Color                                                                                   | ![Blue Checkmark Ms](https://docs.agenatrader.com/~gitbook/image?url=https%3A%2F%2F2805764894-files.gitbook.io%2F%7E%2Ffiles%2Fv0%2Fb%2Fgitbook-legacy-files%2Fo%2Fassets%252F-MKZSsJBtSP9L4sqIe_q%252F-MPnJBQf73uIOGhK2XwX%252F-MPnPEqPllK3ltBHgWKD%252Fblue_checkmark_ms.png%3Falt%3Dmedia%26token%3D30e92bd2-9b94-40c3-b9d8-a01685686124\&width=300\&dpr=4\&quality=100\&sign=cecb57bb\&sv=1) |   |
| <img src="/files/VIus0fCLHHAtyA4mwJrM" alt="" data-size="line">                                                                                                                                                                                                                                                                                                                                    | DOM                                                                                     | -                                                                                                                                                                                                                                                                                                                                                                                                |   |
| <img src="/files/yitfml4gF34ffzihtPR6" alt="" data-size="line">                                                                                                                                                                                                                                                                                                                                    | Drawings                                                                                | -                                                                                                                                                                                                                                                                                                                                                                                                |   |
| <img src="/files/3zHqcb8YSqFLasqDkyxV" alt="" data-size="line">                                                                                                                                                                                                                                                                                                                                    | Grid                                                                                    | ![Blue Checkmark Ms](https://docs.agenatrader.com/~gitbook/image?url=https%3A%2F%2F2805764894-files.gitbook.io%2F%7E%2Ffiles%2Fv0%2Fb%2Fgitbook-legacy-files%2Fo%2Fassets%252F-MKZSsJBtSP9L4sqIe_q%252F-MPnJBQf73uIOGhK2XwX%252F-MPnPEqPllK3ltBHgWKD%252Fblue_checkmark_ms.png%3Falt%3Dmedia%26token%3D30e92bd2-9b94-40c3-b9d8-a01685686124\&width=300\&dpr=4\&quality=100\&sign=cecb57bb\&sv=1) |   |
| <img src="/files/jmVoJZyCYv6RmoKawnME" alt="" data-size="line">                                                                                                                                                                                                                                                                                                                                    | Indicators                                                                              | ![Blue Checkmark Ms](https://docs.agenatrader.com/~gitbook/image?url=https%3A%2F%2F2805764894-files.gitbook.io%2F%7E%2Ffiles%2Fv0%2Fb%2Fgitbook-legacy-files%2Fo%2Fassets%252F-MKZSsJBtSP9L4sqIe_q%252F-MPnJBQf73uIOGhK2XwX%252F-MPnPEqPllK3ltBHgWKD%252Fblue_checkmark_ms.png%3Falt%3Dmedia%26token%3D30e92bd2-9b94-40c3-b9d8-a01685686124\&width=300\&dpr=4\&quality=100\&sign=cecb57bb\&sv=1) |   |
| ![Es](https://docs.agenatrader.com/~gitbook/image?url=https%3A%2F%2F2805764894-files.gitbook.io%2F%7E%2Ffiles%2Fv0%2Fb%2Fgitbook-legacy-files%2Fo%2Fassets%252F-MKZSsJBtSP9L4sqIe_q%252F-MPn3oT4OcTPQ1g6g2-L%252F-MPnD3K50PVl-HjSodDI%252Fes.png%3Falt%3Dmedia%26token%3D385b0310-e75b-40a8-9013-7d9ea00d38a0\&width=300\&dpr=4\&quality=100\&sign=5626cfef\&sv=1)                                 | Instrument                                                                              | -                                                                                                                                                                                                                                                                                                                                                                                                |   |
| -                                                                                                                                                                                                                                                                                                                                                                                                  | Number of charts                                                                        | ![Blue Checkmark Ms](https://docs.agenatrader.com/~gitbook/image?url=https%3A%2F%2F2805764894-files.gitbook.io%2F%7E%2Ffiles%2Fv0%2Fb%2Fgitbook-legacy-files%2Fo%2Fassets%252F-MKZSsJBtSP9L4sqIe_q%252F-MPnJBQf73uIOGhK2XwX%252F-MPnPEqPllK3ltBHgWKD%252Fblue_checkmark_ms.png%3Falt%3Dmedia%26token%3D30e92bd2-9b94-40c3-b9d8-a01685686124\&width=300\&dpr=4\&quality=100\&sign=cecb57bb\&sv=1) |   |
| <img src="/files/kgMWaBrocu5QFEblgpD1" alt="" data-size="line">                                                                                                                                                                                                                                                                                                                                    | Pointer                                                                                 | ![Blue Checkmark Ms](https://docs.agenatrader.com/~gitbook/image?url=https%3A%2F%2F2805764894-files.gitbook.io%2F%7E%2Ffiles%2Fv0%2Fb%2Fgitbook-legacy-files%2Fo%2Fassets%252F-MKZSsJBtSP9L4sqIe_q%252F-MPnJBQf73uIOGhK2XwX%252F-MPnPEqPllK3ltBHgWKD%252Fblue_checkmark_ms.png%3Falt%3Dmedia%26token%3D30e92bd2-9b94-40c3-b9d8-a01685686124\&width=300\&dpr=4\&quality=100\&sign=cecb57bb\&sv=1) |   |
| <img src="/files/eq3GWTzWwVWqQdybdhnk" alt="" data-size="line">                                                                                                                                                                                                                                                                                                                                    | Price Style                                                                             | ![Blue Checkmark Ms](https://docs.agenatrader.com/~gitbook/image?url=https%3A%2F%2F2805764894-files.gitbook.io%2F%7E%2Ffiles%2Fv0%2Fb%2Fgitbook-legacy-files%2Fo%2Fassets%252F-MKZSsJBtSP9L4sqIe_q%252F-MPnJBQf73uIOGhK2XwX%252F-MPnPEqPllK3ltBHgWKD%252Fblue_checkmark_ms.png%3Falt%3Dmedia%26token%3D30e92bd2-9b94-40c3-b9d8-a01685686124\&width=300\&dpr=4\&quality=100\&sign=cecb57bb\&sv=1) |   |
| <img src="/files/Zf4UdyWNFtkhrSKBrYch" alt="" data-size="line">                                                                                                                                                                                                                                                                                                                                    | Public Mode                                                                             | -                                                                                                                                                                                                                                                                                                                                                                                                |   |
| ![Quicktrader Button](https://docs.agenatrader.com/~gitbook/image?url=https%3A%2F%2F2805764894-files.gitbook.io%2F%7E%2Ffiles%2Fv0%2Fb%2Fgitbook-legacy-files%2Fo%2Fassets%252F-MKZSsJBtSP9L4sqIe_q%252F-MPnJBQf73uIOGhK2XwX%252F-MPnQtCxpI8Mz_7sWcSY%252Fquicktrader_button.png%3Falt%3Dmedia%26token%3Dacb650f4-307b-43d0-858a-a607fd82ae4f\&width=300\&dpr=4\&quality=100\&sign=6750ab90\&sv=1) | Quick Trader                                                                            | -                                                                                                                                                                                                                                                                                                                                                                                                |   |
| <img src="/files/J2dTNJbSfOTOATarFf6P" alt="" data-size="line">                                                                                                                                                                                                                                                                                                                                    | Quote markers line                                                                      | ![Blue Checkmark Ms](https://docs.agenatrader.com/~gitbook/image?url=https%3A%2F%2F2805764894-files.gitbook.io%2F%7E%2Ffiles%2Fv0%2Fb%2Fgitbook-legacy-files%2Fo%2Fassets%252F-MKZSsJBtSP9L4sqIe_q%252F-MPnJBQf73uIOGhK2XwX%252F-MPnPEqPllK3ltBHgWKD%252Fblue_checkmark_ms.png%3Falt%3Dmedia%26token%3D30e92bd2-9b94-40c3-b9d8-a01685686124\&width=300\&dpr=4\&quality=100\&sign=cecb57bb\&sv=1) |   |
| <img src="/files/einaYuSW2NKQTZHKO4qd" alt="" data-size="line">                                                                                                                                                                                                                                                                                                                                    | Show all history                                                                        | -                                                                                                                                                                                                                                                                                                                                                                                                |   |
| <img src="/files/mnuhfp7hfUKttvyimqjc" alt="" data-size="line">                                                                                                                                                                                                                                                                                                                                    | Start AT++                                                                              | -                                                                                                                                                                                                                                                                                                                                                                                                |   |
| <img src="/files/HNFqH9NHIctr8PueZjGD" alt="" data-size="line">                                                                                                                                                                                                                                                                                                                                    | Strategies                                                                              | -                                                                                                                                                                                                                                                                                                                                                                                                |   |
| <img src="/files/rTETRGcQoea33sPfccpm" alt="" data-size="line">                                                                                                                                                                                                                                                                                                                                    | Switch to pre/post market data                                                          | -                                                                                                                                                                                                                                                                                                                                                                                                |   |
| ![Icon2](https://docs.agenatrader.com/~gitbook/image?url=https%3A%2F%2F2805764894-files.gitbook.io%2F%7E%2Ffiles%2Fv0%2Fb%2Fgitbook-legacy-files%2Fo%2Fassets%252F-MKZSsJBtSP9L4sqIe_q%252F-MPn3oT4OcTPQ1g6g2-L%252F-MPnDC0gTeAcRq8fqOuV%252Ficon2.png%3Falt%3Dmedia%26token%3Dc8b3d7bf-b1f5-45e9-a977-06f276936069\&width=300\&dpr=4\&quality=100\&sign=f8f07d57\&sv=1)                           | TimeFrame                                                                               | ![Blue Checkmark Ms](https://docs.agenatrader.com/~gitbook/image?url=https%3A%2F%2F2805764894-files.gitbook.io%2F%7E%2Ffiles%2Fv0%2Fb%2Fgitbook-legacy-files%2Fo%2Fassets%252F-MKZSsJBtSP9L4sqIe_q%252F-MPnJBQf73uIOGhK2XwX%252F-MPnPEqPllK3ltBHgWKD%252Fblue_checkmark_ms.png%3Falt%3Dmedia%26token%3D30e92bd2-9b94-40c3-b9d8-a01685686124\&width=300\&dpr=4\&quality=100\&sign=cecb57bb\&sv=1) |   |
| <img src="/files/ufmJuCN3wlEf4X93wQG8" alt="" data-size="line">                                                                                                                                                                                                                                                                                                                                    | Trade Visualization                                                                     | ![Blue Checkmark Ms](https://docs.agenatrader.com/~gitbook/image?url=https%3A%2F%2F2805764894-files.gitbook.io%2F%7E%2Ffiles%2Fv0%2Fb%2Fgitbook-legacy-files%2Fo%2Fassets%252F-MKZSsJBtSP9L4sqIe_q%252F-MPnJBQf73uIOGhK2XwX%252F-MPnPEqPllK3ltBHgWKD%252Fblue_checkmark_ms.png%3Falt%3Dmedia%26token%3D30e92bd2-9b94-40c3-b9d8-a01685686124\&width=300\&dpr=4\&quality=100\&sign=cecb57bb\&sv=1) |   |
| <img src="/files/rkWb6DLU8OGccdVr0xvm" alt="" data-size="line">                                                                                                                                                                                                                                                                                                                                    | Trading Pad                                                                             | -                                                                                                                                                                                                                                                                                                                                                                                                |   |
| <img src="/files/K4IeG2t4p1DUotw7YQQH" alt="" data-size="line"><img src="/files/EI9Hj5ehJiaWMI6jvlEs" alt="" data-size="line">                                                                                                                                                                                                                                                                     | Zoom In/Out                                                                             | ![Blue Checkmark Ms](https://docs.agenatrader.com/~gitbook/image?url=https%3A%2F%2F2805764894-files.gitbook.io%2F%7E%2Ffiles%2Fv0%2Fb%2Fgitbook-legacy-files%2Fo%2Fassets%252F-MKZSsJBtSP9L4sqIe_q%252F-MPnJBQf73uIOGhK2XwX%252F-MPnPEqPllK3ltBHgWKD%252Fblue_checkmark_ms.png%3Falt%3Dmedia%26token%3D30e92bd2-9b94-40c3-b9d8-a01685686124\&width=300\&dpr=4\&quality=100\&sign=cecb57bb\&sv=1) |   |

Drawing objects such as trend lines, Fibonacci retracements etc. cannot be saved as templates.

{% hint style="info" %}
**IMPORTANT NOTE!** TCG templates can be used as [snapshot templates](https://docs.agenatrader.com/tools/configuration-escort#chart) in the **Global Configuration** (once trade is closed, charts will be saved as a picture).
{% endhint %}

The existing scanner settings will also be saved in the template for list chart groups.

<figure><img src="https://docs.agenatrader.com/~gitbook/image?url=https%3A%2F%2F2805764894-files.gitbook.io%2F%7E%2Ffiles%2Fv0%2Fb%2Fgitbook-legacy-files%2Fo%2Fassets%252F-MKZSsJBtSP9L4sqIe_q%252F-MPnJBQf73uIOGhK2XwX%252F-MPnRmYJ8FT28oqEd_5N%252FChartSaveAs.png%3Falt%3Dmedia%26token%3D74eea76f-a241-4645-80c8-d627064dde2b&#x26;width=768&#x26;dpr=4&#x26;quality=100&#x26;sign=a2619682&#x26;sv=1" alt=""><figcaption></figcaption></figure>

If you wish to open a new list (or tab) chart group with your layout settings, choose one of the saved templates from the drop-down list within the list (or tab) chart group dialog window.

<figure><img src="https://docs.agenatrader.com/~gitbook/image?url=https%3A%2F%2F2805764894-files.gitbook.io%2F%7E%2Ffiles%2Fv0%2Fb%2Fgitbook-legacy-files%2Fo%2Fassets%252F-MKZSsJBtSP9L4sqIe_q%252F-MPnJBQf73uIOGhK2XwX%252F-MPnRr6ln9QboqAVWLfc%252FCreateListaChartGroup1.png%3Falt%3Dmedia%26token%3Ddf6555a2-efdf-4333-a7d3-bcdce961f7b8&#x26;width=768&#x26;dpr=4&#x26;quality=100&#x26;sign=8f0e92e4&#x26;sv=1" alt=""><figcaption></figcaption></figure>

### **List chart group templates**

The following chart properties can be saved as a template for a list chart group:

* Current [scanner settings](https://docs.agenatrader.com/main/chart-area/realtime-scanner/scanner-settings#scanner-templates) (blue)
* Current [chart settings](https://docs.agenatrader.com/main/chart-area/untitled/chart-templates) (purple)
* Settings for the whole chart group (red). The following properties can be saved:
  * Number of charts
  * Time frame
  * Container style
  * Single chart size

<figure><img src="https://docs.agenatrader.com/~gitbook/image?url=https%3A%2F%2F2805764894-files.gitbook.io%2F%7E%2Ffiles%2Fv0%2Fb%2Fgitbook-legacy-files%2Fo%2Fassets%252F-MKZSsJBtSP9L4sqIe_q%252F-MPnJBQf73uIOGhK2XwX%252F-MPnRuyJro1SPTE-fa_8%252FChartGroup.jpg%3Falt%3Dmedia%26token%3De1cdfb1b-0eb8-497a-81cf-6f6235dee891&#x26;width=768&#x26;dpr=4&#x26;quality=100&#x26;sign=7afb2265&#x26;sv=1" alt=""><figcaption></figcaption></figure>

To load a list chart group template use one of the options:

* Left click on the <img src="/files/X8JVaOFcJt4fEoa9nhhi" alt="" data-size="line"> icon within the chart toolbar and select **Template -> Load**
* Right click on the chart in the list chart group and select **Settings -> Chart Group -> Template -> Load**.

<figure><img src="https://docs.agenatrader.com/~gitbook/image?url=https%3A%2F%2F2805764894-files.gitbook.io%2F%7E%2Ffiles%2Fv0%2Fb%2Fgitbook-legacy-files%2Fo%2Fassets%252F-MKZSsJBtSP9L4sqIe_q%252F-MPnJBQf73uIOGhK2XwX%252F-MPnS3c7Gbm9mV5zWVe6%252FChart_groups_templates6.png%3Falt%3Dmedia%26token%3Ddf7521eb-a92e-4c58-95d9-7a3b2bf577ea&#x26;width=768&#x26;dpr=4&#x26;quality=100&#x26;sign=45be57ed&#x26;sv=1" alt=""><figcaption></figcaption></figure>

*Description of the available options within **Settings** menu item:*

* Load: loads saved templates.
* Save: saves changes made within the list chart group (new indicator, different color, etc.).
* save as: creates a new template.
* Save as default: saves a template as a standard template. If you do not select a template when creating the list chart group, these standard settings will be applied.
* Delete: deletes a template.

Next select the **Load** menu item followed by **Select...** to launch a popup and load the desired template for a list chart group from the drop-down list:

<figure><img src="https://docs.agenatrader.com/~gitbook/image?url=https%3A%2F%2F2805764894-files.gitbook.io%2F%7E%2Ffiles%2Fv0%2Fb%2Fgitbook-legacy-files%2Fo%2Fassets%252F-MKZSsJBtSP9L4sqIe_q%252F-MPnJBQf73uIOGhK2XwX%252F-MPnS7eoHwSIw0iE18iB%252FSelectTemplate.png%3Falt%3Dmedia%26token%3D7b8de413-4588-40bb-8e93-8b36d9883e2f&#x26;width=768&#x26;dpr=4&#x26;quality=100&#x26;sign=b6215bdb&#x26;sv=1" alt=""><figcaption></figcaption></figure>

The templates for a list chart group are also available within the list chart group dialog window:

<figure><img src="https://docs.agenatrader.com/~gitbook/image?url=https%3A%2F%2F2805764894-files.gitbook.io%2F%7E%2Ffiles%2Fv0%2Fb%2Fgitbook-legacy-files%2Fo%2Fassets%252F-MKZSsJBtSP9L4sqIe_q%252F-MPnJBQf73uIOGhK2XwX%252F-MPnSB9xKyPp2BWDv5vv%252FSelectTemplate1.png%3Falt%3Dmedia%26token%3Dd7aec97a-41f0-4b9d-9b78-49905f0b77db&#x26;width=768&#x26;dpr=4&#x26;quality=100&#x26;sign=29a6b3c&#x26;sv=1" alt=""><figcaption></figcaption></figure>

### **Tab chart group templates**

The following chart properties can be saved as a template for a tab chart group:

* Current [chart settings](https://docs.agenatrader.com/main/chart-area/untitled/chart-templates) (purple)
* Settings for the whole chart group (red). The following properties can be saved:
  * Number of charts
  * Time frame
  * Container style
  * Single chart size

<figure><img src="https://docs.agenatrader.com/~gitbook/image?url=https%3A%2F%2F2805764894-files.gitbook.io%2F%7E%2Ffiles%2Fv0%2Fb%2Fgitbook-legacy-files%2Fo%2Fassets%252F-MKZSsJBtSP9L4sqIe_q%252F-MPnJBQf73uIOGhK2XwX%252F-MPnSF7i10OKKcfx__7X%252FtabChartGroupTemplate.jpg%3Falt%3Dmedia%26token%3D3826343c-25c5-438e-942f-c4fc093fb5b2&#x26;width=768&#x26;dpr=4&#x26;quality=100&#x26;sign=5b082747&#x26;sv=1" alt=""><figcaption></figcaption></figure>

To load a tab chart group template use one of the options:

* Left click on the <img src="/files/1QgkASBoqzalCcB3jfV0" alt="" data-size="line"> icon within the chart toolbar and select **Template -> Load**
* Right click on the chart in the list chart group and select **Settings -> Chart Group -> Template -> Load**.

<figure><img src="https://docs.agenatrader.com/~gitbook/image?url=https%3A%2F%2F2805764894-files.gitbook.io%2F%7E%2Ffiles%2Fv0%2Fb%2Fgitbook-legacy-files%2Fo%2Fassets%252F-MKZSsJBtSP9L4sqIe_q%252F-MPnJBQf73uIOGhK2XwX%252F-MPnSPaOuRrdiXGemRGM%252FTCG_Load.png%3Falt%3Dmedia%26token%3D87b0b2b2-1ef4-45d5-9916-d74904cb0576&#x26;width=768&#x26;dpr=4&#x26;quality=100&#x26;sign=a870eaed&#x26;sv=1" alt=""><figcaption></figcaption></figure>

*Description of the available options within **Settings** menu item:*

* Load: loads saved templates.
* Save: saves changes made within the tab chart group (new indicator, different color, etc.).
* save as: creates a new template.
* Save as default: saves a template as a standard template. If you do not select a template when creating the tab chart group, these standard settings will be applied.
* Delete: deletes a template.

Next select the **Load** menu item followed by **Select...** to launch a popup and load the desired template for the tab chart group from the drop-down list:

<figure><img src="https://docs.agenatrader.com/~gitbook/image?url=https%3A%2F%2F2805764894-files.gitbook.io%2F%7E%2Ffiles%2Fv0%2Fb%2Fgitbook-legacy-files%2Fo%2Fassets%252F-MKZSsJBtSP9L4sqIe_q%252F-MPnJBQf73uIOGhK2XwX%252F-MPnSTAUi1cRRnaPFRTR%252FSelectTab.png%3Falt%3Dmedia%26token%3D4cfe3ce6-037a-46ed-aea0-150bc63a7df7&#x26;width=768&#x26;dpr=4&#x26;quality=100&#x26;sign=64cba7d6&#x26;sv=1" alt=""><figcaption></figcaption></figure>

The templates for tab chart groups are also available within the tab chart group dialog window:

<figure><img src="https://docs.agenatrader.com/~gitbook/image?url=https%3A%2F%2F2805764894-files.gitbook.io%2F%7E%2Ffiles%2Fv0%2Fb%2Fgitbook-legacy-files%2Fo%2Fassets%252F-MKZSsJBtSP9L4sqIe_q%252F-MPnJBQf73uIOGhK2XwX%252F-MPnSXBV-XkrSdmtqFmn%252FCreatTab.png%3Falt%3Dmedia%26token%3D54c4afeb-2321-4c99-8450-8dc0a8eff2c7&#x26;width=768&#x26;dpr=4&#x26;quality=100&#x26;sign=ea75facb&#x26;sv=1" alt=""><figcaption></figcaption></figure>

### Synchronize (TCG) <a href="#synchronize_tcg" id="synchronize_tcg"></a>

If the option **TabChartGroup Autosynchronization** is not enabled within the **Tools -> Global Configuration** menu in the **General and** [**Chart**](https://docs.agenatrader.com/tools/configuration-escort#chart) tabs, you can synchronize charts manually using the context menu (see image below). This function is only available for charts within a tab chart group.

Selecting the **Synchronize** menu item from the context menu applies all chart settings such as colors, zoom, size, style etc. to the other charts within the tab chart group. This function also synchronizes all indicators (such as oscillators) within the chart group container.

If the option **TabChartGroup Autosynchronization** is enabled within the **Global Configuration**, then every change in a chart from the tab chart group will be synchronized immediately.

If you decide to synchronize while a strategy is running, a popup will prompt you to decide whether to synchronize the strategy or not.

<figure><img src="https://docs.agenatrader.com/~gitbook/image?url=https%3A%2F%2F2805764894-files.gitbook.io%2F%7E%2Ffiles%2Fv0%2Fb%2Fgitbook-legacy-files%2Fo%2Fassets%252F-MKZSsJBtSP9L4sqIe_q%252F-MPnJBQf73uIOGhK2XwX%252F-MPnSbmM_Z2p-rrW2XsC%252FTCG_synchronize1.png%3Falt%3Dmedia%26token%3Da348e3c8-9fa9-4817-9468-e3993c60ff05&#x26;width=768&#x26;dpr=4&#x26;quality=100&#x26;sign=e22735ab&#x26;sv=1" alt=""><figcaption></figcaption></figure>

## <img src="/files/oboVD8auN3HETgsInDqY" alt="" data-size="line"> Chart templates

AgenaTrader allows you to save the chart parameters with the help of chart templates and then apply them to other charts by loading the template.

When you save a chart template, the following chart settings are determined:

<table data-header-hidden><thead><tr><th width="146"></th><th width="286"></th><th></th><th></th></tr></thead><tbody><tr><td>Icon</td><td>Feature</td><td>Save template</td><td></td></tr><tr><td>-</td><td><a href="https://docs.agenatrader.com/tools/configuration-escort#actionbar">ActionBar settings</a></td><td><img src="https://docs.agenatrader.com/~gitbook/image?url=https%3A%2F%2F2805764894-files.gitbook.io%2F%7E%2Ffiles%2Fv0%2Fb%2Fgitbook-legacy-files%2Fo%2Fassets%252F-MKZSsJBtSP9L4sqIe_q%252F-MPnJBQf73uIOGhK2XwX%252F-MPnPEqPllK3ltBHgWKD%252Fblue_checkmark_ms.png%3Falt%3Dmedia%26token%3D30e92bd2-9b94-40c3-b9d8-a01685686124&#x26;width=300&#x26;dpr=4&#x26;quality=100&#x26;sign=cecb57bb&#x26;sv=1" alt="Blue Checkmark Ms"></td><td></td></tr><tr><td><img src="/files/OtpTWyw4Yd2bAm5WXg1B" alt="" data-size="line"></td><td>Bar timer</td><td><img src="https://docs.agenatrader.com/~gitbook/image?url=https%3A%2F%2F2805764894-files.gitbook.io%2F%7E%2Ffiles%2Fv0%2Fb%2Fgitbook-legacy-files%2Fo%2Fassets%252F-MKZSsJBtSP9L4sqIe_q%252F-MPnJBQf73uIOGhK2XwX%252F-MPnPEqPllK3ltBHgWKD%252Fblue_checkmark_ms.png%3Falt%3Dmedia%26token%3D30e92bd2-9b94-40c3-b9d8-a01685686124&#x26;width=300&#x26;dpr=4&#x26;quality=100&#x26;sign=cecb57bb&#x26;sv=1" alt="Blue Checkmark Ms"></td><td></td></tr><tr><td><img src="/files/9SK3m7XCNZS7BJB1HwUU" alt="" data-size="line"></td><td>Color</td><td><img src="https://docs.agenatrader.com/~gitbook/image?url=https%3A%2F%2F2805764894-files.gitbook.io%2F%7E%2Ffiles%2Fv0%2Fb%2Fgitbook-legacy-files%2Fo%2Fassets%252F-MKZSsJBtSP9L4sqIe_q%252F-MPnJBQf73uIOGhK2XwX%252F-MPnPEqPllK3ltBHgWKD%252Fblue_checkmark_ms.png%3Falt%3Dmedia%26token%3D30e92bd2-9b94-40c3-b9d8-a01685686124&#x26;width=300&#x26;dpr=4&#x26;quality=100&#x26;sign=cecb57bb&#x26;sv=1" alt="Blue Checkmark Ms"></td><td></td></tr><tr><td><img src="/files/VIus0fCLHHAtyA4mwJrM" alt="" data-size="line"></td><td>DOM</td><td>-</td><td></td></tr><tr><td><img src="/files/yitfml4gF34ffzihtPR6" alt="" data-size="line"></td><td>Drawings</td><td>-</td><td></td></tr><tr><td><img src="/files/3zHqcb8YSqFLasqDkyxV" alt="" data-size="line"></td><td>Grid</td><td><img src="https://docs.agenatrader.com/~gitbook/image?url=https%3A%2F%2F2805764894-files.gitbook.io%2F%7E%2Ffiles%2Fv0%2Fb%2Fgitbook-legacy-files%2Fo%2Fassets%252F-MKZSsJBtSP9L4sqIe_q%252F-MPnJBQf73uIOGhK2XwX%252F-MPnPEqPllK3ltBHgWKD%252Fblue_checkmark_ms.png%3Falt%3Dmedia%26token%3D30e92bd2-9b94-40c3-b9d8-a01685686124&#x26;width=300&#x26;dpr=4&#x26;quality=100&#x26;sign=cecb57bb&#x26;sv=1" alt="Blue Checkmark Ms"></td><td></td></tr><tr><td><img src="/files/jmVoJZyCYv6RmoKawnME" alt="" data-size="line"></td><td>Indicators</td><td><img src="https://docs.agenatrader.com/~gitbook/image?url=https%3A%2F%2F2805764894-files.gitbook.io%2F%7E%2Ffiles%2Fv0%2Fb%2Fgitbook-legacy-files%2Fo%2Fassets%252F-MKZSsJBtSP9L4sqIe_q%252F-MPnJBQf73uIOGhK2XwX%252F-MPnPEqPllK3ltBHgWKD%252Fblue_checkmark_ms.png%3Falt%3Dmedia%26token%3D30e92bd2-9b94-40c3-b9d8-a01685686124&#x26;width=300&#x26;dpr=4&#x26;quality=100&#x26;sign=cecb57bb&#x26;sv=1" alt="Blue Checkmark Ms"></td><td></td></tr><tr><td><img src="https://docs.agenatrader.com/~gitbook/image?url=https%3A%2F%2F2805764894-files.gitbook.io%2F%7E%2Ffiles%2Fv0%2Fb%2Fgitbook-legacy-files%2Fo%2Fassets%252F-MKZSsJBtSP9L4sqIe_q%252F-MPn3oT4OcTPQ1g6g2-L%252F-MPnD3K50PVl-HjSodDI%252Fes.png%3Falt%3Dmedia%26token%3D385b0310-e75b-40a8-9013-7d9ea00d38a0&#x26;width=300&#x26;dpr=4&#x26;quality=100&#x26;sign=5626cfef&#x26;sv=1" alt="Es"></td><td>Instrument</td><td>-</td><td></td></tr><tr><td>-</td><td>Number of charts</td><td><img src="https://docs.agenatrader.com/~gitbook/image?url=https%3A%2F%2F2805764894-files.gitbook.io%2F%7E%2Ffiles%2Fv0%2Fb%2Fgitbook-legacy-files%2Fo%2Fassets%252F-MKZSsJBtSP9L4sqIe_q%252F-MPnJBQf73uIOGhK2XwX%252F-MPnPEqPllK3ltBHgWKD%252Fblue_checkmark_ms.png%3Falt%3Dmedia%26token%3D30e92bd2-9b94-40c3-b9d8-a01685686124&#x26;width=300&#x26;dpr=4&#x26;quality=100&#x26;sign=cecb57bb&#x26;sv=1" alt="Blue Checkmark Ms"></td><td></td></tr><tr><td><img src="/files/kgMWaBrocu5QFEblgpD1" alt="" data-size="line"></td><td>Pointer</td><td><img src="https://docs.agenatrader.com/~gitbook/image?url=https%3A%2F%2F2805764894-files.gitbook.io%2F%7E%2Ffiles%2Fv0%2Fb%2Fgitbook-legacy-files%2Fo%2Fassets%252F-MKZSsJBtSP9L4sqIe_q%252F-MPnJBQf73uIOGhK2XwX%252F-MPnPEqPllK3ltBHgWKD%252Fblue_checkmark_ms.png%3Falt%3Dmedia%26token%3D30e92bd2-9b94-40c3-b9d8-a01685686124&#x26;width=300&#x26;dpr=4&#x26;quality=100&#x26;sign=cecb57bb&#x26;sv=1" alt="Blue Checkmark Ms"></td><td></td></tr><tr><td><img src="/files/eq3GWTzWwVWqQdybdhnk" alt="" data-size="line"></td><td>Price Style</td><td><img src="https://docs.agenatrader.com/~gitbook/image?url=https%3A%2F%2F2805764894-files.gitbook.io%2F%7E%2Ffiles%2Fv0%2Fb%2Fgitbook-legacy-files%2Fo%2Fassets%252F-MKZSsJBtSP9L4sqIe_q%252F-MPnJBQf73uIOGhK2XwX%252F-MPnPEqPllK3ltBHgWKD%252Fblue_checkmark_ms.png%3Falt%3Dmedia%26token%3D30e92bd2-9b94-40c3-b9d8-a01685686124&#x26;width=300&#x26;dpr=4&#x26;quality=100&#x26;sign=cecb57bb&#x26;sv=1" alt="Blue Checkmark Ms"></td><td></td></tr><tr><td><img src="/files/Zf4UdyWNFtkhrSKBrYch" alt="" data-size="line"></td><td>Public Mode</td><td>-</td><td></td></tr><tr><td><img src="https://docs.agenatrader.com/~gitbook/image?url=https%3A%2F%2F2805764894-files.gitbook.io%2F%7E%2Ffiles%2Fv0%2Fb%2Fgitbook-legacy-files%2Fo%2Fassets%252F-MKZSsJBtSP9L4sqIe_q%252F-MPnJBQf73uIOGhK2XwX%252F-MPnQtCxpI8Mz_7sWcSY%252Fquicktrader_button.png%3Falt%3Dmedia%26token%3Dacb650f4-307b-43d0-858a-a607fd82ae4f&#x26;width=300&#x26;dpr=4&#x26;quality=100&#x26;sign=6750ab90&#x26;sv=1" alt="Quicktrader Button"></td><td>Quick Trader</td><td>-</td><td></td></tr><tr><td><img src="/files/J2dTNJbSfOTOATarFf6P" alt="" data-size="line"></td><td>Quote markers line</td><td><img src="https://docs.agenatrader.com/~gitbook/image?url=https%3A%2F%2F2805764894-files.gitbook.io%2F%7E%2Ffiles%2Fv0%2Fb%2Fgitbook-legacy-files%2Fo%2Fassets%252F-MKZSsJBtSP9L4sqIe_q%252F-MPnJBQf73uIOGhK2XwX%252F-MPnPEqPllK3ltBHgWKD%252Fblue_checkmark_ms.png%3Falt%3Dmedia%26token%3D30e92bd2-9b94-40c3-b9d8-a01685686124&#x26;width=300&#x26;dpr=4&#x26;quality=100&#x26;sign=cecb57bb&#x26;sv=1" alt="Blue Checkmark Ms"></td><td></td></tr><tr><td><img src="/files/MhdqnLjjQVOdh5TP1o72" alt="" data-size="line"></td><td>Show all history</td><td>-</td><td></td></tr><tr><td><img src="/files/mnuhfp7hfUKttvyimqjc" alt="" data-size="line"></td><td>Start AT++</td><td>-</td><td></td></tr><tr><td><img src="/files/HNFqH9NHIctr8PueZjGD" alt="" data-size="line"></td><td>Strategies</td><td>-</td><td></td></tr><tr><td><img src="/files/rTETRGcQoea33sPfccpm" alt="" data-size="line"></td><td>Switch to pre/post market data</td><td>-</td><td></td></tr><tr><td><img src="https://docs.agenatrader.com/~gitbook/image?url=https%3A%2F%2F2805764894-files.gitbook.io%2F%7E%2Ffiles%2Fv0%2Fb%2Fgitbook-legacy-files%2Fo%2Fassets%252F-MKZSsJBtSP9L4sqIe_q%252F-MPn3oT4OcTPQ1g6g2-L%252F-MPnDC0gTeAcRq8fqOuV%252Ficon2.png%3Falt%3Dmedia%26token%3Dc8b3d7bf-b1f5-45e9-a977-06f276936069&#x26;width=300&#x26;dpr=4&#x26;quality=100&#x26;sign=f8f07d57&#x26;sv=1" alt="Icon2"></td><td>TimeFrame</td><td><img src="https://docs.agenatrader.com/~gitbook/image?url=https%3A%2F%2F2805764894-files.gitbook.io%2F%7E%2Ffiles%2Fv0%2Fb%2Fgitbook-legacy-files%2Fo%2Fassets%252F-MKZSsJBtSP9L4sqIe_q%252F-MPnJBQf73uIOGhK2XwX%252F-MPnPEqPllK3ltBHgWKD%252Fblue_checkmark_ms.png%3Falt%3Dmedia%26token%3D30e92bd2-9b94-40c3-b9d8-a01685686124&#x26;width=300&#x26;dpr=4&#x26;quality=100&#x26;sign=cecb57bb&#x26;sv=1" alt="Blue Checkmark Ms"></td><td></td></tr><tr><td><img src="/files/ufmJuCN3wlEf4X93wQG8" alt="" data-size="line"></td><td>Trade Visualization</td><td><img src="https://docs.agenatrader.com/~gitbook/image?url=https%3A%2F%2F2805764894-files.gitbook.io%2F%7E%2Ffiles%2Fv0%2Fb%2Fgitbook-legacy-files%2Fo%2Fassets%252F-MKZSsJBtSP9L4sqIe_q%252F-MPnJBQf73uIOGhK2XwX%252F-MPnPEqPllK3ltBHgWKD%252Fblue_checkmark_ms.png%3Falt%3Dmedia%26token%3D30e92bd2-9b94-40c3-b9d8-a01685686124&#x26;width=300&#x26;dpr=4&#x26;quality=100&#x26;sign=cecb57bb&#x26;sv=1" alt="Blue Checkmark Ms"></td><td></td></tr><tr><td><img src="/files/rkWb6DLU8OGccdVr0xvm" alt="" data-size="line"></td><td>Trading Pad</td><td>-</td><td></td></tr><tr><td><img src="/files/K4IeG2t4p1DUotw7YQQH" alt="" data-size="line"><img src="/files/EI9Hj5ehJiaWMI6jvlEs" alt="" data-size="line"></td><td>Zoom In/Out</td><td><img src="https://docs.agenatrader.com/~gitbook/image?url=https%3A%2F%2F2805764894-files.gitbook.io%2F%7E%2Ffiles%2Fv0%2Fb%2Fgitbook-legacy-files%2Fo%2Fassets%252F-MKZSsJBtSP9L4sqIe_q%252F-MPnJBQf73uIOGhK2XwX%252F-MPnPEqPllK3ltBHgWKD%252Fblue_checkmark_ms.png%3Falt%3Dmedia%26token%3D30e92bd2-9b94-40c3-b9d8-a01685686124&#x26;width=300&#x26;dpr=4&#x26;quality=100&#x26;sign=cecb57bb&#x26;sv=1" alt="Blue Checkmark Ms"></td><td></td></tr></tbody></table>

Since drawing tools are instrument-specific, they are not included in templates.

<figure><img src="https://docs.agenatrader.com/~gitbook/image?url=https%3A%2F%2F2805764894-files.gitbook.io%2F%7E%2Ffiles%2Fv0%2Fb%2Fgitbook-legacy-files%2Fo%2Fassets%252F-MKZSsJBtSP9L4sqIe_q%252F-MPnTkthfsbB8xOD3aVI%252F-MPnUF9HmNzOzlrX7Krh%252Fchart.png%3Falt%3Dmedia%26token%3D0a8a55ea-23c7-40c4-bb7d-37111c859435&#x26;width=768&#x26;dpr=4&#x26;quality=100&#x26;sign=f077eca3&#x26;sv=1" alt=""><figcaption></figcaption></figure>

*In order to open a list of saved chart templates use one of the options:*

1. Left click on the <img src="/files/vbGxppu2XjqjUhwjrnKy" alt="" data-size="line"> icon within the chart toolbar.
2. Right click in the charting area to bring up the chart context menu, then select **Settings** followed by the **Chart Templates** menu item.

<figure><img src="https://docs.agenatrader.com/~gitbook/image?url=https%3A%2F%2F2805764894-files.gitbook.io%2F%7E%2Ffiles%2Fv0%2Fb%2Fgitbook-legacy-files%2Fo%2Fassets%252F-MKZSsJBtSP9L4sqIe_q%252F-MPnTkthfsbB8xOD3aVI%252F-MPnUNuSymx5N8XjewWl%252Ftemplate.png%3Falt%3Dmedia%26token%3D7903ac55-cc71-4baa-aff6-8dcc8437928c&#x26;width=768&#x26;dpr=4&#x26;quality=100&#x26;sign=3be3cb4b&#x26;sv=1" alt=""><figcaption></figcaption></figure>

To load a saved template, right click on the chart and select **Settings -> Chart Templates -> Load** from the context menu.

<figure><img src="https://docs.agenatrader.com/~gitbook/image?url=https%3A%2F%2F2805764894-files.gitbook.io%2F%7E%2Ffiles%2Fv0%2Fb%2Fgitbook-legacy-files%2Fo%2Fassets%252F-MKZSsJBtSP9L4sqIe_q%252F-MPnTkthfsbB8xOD3aVI%252F-MPnUUMz9cSBAmGhl5R_%252Fcontext.png%3Falt%3Dmedia%26token%3D3d49c3d5-963f-459f-b154-642cabf3a99d&#x26;width=768&#x26;dpr=4&#x26;quality=100&#x26;sign=fa4ffbd1&#x26;sv=1" alt=""><figcaption></figcaption></figure>

Once you click on **Select**, the following popup window will appear. Within this window you can choose the desired chart template from the drop-down list.

<figure><img src="https://docs.agenatrader.com/~gitbook/image?url=https%3A%2F%2F2805764894-files.gitbook.io%2F%7E%2Ffiles%2Fv0%2Fb%2Fgitbook-legacy-files%2Fo%2Fassets%252F-MKZSsJBtSP9L4sqIe_q%252F-MPnTkthfsbB8xOD3aVI%252F-MPnUY6oYJlfPMeTT5XX%252FSelectTemplateCreateChart.png%3Falt%3Dmedia%26token%3D7c70d63f-7b78-49a2-bf53-36c0725f4184&#x26;width=768&#x26;dpr=4&#x26;quality=100&#x26;sign=ace64606&#x26;sv=1" alt=""><figcaption></figcaption></figure>

Chart templates can also be directly selected when creating a new chart:

<figure><img src="https://docs.agenatrader.com/~gitbook/image?url=https%3A%2F%2F2805764894-files.gitbook.io%2F%7E%2Ffiles%2Fv0%2Fb%2Fgitbook-legacy-files%2Fo%2Fassets%252F-MKZSsJBtSP9L4sqIe_q%252F-MPnTkthfsbB8xOD3aVI%252F-MPnUb5KOD5ZErEbcvFZ%252FCreateChart.png%3Falt%3Dmedia%26token%3Db39fbe00-08fd-4374-9a32-259b3cfe30e6&#x26;width=768&#x26;dpr=4&#x26;quality=100&#x26;sign=726959b5&#x26;sv=1" alt=""><figcaption></figcaption></figure>

## <img src="/files/oWXEvbLQeGH2XJVtQGkh" alt="" data-size="line"> Add to instrument list

To add the instrument currently being used in the chart to the selected instrument list, use one of the following methods:

* Left click on the <img src="/files/VtWrhfWYPP7xtlH8k367" alt="" data-size="line"> icon within the chart toolbar.
* Right click in the charting area to bring up the chart context menu, then select **Settings** followed by the **Instrument List** menu item.

<figure><img src="https://docs.agenatrader.com/~gitbook/image?url=https%3A%2F%2F2805764894-files.gitbook.io%2F%7E%2Ffiles%2Fv0%2Fb%2Fgitbook-legacy-files%2Fo%2Fassets%252F-MKZSsJBtSP9L4sqIe_q%252F-MPnTkthfsbB8xOD3aVI%252F-MPnUmPXUgnflRWpQJmT%252FAdd_toUnstrumentList.png%3Falt%3Dmedia%26token%3Df9d94d84-4903-471e-bf87-d113165fca17&#x26;width=768&#x26;dpr=4&#x26;quality=100&#x26;sign=7fced612&#x26;sv=1" alt=""><figcaption></figcaption></figure>

You can manage all available instrument lists using the [Instrument Editor](https://docs.agenatrader.com/tools/instrument-escort).

## <img src="/files/gZBMsITFzw14EFTWUtuA" alt="" data-size="line"> Chart grid

The grid function activates/deactivates horizontal, vertical and end-of-day grid lines on the chart.

*You can access the chart grid options by doing one of the following:*

1. Left click on the <img src="/files/fn6heW08iRMlxTWdZjaG" alt="" data-size="line"> icon within the chart toolbar.
2. Right click in the charting area to bring up the chart context menu, then select **Settings** followed by the **Grid** menu item.

<figure><img src="https://docs.agenatrader.com/~gitbook/image?url=https%3A%2F%2F2805764894-files.gitbook.io%2F%7E%2Ffiles%2Fv0%2Fb%2Fgitbook-legacy-files%2Fo%2Fassets%252F-MKZSsJBtSP9L4sqIe_q%252F-MPnTkthfsbB8xOD3aVI%252F-MPnUvn5C7C1Mg2QiGcK%252FchartGrid.png%3Falt%3Dmedia%26token%3D19ea6ee2-2f41-4268-98ec-8c5421c3abcc&#x26;width=768&#x26;dpr=4&#x26;quality=100&#x26;sign=5f892ee9&#x26;sv=1" alt=""><figcaption></figcaption></figure>

## <img src="/files/yiQPOwiI72oxjjTpYD7J" alt="" data-size="line"> Price markers and spread markers

*To access marker settings for price and spread use one of the following methods:*

1. Left click on the <img src="/files/r4PoIItXqB0lGRngKnje" alt="" data-size="line"> icon within the chart toolbar.
2. Right click in the charting area to bring up the chart context menu, then select **Settings** followed by the **Quote Markers & Lines** menu item.

You will be able to choose between the following settings:

* Show Price Marker: shows or hides the price markers.
* Show Price Line: shows or hides the price lines. The price line complies with the last price (if available).
* Show Price Alert Lines: display price alert lines on a chart.
* Show Spread Markers: shows or hides the spread markers.
* Show Spread Lines: shows or hides the spread lines.

<figure><img src="https://docs.agenatrader.com/~gitbook/image?url=https%3A%2F%2F2805764894-files.gitbook.io%2F%7E%2Ffiles%2Fv0%2Fb%2Fgitbook-legacy-files%2Fo%2Fassets%252F-MKZSsJBtSP9L4sqIe_q%252F-MPnTkthfsbB8xOD3aVI%252F-MPnV8UeoEsj5VXxTEGw%252FPrice%2520markers.png%3Falt%3Dmedia%26token%3D3c506ab1-fa41-4e19-8667-913da3233add&#x26;width=768&#x26;dpr=4&#x26;quality=100&#x26;sign=c6005b1&#x26;sv=1" alt=""><figcaption></figcaption></figure>

By default the **Ask line and the Ask marker** are displayed in green. By default the **Bid line and the Bid marker** are displayed in red.

See more [color settings](https://docs.agenatrader.com/main/chart-area/untitled/color) for further information.

<figure><img src="https://docs.agenatrader.com/~gitbook/image?url=https%3A%2F%2F2805764894-files.gitbook.io%2F%7E%2Ffiles%2Fv0%2Fb%2Fgitbook-legacy-files%2Fo%2Fassets%252F-MKZSsJBtSP9L4sqIe_q%252F-MPnTkthfsbB8xOD3aVI%252F-MPnVBcX5TZc_2ajYFgj%252FPrice%2520markers1-eng.png%3Falt%3Dmedia%26token%3De1a95f59-200e-485b-a8ff-5547cf75c3f8&#x26;width=768&#x26;dpr=4&#x26;quality=100&#x26;sign=873bdd9a&#x26;sv=1" alt=""><figcaption></figcaption></figure>

The following information will help you to better understand the relation between the terms "ASK / SELLER / BID" and "BID / BUYER / ASK".

Let's assume that you open a long position "on the market". You will pay the ASK price for this instrument, whereas a seller will receive the BID price. If you wish to sell the instrument again, you will receive the BID price and a buyer will pay ASK price.

<figure><img src="https://docs.agenatrader.com/~gitbook/image?url=https%3A%2F%2F2805764894-files.gitbook.io%2F%7E%2Ffiles%2Fv0%2Fb%2Fgitbook-legacy-files%2Fo%2Fassets%252F-MKZSsJBtSP9L4sqIe_q%252F-MPnTkthfsbB8xOD3aVI%252F-MPnVEqOlvEz5FPoIcM2%252FPrice%2520markers2.png%3Falt%3Dmedia%26token%3D34e574b7-ff9d-4205-9627-77c6b7aceb96&#x26;width=768&#x26;dpr=4&#x26;quality=100&#x26;sign=f258b3cf&#x26;sv=1" alt=""><figcaption></figcaption></figure>

## <img src="/files/6hOrds6FIbjadGImzKLn" alt="" data-size="line"> Trade visualization

*You can access trade visualization options by doing one of the following:*

1. Left click on the <img src="/files/9z5KXcS9TEpWFAuO3cXQ" alt="" data-size="line"> icon within the chart toolbar.
2. Right click in the charting area to bring up the chart context menu, then select **Settings** followed by the **Trade Visualization** menu item.

<figure><img src="https://docs.agenatrader.com/~gitbook/image?url=https%3A%2F%2F2805764894-files.gitbook.io%2F%7E%2Ffiles%2Fv0%2Fb%2Fgitbook-legacy-files%2Fo%2Fassets%252F-MKZSsJBtSP9L4sqIe_q%252F-MPnTkthfsbB8xOD3aVI%252F-MPnVP07UAtL3HdGttXJ%252FTrade%2520visualization.png%3Falt%3Dmedia%26token%3D16c696e3-919b-4165-aac7-6cd0595366ea&#x26;width=768&#x26;dpr=4&#x26;quality=100&#x26;sign=513c8549&#x26;sv=1" alt=""><figcaption></figcaption></figure>

**There are several functions for trade visualization available:**

* Show Traderbars: if enabled, chart trader bars will be shown on the chart.If deactivated you may see inscription on the bottom left side of the charting area:

<figure><img src="https://docs.agenatrader.com/~gitbook/image?url=https%3A%2F%2F2805764894-files.gitbook.io%2F%7E%2Ffiles%2Fv0%2Fb%2Fgitbook-legacy-files%2Fo%2Fassets%252F-MKZSsJBtSP9L4sqIe_q%252F-MPnTkthfsbB8xOD3aVI%252F-MPnVSMSmjIomnWdVG9F%252FOrderbar.png%3Falt%3Dmedia%26token%3D911cd5e4-45a0-4f87-89fb-9401c1e52d28&#x26;width=768&#x26;dpr=4&#x26;quality=100&#x26;sign=a9e1f0b9&#x26;sv=1" alt=""><figcaption></figcaption></figure>

* Entry/Exit markers: indicate where you entered or exited a trade:
  * green arrows pointing up show buy orders;
  * red arrows pointing down show sell orders.
* TradeLines: if enabled, entry/exit markers will be interconnected, indicating a trend (both entry and exit markers must be enabled):
  * green lines show profitable trades;
  * red lines show losing trades.
* Show Executions:if enabled, you'll see the text “order size @ price” (e.g. 50 @ 78.52) for each execution that you have received from the broker.
* StopLines: if enabled, stop lines (HardTrail and SoftTrail) are visible on the chart. This functionality is only available in the AgenaTrader++ versions.

<figure><img src="https://docs.agenatrader.com/~gitbook/image?url=https%3A%2F%2F2805764894-files.gitbook.io%2F%7E%2Ffiles%2Fv0%2Fb%2Fgitbook-legacy-files%2Fo%2Fassets%252F-MKZSsJBtSP9L4sqIe_q%252F-MPnTkthfsbB8xOD3aVI%252F-MPnVYwpOhdwFm0vHQGg%252FMarekrs.jpg%3Falt%3Dmedia%26token%3D9965645a-9d42-470f-a25b-231493afa2d9&#x26;width=768&#x26;dpr=4&#x26;quality=100&#x26;sign=24c8b525&#x26;sv=1" alt=""><figcaption></figcaption></figure>

### Show Executions <a href="#show_executions" id="show_executions"></a>

You may find this feature in the chart toolbar under chart markings (see image on left). It is not possible to display the executions at the same time as the entry/exit markings and trade lines. You have to choose one option. When the feature “Show Executions” is active, then you see the text “order size @ price” (e.g. 50 @ 78.52) for each execution that you have received from the broker. You can compare these prices with the Execution Manager in the Trading Center. Now you can have a very clear overview even in the chart of which prices you have set up your positions at, and can better estimate a profit or loss, and accordingly adjust your strategy.

<figure><img src="https://docs.agenatrader.com/~gitbook/image?url=https%3A%2F%2F2805764894-files.gitbook.io%2F%7E%2Ffiles%2Fv0%2Fb%2Fgitbook-legacy-files%2Fo%2Fassets%252F-MKZSsJBtSP9L4sqIe_q%252F-MPnTkthfsbB8xOD3aVI%252F-MPnVdaHyijYaFqHSwE5%252Fexecutions.png%3Falt%3Dmedia%26token%3Dad2ad9c0-8ce5-4c30-b92d-519ab5b2dbd2&#x26;width=768&#x26;dpr=4&#x26;quality=100&#x26;sign=7512304c&#x26;sv=1" alt=""><figcaption></figcaption></figure>

### Chart trader bar <a href="#chart_trader_bar" id="chart_trader_bar"></a>

Additionally, you will see that the chart trader bar similar to chart markings also adapts to the average price of all executions, shifting to the calculated price level. The profit and loss display also already calculates the possible profit or loss when you exit the market at the current price. However, keep in mind that we have not taken into account which executions you will receive when you exit, and that the profit and loss can deviate slightly despite this.

<figure><img src="https://docs.agenatrader.com/~gitbook/image?url=https%3A%2F%2F2805764894-files.gitbook.io%2F%7E%2Ffiles%2Fv0%2Fb%2Fgitbook-legacy-files%2Fo%2Fassets%252F-MKZSsJBtSP9L4sqIe_q%252F-MPnTkthfsbB8xOD3aVI%252F-MPnVn35dYWzeePTSSYP%252FChart%2520trader%2520bar.png%3Falt%3Dmedia%26token%3De6d75c73-db61-46ca-9df2-56a47b848dcc&#x26;width=768&#x26;dpr=4&#x26;quality=100&#x26;sign=8d3b8a31&#x26;sv=1" alt=""><figcaption></figcaption></figure>

### Entry/exit chart markings and the trade lines <a href="#entry_exit_chart_markings_and_the_trade_lines" id="entry_exit_chart_markings_and_the_trade_lines"></a>

When you activate the entry/exit chart markings, you will notice that although the entry marking stops at the correct time (y-axis), it often shifts similarly to the trader bar. We calculate the average price for all executions during the position and display this with the entry chart markings. You may notice the arrow hovering away from the chart prices.

<figure><img src="https://docs.agenatrader.com/~gitbook/image?url=https%3A%2F%2F2805764894-files.gitbook.io%2F%7E%2Ffiles%2Fv0%2Fb%2Fgitbook-legacy-files%2Fo%2Fassets%252F-MKZSsJBtSP9L4sqIe_q%252F-MPnTkthfsbB8xOD3aVI%252F-MPnVvDEzPTdhNNp-L5A%252Fchart%2520entry.png%3Falt%3Dmedia%26token%3D0a2c154f-d93b-4dde-9fcb-7eb382bf57b3&#x26;width=768&#x26;dpr=4&#x26;quality=100&#x26;sign=8e33cd02&#x26;sv=1" alt=""><figcaption></figcaption></figure>

The green lines show you the profits of the partial positions, while the red lines show the losses. The red (short) entry arrow is located exactly at the point in time of the position opening, but almost 1 euro below the entry price. Here you can see an average price of all executions (short) and multiple exit chart markings.

<figure><img src="https://docs.agenatrader.com/~gitbook/image?url=https%3A%2F%2F2805764894-files.gitbook.io%2F%7E%2Ffiles%2Fv0%2Fb%2Fgitbook-legacy-files%2Fo%2Fassets%252F-MKZSsJBtSP9L4sqIe_q%252F-MPnTkthfsbB8xOD3aVI%252F-MPnW2T66UDiQXDIdmca%252Fchart%2520entry%2520green%2520line.png%3Falt%3Dmedia%26token%3D654d4096-d98d-44a4-a8af-8f7c1c0fc681&#x26;width=768&#x26;dpr=4&#x26;quality=100&#x26;sign=5d4a3422&#x26;sv=1" alt=""><figcaption></figcaption></figure>

## <img src="/files/MMJ7eQVegWnmbiqYFSuA" alt="" data-size="line"> Saving as image

*You can save a snapshot of the chart by doing one of the following:*

1. Left click on the <img src="/files/xYjyFFqdf3sfN82TtWGH" alt="" data-size="line"> icon within the chart toolbar.
2. Right click in the charting area to bring up the chart context menu, then select **Settings** followed by the **Save as Image** menu item.

<figure><img src="https://docs.agenatrader.com/~gitbook/image?url=https%3A%2F%2F2805764894-files.gitbook.io%2F%7E%2Ffiles%2Fv0%2Fb%2Fgitbook-legacy-files%2Fo%2Fassets%252F-MKZSsJBtSP9L4sqIe_q%252F-MPnTkthfsbB8xOD3aVI%252F-MPnWERYbtdO3vsvKBKA%252Fsave%2520as%2520image.png%3Falt%3Dmedia%26token%3D1bfa565f-2ecf-43f5-80f1-fe8fa35e2ff6&#x26;width=768&#x26;dpr=4&#x26;quality=100&#x26;sign=47cb208f&#x26;sv=1" alt=""><figcaption></figcaption></figure>

Watch this short [Chart Toolbar: Chart templates](https://docs.agenatrader.com/main/chart-area/untitled/chart-templates) video for further information.

## <img src="/files/23Q8NmvwNrsVNbodsegF" alt="" data-size="line"> Print

*You can open the printing dialog window, which enables you to print a chart, by doing one of the following:*

1. Left click on the <img src="/files/Y1CNXUxcKYraxSpzQKOw" alt="" data-size="line"> icon within the chart toolbar.
2. Right click in the charting area to bring up the chart context menu, then select **Settings** followed by the **Print** menu item.

<figure><img src="https://docs.agenatrader.com/~gitbook/image?url=https%3A%2F%2F2805764894-files.gitbook.io%2F%7E%2Ffiles%2Fv0%2Fb%2Fgitbook-legacy-files%2Fo%2Fassets%252F-MKZSsJBtSP9L4sqIe_q%252F-MPnTkthfsbB8xOD3aVI%252F-MPnWNVHztl2iyUcm9So%252FChart_print.png%3Falt%3Dmedia%26token%3D6bf91d08-302d-40bd-80a4-7cfa31abc199&#x26;width=768&#x26;dpr=4&#x26;quality=100&#x26;sign=3292e715&#x26;sv=1" alt=""><figcaption></figcaption></figure>

## <img src="/files/AOXfj3O8mA5i0nJIWhyL" alt="" data-size="line"> Export to MS Excel

This option allows you to export an instrument's historical data (limited to the number of loaded candlesticks or to the interval specified in the chart) into a CSV file.

*You can export data into a CSV file by using one of the methods:*

1. Left click on the <img src="/files/lmJasXLfaQMbjM1db9KH" alt="" data-size="line"> icon within the chart toolbar.
2. Right click in the charting area to bring up the chart context menu, then select **Settings** followed by the **Export to MS Excel** menu item.

*The following can be saved:*

* Timestamp
* Open prices
* High prices
* Low prices
* Close prices
* Different indicator descriptions and their values.

## <img src="/files/tN3vbIM8rAGBgB85kszi" alt="" data-size="line"> Color

*You can apply various color settings to the chart by doing one of the following:*

1. Left click on the <img src="/files/llDaRRJGIUJeEs4WcrUE" alt="" data-size="line"> icon within the chart toolbar.
2. Right click in the charting area to bring up the chart context menu, then select **Settings** followed by the **Color** menu item.

<figure><img src="https://docs.agenatrader.com/~gitbook/image?url=https%3A%2F%2F2805764894-files.gitbook.io%2F%7E%2Ffiles%2Fv0%2Fb%2Fgitbook-legacy-files%2Fo%2Fassets%252F-MKZSsJBtSP9L4sqIe_q%252F-MPnTkthfsbB8xOD3aVI%252F-MPnWhAavv7J0mYRMVdV%252FColor.jpg%3Falt%3Dmedia%26token%3Dd05cfc53-a962-4fca-89ae-1a92c6b9c7a5&#x26;width=768&#x26;dpr=4&#x26;quality=100&#x26;sign=6b6cae71&#x26;sv=1" alt=""><figcaption></figcaption></figure>

*Description of menu items:*

* Back color: sets the background color.
* Gradient Top Color: sets the background color as a gradient fading into white from top to bottom
* Gradient Bottom Color: sets the background color as a gradient fading into white from bottom to top
* Date Font: sets the font for the time axis
* Price Font: sets the font for the price axis
* Chart Font: sets the font for a chart
* Execution Font: sets the font for the execution
* Grid X Color: sets the color of X grids on the chart
* Grid Y Color: sets the color of Y grids on the chart
* Day-Break Color: sets the color of Day-Break on the chart
* Candle Properties: includes settings for candlestick display e.g. color of upward and downward ticks

<figure><img src="https://docs.agenatrader.com/~gitbook/image?url=https%3A%2F%2F2805764894-files.gitbook.io%2F%7E%2Ffiles%2Fv0%2Fb%2Fgitbook-legacy-files%2Fo%2Fassets%252F-MKZSsJBtSP9L4sqIe_q%252F-MPnTkthfsbB8xOD3aVI%252F-MPnWlFI4S5JZgHM7_Xv%252FCandleProperties.png%3Falt%3Dmedia%26token%3D5100233f-30d7-4688-a9f0-9067d130e875&#x26;width=768&#x26;dpr=4&#x26;quality=100&#x26;sign=e0f2e9f9&#x26;sv=1" alt=""><figcaption></figcaption></figure>

* Show Candles At Front: if enabled, the "price style" used by you will be applied to indicators. All indicators will be displayed behind the chart candles or other chart styles.
* Show Bar Timer: if enabled, the bar timer will be shown in the lower right portion of the charting window. It displays the progress of the currently selected "price style" (chart appearance).
* Price Lines & Markers: sets the color of price lines and bid/ask price markers

<figure><img src="https://docs.agenatrader.com/~gitbook/image?url=https%3A%2F%2F2805764894-files.gitbook.io%2F%7E%2Ffiles%2Fv0%2Fb%2Fgitbook-legacy-files%2Fo%2Fassets%252F-MKZSsJBtSP9L4sqIe_q%252F-MPnTkthfsbB8xOD3aVI%252F-MPnWr8qlWoUVNJnXS3O%252FPriceLines.png%3Falt%3Dmedia%26token%3D0bc4e035-363b-4ac7-a888-ec9c654c7faa&#x26;width=768&#x26;dpr=4&#x26;quality=100&#x26;sign=8a25c0af&#x26;sv=1" alt=""><figcaption></figcaption></figure>

* Once you have selected a menu option from the list, the appropriate dialog window for color selection will appear:

<figure><img src="https://docs.agenatrader.com/~gitbook/image?url=https%3A%2F%2F2805764894-files.gitbook.io%2F%7E%2Ffiles%2Fv0%2Fb%2Fgitbook-legacy-files%2Fo%2Fassets%252F-MKZSsJBtSP9L4sqIe_q%252F-MPnTkthfsbB8xOD3aVI%252F-MPnWwJ3yTs1teJAyly_%252FColorPriceLines.png%3Falt%3Dmedia%26token%3D2e6a4908-abb6-4845-8a9b-9418d46ce38d&#x26;width=768&#x26;dpr=4&#x26;quality=100&#x26;sign=8f2beefe&#x26;sv=1" alt=""><figcaption></figcaption></figure>

* QuickTrader settings: includes settings for QuickTrader display e.g. color

<figure><img src="https://docs.agenatrader.com/~gitbook/image?url=https%3A%2F%2F2805764894-files.gitbook.io%2F%7E%2Ffiles%2Fv0%2Fb%2Fgitbook-legacy-files%2Fo%2Fassets%252F-MKZSsJBtSP9L4sqIe_q%252F-MPnTkthfsbB8xOD3aVI%252F-MPnWzXNlxh7zO1zMMj_%252Fquicktrader.png%3Falt%3Dmedia%26token%3Dceebb36f-42a8-483f-86ad-0c821d066f11&#x26;width=768&#x26;dpr=4&#x26;quality=100&#x26;sign=2846009d&#x26;sv=1" alt=""><figcaption></figcaption></figure>

## <img src="/files/TBjzQ2NLB1JjoEly1Zoq" alt="" data-size="line"> DOM trading pad

*You can use DOM as a trading pad by doing one of the following:*

1. Left click on the <img src="/files/8cXDB1QjIJKbdWMOI4cf" alt="" data-size="line"> icon within the chart toolbar.
2. Right click in the charting area to bring up the chart context menu, then select **Settings** followed by the **DOM** menu item.

Further information can be found in the [**DOM**](https://docs.agenatrader.com/main/main-menu/dom) section.<br>


# Chart Context Menu

Right clicking in the charting area will bring up the chart menu with the following options:

<figure><img src="/files/hT8ZtByw1QBBPX0rMzkm" alt=""><figcaption></figcaption></figure>

## <img src="/files/prhP5uV8hntgfKnSCp0W" alt="" data-size="line"> Reload data <a href="#reload-data" id="reload-data"></a>

Due to unforeseen circumstances, the chart may sometimes display incorrect data (missing prints etc.).

In this case it is necessary to reload data series from your data feed provider's server by doing the following:

1. Right click to open the context menu
2. Select the **Reload Data** menu option.

<figure><img src="https://docs.agenatrader.com/~gitbook/image?url=https%3A%2F%2F2805764894-files.gitbook.io%2F%7E%2Ffiles%2Fv0%2Fb%2Fgitbook-legacy-files%2Fo%2Fassets%252F-MKZSsJBtSP9L4sqIe_q%252F-MRLA_udm1pePaElq4RM%252F-MRLGgmwyWL9gCB4ozxK%252FchartMenuReloadData.png%3Falt%3Dmedia%26token%3D4cd49503-fa74-41c2-a8a2-bb126078c3e9&#x26;width=768&#x26;dpr=4&#x26;quality=100&#x26;sign=43c7156f&#x26;sv=1" alt=""><figcaption></figcaption></figure>

## <img src="/files/gRKZzYsRqsVIAF0ReYNb" alt="" data-size="line"> Reload scripts <a href="#reload-scripts" id="reload-scripts"></a>

This function allows you to recalculate all indicators. Right click on the chart and select the **Reload Scripts** menu item from the context menu.

<figure><img src="https://docs.agenatrader.com/~gitbook/image?url=https%3A%2F%2F2805764894-files.gitbook.io%2F%7E%2Ffiles%2Fv0%2Fb%2Fgitbook-legacy-files%2Fo%2Fassets%252F-MKZSsJBtSP9L4sqIe_q%252F-MRLA_udm1pePaElq4RM%252F-MRLHzNrg6ibcKvnWY6d%252FchartMenuReloadScripts.png%3Falt%3Dmedia%26token%3D5138a00f-c22b-4b12-8ad0-484ca4c38f43&#x26;width=768&#x26;dpr=4&#x26;quality=100&#x26;sign=81158ac&#x26;sv=1" alt=""><figcaption></figcaption></figure>

Watch the short video in the Chart Context Menu: Reload data section for further information.

## <img src="/files/8j9jozkbsMlwzxgGkVVB" alt="" data-size="line"> Add price alert <a href="#add-price-alert" id="add-price-alert"></a>

*The sound-based price alert can be added in the* [*Price alerts manager*](https://docs.agenatrader.com/tools/tools#Alerts) *tab by doing one of the following:*

1. Right click in the charting area to bring up the context menu, then select the **Add Price Alert** menu item.
2. Select **Tools** from the main menu followed by the **Alerts -> Price alert**.

<figure><img src="https://docs.agenatrader.com/~gitbook/image?url=https%3A%2F%2F2805764894-files.gitbook.io%2F%7E%2Ffiles%2Fv0%2Fb%2Fgitbook-legacy-files%2Fo%2Fassets%252F-MKZSsJBtSP9L4sqIe_q%252F-MRLI3IISlEvtnPbcH2L%252F-MRLJmECRmWkZIYu3xON%252FchartMenuAddPriceAltert.png%3Falt%3Dmedia%26token%3D39ed971c-ce0d-4733-bfee-7333268a3177&#x26;width=768&#x26;dpr=4&#x26;quality=100&#x26;sign=bb952962&#x26;sv=1" alt=""><figcaption></figcaption></figure>

Specific settings can also be called up by clicking the symbol (marked below) next to the cancel box.

<figure><img src="https://docs.agenatrader.com/~gitbook/image?url=https%3A%2F%2F2805764894-files.gitbook.io%2F%7E%2Ffiles%2Fv0%2Fb%2Fgitbook-legacy-files%2Fo%2Fassets%252F-MKZSsJBtSP9L4sqIe_q%252F-MRLK5xBokydyq1UvAuw%252F-MRLOwVGc0vbBenCcTyK%252FEditPriceAlert.png%3Falt%3Dmedia%26token%3Dc981d34f-cb3a-4e27-bf2f-6bc3f0cc28dc&#x26;width=768&#x26;dpr=4&#x26;quality=100&#x26;sign=2eead8ae&#x26;sv=1" alt=""><figcaption></figcaption></figure>

Next, select the sound for the price alert from the drop-down list:

<figure><img src="https://docs.agenatrader.com/~gitbook/image?url=https%3A%2F%2F2805764894-files.gitbook.io%2F%7E%2Ffiles%2Fv0%2Fb%2Fgitbook-legacy-files%2Fo%2Fassets%252F-MKZSsJBtSP9L4sqIe_q%252F-MRLK5xBokydyq1UvAuw%252F-MRLP-NNCj2OPSZJmAmF%252FChartMenuAddPriceAlert3.png%3Falt%3Dmedia%26token%3D2df62547-4754-476e-a8d3-59a240b459d2&#x26;width=768&#x26;dpr=4&#x26;quality=100&#x26;sign=a5b3c552&#x26;sv=1" alt=""><figcaption></figcaption></figure>

If you click on **Choose other...** the sound library window will open:

<figure><img src="https://docs.agenatrader.com/~gitbook/image?url=https%3A%2F%2F2805764894-files.gitbook.io%2F%7E%2Ffiles%2Fv0%2Fb%2Fgitbook-legacy-files%2Fo%2Fassets%252F-MKZSsJBtSP9L4sqIe_q%252F-MRLK5xBokydyq1UvAuw%252F-MRLP3sOzqAKtkXQ6jAF%252FChartMenuAddPriceAlert4-german.png%3Falt%3Dmedia%26token%3D20ddf8a3-caee-4958-952f-37e8bf666888&#x26;width=768&#x26;dpr=4&#x26;quality=100&#x26;sign=f78aa36e&#x26;sv=1" alt=""><figcaption></figcaption></figure>

If the market price reaches the price entered in the price alert, the specified sound will be heard. To program an e-mail to be sent when the price alert is activated:

* You can set this up under the [**Global Configuration**](https://docs.agenatrader.com/tools/configuration-escort) or
* Make the changes individually in the **Price alert tab** by right clicking the required price alert and selecting **Edit Alert**.

Price alerts can be managed within the [**Price alert manager**](https://docs.agenatrader.com/tools/tools#Price_Alerts). **Example 1.Deleting orders with a price alert (OCO orders created by holding the CTRL button).**

<figure><img src="https://docs.agenatrader.com/~gitbook/image?url=https%3A%2F%2F2805764894-files.gitbook.io%2F%7E%2Ffiles%2Fv0%2Fb%2Fgitbook-legacy-files%2Fo%2Fassets%252F-MKZSsJBtSP9L4sqIe_q%252F-MRLK5xBokydyq1UvAuw%252F-MRLREtTLnqk3i2kc4Xj%252FchartMenuOCOPriceAlert.png%3Falt%3Dmedia%26token%3Dc94f72d5-df4d-47a9-838e-e24d6b57ee57&#x26;width=768&#x26;dpr=4&#x26;quality=100&#x26;sign=d7caf3b2&#x26;sv=1" alt=""><figcaption></figcaption></figure>

**Example 2.Activating orders with a price alert (IfDone orders created by holding the Alt button).**

<figure><img src="https://docs.agenatrader.com/~gitbook/image?url=https%3A%2F%2F2805764894-files.gitbook.io%2F%7E%2Ffiles%2Fv0%2Fb%2Fgitbook-legacy-files%2Fo%2Fassets%252F-MKZSsJBtSP9L4sqIe_q%252F-MRLK5xBokydyq1UvAuw%252F-MRLS60ilXM4ZFwpMWH2%252FchartMenuIfDonePriceAlert.png%3Falt%3Dmedia%26token%3D59046305-db7c-45fc-89cb-e235f24378d4&#x26;width=768&#x26;dpr=4&#x26;quality=100&#x26;sign=caba8008&#x26;sv=1" alt=""><figcaption></figcaption></figure>

Take a look at this further [example with dynamic orders](https://docs.agenatrader.com/main/chart-area/order-escort#Dynamic_orders) and read more information about order combinations in the [Order groups (connections](https://docs.agenatrader.com/main/chart-area/untitled/chart-context-menu#Order_groups)) section.

**Important!** To make price alert visible on a chart please activate **Show Price Alert Lines**. Details on page [Chart Toolbar: Price markers and spread markers](https://docs.agenatrader.com/main/chart-area/untitled/price-markers-and-spread-markers)

## <img src="/files/8XvUPhttciJFMPOO4Z8Y" alt="" data-size="line"> Add Indicator Alert <a href="#add-indicator-alert" id="add-indicator-alert"></a>

*You can add an indicator alert by doing one of the following:*

1. Right click in the charting area to bring up the chart context menu, then select the **Add Indicator Alert** menu item
2. Select the [**Alerts -> Indicator Alert**](https://docs.agenatrader.com/tools/tools#Indicator_Alerts) menu option from the **Tools** main menu.

This functionality allows you to set an alert that will inform you when a particular indicator crosses the specified price level.

<figure><img src="https://docs.agenatrader.com/~gitbook/image?url=https%3A%2F%2F2805764894-files.gitbook.io%2F%7E%2Ffiles%2Fv0%2Fb%2Fgitbook-legacy-files%2Fo%2Fassets%252F-MKZSsJBtSP9L4sqIe_q%252F-MRPcJh_K0QX2yzoQpTP%252F-MRPcQmhOOtzS1sHeGXW%252Findicatoralert.png%3Falt%3Dmedia%26token%3Ddafeb5ea-5c92-4661-b430-f92d54e9386d&#x26;width=768&#x26;dpr=4&#x26;quality=100&#x26;sign=7e003986&#x26;sv=1" alt=""><figcaption></figcaption></figure>

Click the symbol marked on the image below to bring up the specific settings window.

<figure><img src="https://docs.agenatrader.com/~gitbook/image?url=https%3A%2F%2F2805764894-files.gitbook.io%2F%7E%2Ffiles%2Fv0%2Fb%2Fgitbook-legacy-files%2Fo%2Fassets%252F-MKZSsJBtSP9L4sqIe_q%252F-MRPeJYgbZtW5iGDNOdd%252F-MRPg7HyQVuOzETCyAOY%252FChartMenuAddPriceAlert1%2520%281%29.png%3Falt%3Dmedia%26token%3D95a6a294-e044-4afb-878a-1cc13d8fa28c&#x26;width=768&#x26;dpr=4&#x26;quality=100&#x26;sign=b94a6c5&#x26;sv=1" alt=""><figcaption></figcaption></figure>

Then select the sound directly from the price box drop-down list:

<figure><img src="https://docs.agenatrader.com/~gitbook/image?url=https%3A%2F%2F2805764894-files.gitbook.io%2F%7E%2Ffiles%2Fv0%2Fb%2Fgitbook-legacy-files%2Fo%2Fassets%252F-MKZSsJBtSP9L4sqIe_q%252F-MRPeJYgbZtW5iGDNOdd%252F-MRPgBfzWbq3_Zy8HkDf%252FChartMenuAddPriceAlert3%2520%281%29.png%3Falt%3Dmedia%26token%3D97839f02-c62d-4b6a-a0ad-202f983a51d4&#x26;width=768&#x26;dpr=4&#x26;quality=100&#x26;sign=8aba1d7&#x26;sv=1" alt=""><figcaption></figcaption></figure>

If you click on **Choose other...** the sound collection window will be opened:

<figure><img src="https://docs.agenatrader.com/~gitbook/image?url=https%3A%2F%2F2805764894-files.gitbook.io%2F%7E%2Ffiles%2Fv0%2Fb%2Fgitbook-legacy-files%2Fo%2Fassets%252F-MKZSsJBtSP9L4sqIe_q%252F-MRPeJYgbZtW5iGDNOdd%252F-MRPgG8kQWaYYpFwH5SG%252FChartMenuAddPriceAlert4-german%2520%281%29.png%3Falt%3Dmedia%26token%3D01b94768-3399-4780-a56b-e3d4338e3505&#x26;width=768&#x26;dpr=4&#x26;quality=100&#x26;sign=7c8ad1d1&#x26;sv=1" alt=""><figcaption></figcaption></figure>

As soon as the defined price is crossed by an indicator you will hear the selected sound once.

*If you wish to be informed about the triggered indicator alert via email, you can enable this:*

* In the [**Global Configuration: General**](https://docs.agenatrader.com/tools/configuration-escort#general) within the **Global Configuration** (general setting);
* By right clicking on the desired price alert in the **Price alert tab**. Select the **Edit Alert** menu item within the context menu (individual setting).

Upon the successful completion of the authorization process, you may share an individual chart or a chart group on Twitter.

![](https://docs.agenatrader.com/~gitbook/image?url=https%3A%2F%2F2805764894-files.gitbook.io%2F%7E%2Ffiles%2Fv0%2Fb%2Fgitbook-legacy-files%2Fo%2Fassets%252F-MKZSsJBtSP9L4sqIe_q%252F-MP9kDT9zA2O-o1q3pIu%252F-MP9wXjozG6OVwOaFgqP%252FTwitter_single.png%3Falt%3Dmedia%26token%3D50ed5892-20e8-436c-a54f-afbd9f50696f\&width=768\&dpr=4\&quality=100\&sign=6460b359\&sv=1)![](https://docs.agenatrader.com/~gitbook/image?url=https%3A%2F%2F2805764894-files.gitbook.io%2F%7E%2Ffiles%2Fv0%2Fb%2Fgitbook-legacy-files%2Fo%2Fassets%252F-MKZSsJBtSP9L4sqIe_q%252F-MP9kDT9zA2O-o1q3pIu%252F-MP9w_GuMGvbQTR3W2kB%252FTwitter_group.png%3Falt%3Dmedia%26token%3D060d4eef-5446-4876-9fa8-b4268451f64f\&width=768\&dpr=4\&quality=100\&sign=b542bd24\&sv=1)

Before publishing the post the following data can be entered:

| Option  | Description                                                                                            |
| ------- | ------------------------------------------------------------------------------------------------------ |
| Channel | Select your Twitter account                                                                            |
| Content | Here you can enter additional text information regarding the post.                                     |
| Picture | Shows the picture in the preview mode, which will be posted on the Twitter account (group or channel). |

## Settings <a href="#settings" id="settings"></a>

Settings can be accessed by right clicking in the charting area.

<figure><img src="https://docs.agenatrader.com/~gitbook/image?url=https%3A%2F%2F2805764894-files.gitbook.io%2F%7E%2Ffiles%2Fv0%2Fb%2Fgitbook-legacy-files%2Fo%2Fassets%252F-MKZSsJBtSP9L4sqIe_q%252F-MP9kDT9zA2O-o1q3pIu%252F-MP9weo9V_h_vn8wJW4_%252FchartMenuSettings.png%3Falt%3Dmedia%26token%3D1ec02032-51d6-4e61-91ee-bf9a209c2bdc&#x26;width=768&#x26;dpr=4&#x26;quality=100&#x26;sign=94e3cb31&#x26;sv=1" alt=""><figcaption></figcaption></figure>

| Icon                                                            | Name                                                                                                                          |
| --------------------------------------------------------------- | ----------------------------------------------------------------------------------------------------------------------------- |
| <img src="/files/4tYqhBeK4aUro8WuoFog" alt="" data-size="line"> | [One Click Trading Pad](/main/chart-trading#trading_from_the_chart-1)                                                         |
| AAPL                                                            | [Select instrument](https://docs.agenatrader.com/tools/instrument-escort)                                                     |
| 15 min                                                          | [Chart Toolbar: Time frame](https://docs.agenatrader.com/main/chart-area/untitled/time-frame)                                 |
| <img src="/files/eq3GWTzWwVWqQdybdhnk" alt="" data-size="line"> | [Chart Toolbar: Price style](https://docs.agenatrader.com/main/chart-area/untitled/price-styles)                              |
| <img src="/files/yitfml4gF34ffzihtPR6" alt="" data-size="line"> | [Drawing tools](https://docs.agenatrader.com/main/chart-area/untitled/drawing-objects)                                        |
| <img src="/files/9SK3m7XCNZS7BJB1HwUU" alt="" data-size="line"> | [Chart Toolbar: Color](https://docs.agenatrader.com/main/chart-area/untitled/color)                                           |
| <img src="/files/3zHqcb8YSqFLasqDkyxV" alt="" data-size="line"> | [Grid](https://docs.agenatrader.com/main/chart-area/untitled/chart-grid)                                                      |
| <img src="/files/kgMWaBrocu5QFEblgpD1" alt="" data-size="line"> | [Pointer](https://docs.agenatrader.com/main/chart-area/untitled/cursor-type)                                                  |
| <img src="/files/J2dTNJbSfOTOATarFf6P" alt="" data-size="line"> | [Quote markers & Lines](https://docs.agenatrader.com/main/chart-area/untitled/price-markers-and-spread-markers)               |
| <img src="/files/jmVoJZyCYv6RmoKawnME" alt="" data-size="line"> | [Chart Toolbar: Indicators](https://docs.agenatrader.com/main/chart-area/untitled/indicators)                                 |
| <img src="/files/HNFqH9NHIctr8PueZjGD" alt="" data-size="line"> | [Chart Toolbar: Strategies](https://docs.agenatrader.com/main/chart-area/untitled/strategies)                                 |
| <img src="/files/uyWSguPfsA4yA0mQW4W1" alt="" data-size="line"> | Edit indicator's parameters (see decription below)                                                                            |
| <img src="/files/P6mrmY59w8M7cIt08Yqs" alt="" data-size="line"> | Edit indicator (see decription below)                                                                                         |
| <img src="/files/POa6Joo27qiRtm92fasL" alt="" data-size="line"> | Remove indicator (see decription below)                                                                                       |
| <img src="/files/ufmJuCN3wlEf4X93wQG8" alt="" data-size="line"> | [Chart Toolbar: Trade visualization](https://docs.agenatrader.com/main/chart-area/untitled/trade-visualization)               |
| <img src="/files/Zf4UdyWNFtkhrSKBrYch" alt="" data-size="line"> | [Chart Toolbar: Public Mode](https://docs.agenatrader.com/main/chart-area/untitled/public-mode)                               |
| <img src="/files/MhdqnLjjQVOdh5TP1o72" alt="" data-size="line"> | [Chart Toolbar: Show All History](https://docs.agenatrader.com/main/chart-area/untitled/show-all-history)                     |
| <img src="/files/rTETRGcQoea33sPfccpm" alt="" data-size="line"> | [Switch to pre/post market data](https://docs.agenatrader.com/main/chart-area/untitled/switch-to-pre-and-post-market-data)    |
| <img src="/files/OtpTWyw4Yd2bAm5WXg1B" alt="" data-size="line"> | [Chart Toolbar: Bar Timer](https://docs.agenatrader.com/main/chart-area/untitled/bar-timer)                                   |
| <img src="/files/rkWb6DLU8OGccdVr0xvm" alt="" data-size="line"> | [Chart Toolbar: Standard chart trading pad](https://docs.agenatrader.com/main/chart-area/untitled/standard-chart-trading-pad) |
| <img src="/files/VIus0fCLHHAtyA4mwJrM" alt="" data-size="line"> | [DOM](https://docs.agenatrader.com/main/main-menu/dom)                                                                        |
| <img src="/files/XO60KRFnDJ1NQPCNGJCi" alt="" data-size="line"> | [3rd Level box](https://docs.agenatrader.com/main/main-menu/3rd-level-box)                                                    |
| <img src="/files/mnuhfp7hfUKttvyimqjc" alt="" data-size="line"> | [Start AgenaTrader++](https://docs.agenatrader.com/main/chart-area/untitled/start-agenatrader-plusplus)                       |
| <img src="/files/VtWrhfWYPP7xtlH8k367" alt="" data-size="line"> | [Instrument list](https://docs.agenatrader.com/main/chart-area/untitled/add-to-instrument-list)                               |
| <img src="/files/Y1CNXUxcKYraxSpzQKOw" alt="" data-size="line"> | [Chart Toolbar: Print](https://docs.agenatrader.com/main/chart-area/untitled/print)                                           |
| <img src="/files/xYjyFFqdf3sfN82TtWGH" alt="" data-size="line"> | [Chart Group: Save as Image](https://docs.agenatrader.com/main/chart-area/untitled/saving-as-image)                           |
| <img src="/files/lmJasXLfaQMbjM1db9KH" alt="" data-size="line"> | [Chart Toolbar: Export to MS Excel](https://docs.agenatrader.com/main/chart-area/untitled/export-to-ms-excel)                 |
| <img src="/files/Wz3hj6rFqhdP01SlsOFO" alt="" data-size="line"> | [Chart Toolbar: Orders templates](https://docs.agenatrader.com/main/chart-area/untitled/orders-templates)                     |
| <img src="/files/vbGxppu2XjqjUhwjrnKy" alt="" data-size="line"> | [Chart Toolbar: Chart templates](https://docs.agenatrader.com/main/chart-area/untitled/chart-templates)                       |
| <img src="/files/X8JVaOFcJt4fEoa9nhhi" alt="" data-size="line"> | [Chart Toolbar: Chart Group](https://docs.agenatrader.com/main/chart-area/untitled/chart-group)                               |

In order to activate the options **Edit indicator's parameters**, **Edit indicator** and **Remove indicator** left click on the indicator name displayed on the chart and then right click in the charting area to bring up the context menu.

<figure><img src="https://docs.agenatrader.com/~gitbook/image?url=https%3A%2F%2F2805764894-files.gitbook.io%2F%7E%2Ffiles%2Fv0%2Fb%2Fgitbook-legacy-files%2Fo%2Fassets%252F-MKZSsJBtSP9L4sqIe_q%252F-MRPk41RrDxOFd1X58ZI%252F-MRPlL3AmwQvx72YXpe6%252FchartMenuEditIndicators.png%3Falt%3Dmedia%26token%3D99323059-5064-422f-8dfa-e3a292ae63f3&#x26;width=768&#x26;dpr=4&#x26;quality=100&#x26;sign=3398be6d&#x26;sv=1" alt=""><figcaption></figcaption></figure>


# Chart Trading

## Trading from the chart <a href="#trading_from_the_chart" id="trading_from_the_chart"></a>

Chart trading with AgenaTrader is both easy and professional. It enables you to submit complete setups from the chart directly to the market with just a mouse click.

To place an order, right click within the chart. This will bring up a context menu with the following functions:

<figure><img src="https://docs.agenatrader.com/~gitbook/image?url=https%3A%2F%2F2805764894-files.gitbook.io%2F%7E%2Ffiles%2Fv0%2Fb%2Fgitbook-legacy-files%2Fo%2Fassets%252F-MKZSsJBtSP9L4sqIe_q%252F-MPn3oT4OcTPQ1g6g2-L%252F-MPn5EjPBm954C1LDgLq%252FChartMenu_trading1.png%3Falt%3Dmedia%26token%3D364be902-d2c3-4767-8e8c-bc2b1c043ce4&#x26;width=768&#x26;dpr=4&#x26;quality=100&#x26;sign=6bb3bd21&#x26;sv=1" alt=""><figcaption></figcaption></figure>

<img src="/files/Oh4yhE3LcG3HFtsm9ZiS" alt="" data-size="line"> Buy Order -

<img src="/files/3yFyUZYgT6LT7zrhlKeS" alt="" data-size="line"> Sell Order -&#x20;

<img src="/files/6HoehTgQT6ij6TJ50n3Y" alt="" data-size="line">AT++ Buy -&#x20;

&#x20;<img src="/files/PrxUkJnNrL6yRQlEzOEo" alt="" data-size="line">AT++ Sell -&#x20;

&#x20;<img src="/files/lIf9iHq8Ub8yeMuSL5vf" alt="" data-size="line">AT++ Buy Dynamic -&#x20;

<img src="/files/DUiLt4ypdm6ARRLVLzRu" alt="" data-size="line"> AT++ Sell Dynamic - &#x20;

## Order mode and order types <a href="#order-mode-and-order-types" id="order-mode-and-order-types"></a>

Orders submitted within the chart are available in the following modes:

* [Order buttons: Direct orders](https://docs.agenatrader.com/main/chart-area/order-escort#Direct_orders)
* [Order buttons: Synthetic orders](https://docs.agenatrader.com/main/chart-area/order-escort#Synthetic_orders)
* [Order buttons: Dynamic orders](https://docs.agenatrader.com/main/chart-area/order-escort#Dynamic_orders)

For more detailed information about the order, types see the section: [Order buttons: Order types](https://docs.agenatrader.com/main/chart-area/order-escort#Order_types)

Once submitted, a position will be opened and the trader bars will appear. You will be able to manage your entry order within the chart trader bars.

<figure><img src="https://docs.agenatrader.com/~gitbook/image?url=https%3A%2F%2F2805764894-files.gitbook.io%2F%7E%2Ffiles%2Fv0%2Fb%2Fgitbook-legacy-files%2Fo%2Fassets%252F-MKZSsJBtSP9L4sqIe_q%252F-MPn3oT4OcTPQ1g6g2-L%252F-MPn5I9gzMghrC4Mg5S7%252FChart%2520Trading.jpg%3Falt%3Dmedia%26token%3D5243bd3d-eb48-4afd-9090-5e77d77a47ec&#x26;width=768&#x26;dpr=4&#x26;quality=100&#x26;sign=60c819a8&#x26;sv=1" alt=""><figcaption></figcaption></figure>

## <img src="/files/PrxUkJnNrL6yRQlEzOEo" alt="" data-size="line"><img src="/files/6HoehTgQT6ij6TJ50n3Y" alt="" data-size="line"> **AgenaTrader++ Buy/Sell** &#x20;

<figure><img src="https://docs.agenatrader.com/~gitbook/image?url=https%3A%2F%2F2805764894-files.gitbook.io%2F%7E%2Ffiles%2Fv0%2Fb%2Fgitbook-legacy-files%2Fo%2Fassets%252F-MKZSsJBtSP9L4sqIe_q%252F-MPn3oT4OcTPQ1g6g2-L%252F-MPn5TawJELO96BzOZ2u%252FchartMenuTrading.png%3Falt%3Dmedia%26token%3Dfbcfe606-24b7-4a82-b7a0-d18ec33cc1f1&#x26;width=768&#x26;dpr=4&#x26;quality=100&#x26;sign=15c2d88e&#x26;sv=1" alt=""><figcaption></figcaption></figure>

Even if the AT++ plusplus setup is not activated within the chart, you still can enter an order and accomplish the risk, money, and trade managed strategies. For this purpose AgenaTrader has an ergonomic function that activates the AgenaTrader++ components **AT++ Buy** or **AT++ Sell** as soon as an entry order is submitted from the context menu. You may also start AgenaTrader++ by left clicking on the icon within the chart toolbar.

<figure><img src="https://docs.agenatrader.com/~gitbook/image?url=https%3A%2F%2F2805764894-files.gitbook.io%2F%7E%2Ffiles%2Fv0%2Fb%2Fgitbook-legacy-files%2Fo%2Fassets%252F-MKZSsJBtSP9L4sqIe_q%252F-MPn3oT4OcTPQ1g6g2-L%252F-MPn5pimnZgbnoEjN2cq%252FchartTradingAT%252B%252B.png%3Falt%3Dmedia%26token%3D81b99561-b5a1-4f29-9561-a2de07a0a60b&#x26;width=768&#x26;dpr=4&#x26;quality=100&#x26;sign=a285033e&#x26;sv=1" alt=""><figcaption></figcaption></figure>

The image below shows how a strategy can be changed and applied to the trade:

<figure><img src="https://docs.agenatrader.com/~gitbook/image?url=https%3A%2F%2F2805764894-files.gitbook.io%2F%7E%2Ffiles%2Fv0%2Fb%2Fgitbook-legacy-files%2Fo%2Fassets%252F-MKZSsJBtSP9L4sqIe_q%252F-MPn3oT4OcTPQ1g6g2-L%252F-MPn5ujPxW4BgCGwDucN%252FchartTradingAT%252B%252BAuto.png%3Falt%3Dmedia%26token%3Dcfddab5c-5668-4be7-ab75-2ee6c1de959c&#x26;width=768&#x26;dpr=4&#x26;quality=100&#x26;sign=bad7176&#x26;sv=1" alt=""><figcaption></figcaption></figure>

### **AgenaTrader++ setup with multiple entries**

AgenaTrader++ allows you to create a setup with multiple entries. Stops and targets will automatically be adjusted when additional limit and/or stop orders are included.

**Example 1.** Buy limit entries

<figure><img src="https://docs.agenatrader.com/~gitbook/image?url=https%3A%2F%2F2805764894-files.gitbook.io%2F%7E%2Ffiles%2Fv0%2Fb%2Fgitbook-legacy-files%2Fo%2Fassets%252F-MKZSsJBtSP9L4sqIe_q%252F-MPn3oT4OcTPQ1g6g2-L%252F-MPn61YEdqpTKtFlVBQR%252FchartTradingMultipleSetups.png%3Falt%3Dmedia%26token%3Decfbfc19-af6e-4ad5-8e81-8775226cf968&#x26;width=768&#x26;dpr=4&#x26;quality=100&#x26;sign=460b163c&#x26;sv=1" alt=""><figcaption></figcaption></figure>

**Example 2.** Sell stop entries

<figure><img src="https://docs.agenatrader.com/~gitbook/image?url=https%3A%2F%2F2805764894-files.gitbook.io%2F%7E%2Ffiles%2Fv0%2Fb%2Fgitbook-legacy-files%2Fo%2Fassets%252F-MKZSsJBtSP9L4sqIe_q%252F-MPn3oT4OcTPQ1g6g2-L%252F-MPnCzaiY06ozf05y2E-%252FchartTradingmultipleSetupstop.png%3Falt%3Dmedia%26token%3D7314ee5f-daa2-4410-99cb-83bea4ee7355&#x26;width=768&#x26;dpr=4&#x26;quality=100&#x26;sign=1023cb4f&#x26;sv=1" alt=""><figcaption></figcaption></figure>

## <img src="/files/QPmmJdexdA7kwue8uo7s" alt="" data-size="line"> The One Click Trading Pad <a href="#trading_from_the_chart-1" id="trading_from_the_chart-1"></a>

The "One Click Trading Pad" in AgenaTrader is a small window or tool that allows you to execute positions with just one click, instead of going through multiple steps.

It enables you to set predefined trading parameters, such as trade size and order type (e.g., buy or sell). Once these parameters are set, you can click the button to execute the transaction immediately, without additional confirmations or inputs.

This feature is particularly useful for day traders and other active traders who need to make quick trading decisions and don't want to spend time on manual input and confirmation processes. It can also help reduce human errors since all relevant information can be set in advance, and execution is done with a single click.

<figure><img src="/files/hKAcHFFYXxX43arbwOtI" alt=""><figcaption></figcaption></figure>

## Chart traders bars <a href="#chart_traders_bars" id="chart_traders_bars"></a>

You can define the appearance of chart trader bars in the [**General -> Chart**](https://docs.agenatrader.com/tools/configuration-escort#chart) tabs within the **Global Configuration**. If the option **Use ChartTraderBar-Boxes** is not enabled, the chart trader bars will be shown as lines on the chart.

The chart trader bar consists of the following components (left to right):

<figure><img src="https://docs.agenatrader.com/~gitbook/image?url=https%3A%2F%2F2805764894-files.gitbook.io%2F%7E%2Ffiles%2Fv0%2Fb%2Fgitbook-legacy-files%2Fo%2Fassets%252F-MKZSsJBtSP9L4sqIe_q%252F-MRLA_udm1pePaElq4RM%252F-MRLCKsPIKhuTAI7HAcT%252FChartMenu_tradingBars1.png%3Falt%3Dmedia%26token%3Dd916f922-6383-4597-a846-041de553cb23&#x26;width=768&#x26;dpr=4&#x26;quality=100&#x26;sign=66cbc877&#x26;sv=1" alt=""><figcaption></figcaption></figure>

| Component name     | Function                                                                                                      |
| ------------------ | ------------------------------------------------------------------------------------------------------------- |
| Cancel box         | Allows you to delete or edit an order                                                                         |
| Order mode         | Allows you to change the order mode                                                                           |
| Order type         | allows you to change the [Order types](https://docs.agenatrader.com/main/chart-area/order-escort#Order_types) |
| Strategy selection | Includes available strategies (only if AgenaTrader++ plusplus is started)                                     |
| Order size         | Allows you to input the volume of the order (order size)                                                      |
| Confirmation box   | Confirms the proposed order i.e. applies the changes                                                          |

The chart trader bar can have the following states:

* **Suggestion**: the order is simply a suggestion and can be freely modified:
  * Move it with a mouse click, changing the price;
  * Edit the order size, order type and other parameters;
  * Enter/change the order strategy (only available if AgenaTrader++ is started).

<figure><img src="https://docs.agenatrader.com/~gitbook/image?url=https%3A%2F%2F2805764894-files.gitbook.io%2F%7E%2Ffiles%2Fv0%2Fb%2Fgitbook-legacy-files%2Fo%2Fassets%252F-MKZSsJBtSP9L4sqIe_q%252F-MRLA_udm1pePaElq4RM%252F-MRLCthBxSQH-X_uIkSy%252FChartMenu_tradingBars2.png%3Falt%3Dmedia%26token%3D41ad3b6d-eebf-45f8-8e38-5762946edd07&#x26;width=768&#x26;dpr=4&#x26;quality=100&#x26;sign=abc4c6c8&#x26;sv=1" alt=""><figcaption></figcaption></figure>

* **Confirmed**:
  * You can only move a confirmed order bar with the mouse if the option **Move Confirmed Order Bars** is enabled within the [Global Configuration -> General -> Chart](https://docs.agenatrader.com/tools/configuration-escort#chart) menu;
  * If this option is not enabled, AgenaTrader will protect you from accidentally switching the order;
  * The color representation of the chart trader bar shows whether it is a buy order (green) or a sell order (red).

<figure><img src="https://docs.agenatrader.com/~gitbook/image?url=https%3A%2F%2F2805764894-files.gitbook.io%2F%7E%2Ffiles%2Fv0%2Fb%2Fgitbook-legacy-files%2Fo%2Fassets%252F-MKZSsJBtSP9L4sqIe_q%252F-MRLA_udm1pePaElq4RM%252F-MRLDdEwaIjLXA23Gdko%252FChartMenu_tradingBars3.png%3Falt%3Dmedia%26token%3Dbc567d91-b47a-440c-91d0-3acbcddcc673&#x26;width=768&#x26;dpr=4&#x26;quality=100&#x26;sign=39c654d&#x26;sv=1" alt=""><figcaption></figcaption></figure>

* **Confirmed suggestion order**:
  * Left click on the cancel box in order to edit the confirmed orders;
  * The color will turn a lighter shade of red/green;
  * Change the order size and order strategy (only available if AgenaTrader++ is started). Please note that the order type and order mode cannot be edited;
  * Clicking on the confirmation box will apply the changes to the current order.

<figure><img src="https://docs.agenatrader.com/~gitbook/image?url=https%3A%2F%2F2805764894-files.gitbook.io%2F%7E%2Ffiles%2Fv0%2Fb%2Fgitbook-legacy-files%2Fo%2Fassets%252F-MKZSsJBtSP9L4sqIe_q%252F-MRLA_udm1pePaElq4RM%252F-MRLDj7YDAMdha0hzy2O%252FChartMenu_tradingBars4.png%3Falt%3Dmedia%26token%3D287fa20e-63f1-42f2-aaff-4f43ee9a51fa&#x26;width=768&#x26;dpr=4&#x26;quality=100&#x26;sign=13f6c9e7&#x26;sv=1" alt=""><figcaption></figcaption></figure>

**Displaying risk/profit of the stop and target orders in the AgenaTrader++ setup** If AgenaTrader++ plusplus is activated, you will see potential profits or losses that may occur once an order is executed. These values are displayed next to the chart trader bars for the corresponding stop and target orders. Although estimations are quite accurate, minor differences may still arise due to slippage.

*Left click on the position bar to choose between the following display modes:*

* Amount: Absolute amount in P\&L currency
* %: percentage of the account size
* Risk: Risk multiples
* Ticks

<figure><img src="https://docs.agenatrader.com/~gitbook/image?url=https%3A%2F%2F2805764894-files.gitbook.io%2F%7E%2Ffiles%2Fv0%2Fb%2Fgitbook-legacy-files%2Fo%2Fassets%252F-MKZSsJBtSP9L4sqIe_q%252F-MRLA_udm1pePaElq4RM%252F-MRLDnCnpw76JV7_2kKK%252FchartTradingProfitLoss.png%3Falt%3Dmedia%26token%3D1a43bd78-47be-45e6-a7af-8d2661e91b6a&#x26;width=768&#x26;dpr=4&#x26;quality=100&#x26;sign=d7e7dc94&#x26;sv=1" alt=""><figcaption></figcaption></figure>

### Limit entry for StopLimit orders <a href="#limit_entry_for_stoplimit_orders" id="limit_entry_for_stoplimit_orders"></a>

If you place a StopLimit order, the chart trader bar will display an additional field. Inside this field you can enter either a fixed limit price or deviation from the stop price.

**Example 1.Fixed limit price** *Question:* What happens when you move the chart trader bar? *Answer:* The limit price will not change, neither in the corresponding field of the chart trader bar, nor in the [Trading Information: Order Manager](https://docs.agenatrader.com/tools/trading-information#Trading_Information__Order_Manager).

<figure><img src="https://docs.agenatrader.com/~gitbook/image?url=https%3A%2F%2F2805764894-files.gitbook.io%2F%7E%2Ffiles%2Fv0%2Fb%2Fgitbook-legacy-files%2Fo%2Fassets%252F-MKZSsJBtSP9L4sqIe_q%252F-MRLA_udm1pePaElq4RM%252F-MRLE0BH-oPLYPT1nwGJ%252FChart%2520trader%2520bars.jpg%3Falt%3Dmedia%26token%3Dd93662fc-b2f6-4bf8-9267-e4a43af87769&#x26;width=768&#x26;dpr=4&#x26;quality=100&#x26;sign=66e7d5f1&#x26;sv=1" alt=""><figcaption></figcaption></figure>

**Example 2.Deviation from the stop price**

The following inputs are possible: "0" - the limit price is equal to the stop price "+/-x" - the limit price is equal to the stop price +/- x (x is the minimum tick size and defines the difference between stop price and limit price).

*Question:* What happens when you move the chart trader bar? *Answer:* The value within the chart trader bar will not change. The limit price in the [Trading Information: Order Manager](https://docs.agenatrader.com/tools/trading-information#Trading_Information__Order_Manager) will be adjusted to the stop price according to the entry.

<figure><img src="https://docs.agenatrader.com/~gitbook/image?url=https%3A%2F%2F2805764894-files.gitbook.io%2F%7E%2Ffiles%2Fv0%2Fb%2Fgitbook-legacy-files%2Fo%2Fassets%252F-MKZSsJBtSP9L4sqIe_q%252F-MRLA_udm1pePaElq4RM%252F-MRLEN3DqvxdGaC7DO_G%252FChart%2520trader%2520bars%281%29.jpg%3Falt%3Dmedia%26token%3Db2dbd72e-3ec5-4b7f-91e4-437b736f82c3&#x26;width=768&#x26;dpr=4&#x26;quality=100&#x26;sign=2da2dfac&#x26;sv=1" alt=""><figcaption></figcaption></figure>

## Order groups <a href="#order-groups" id="order-groups"></a>

You can create complex order groups within AgenaTrader.

Order connections are mechanisms that link your entry orders with target(s) and stop(s), allowing for automated order management. There are three main types of order connections:

* OCO (One cancels Other): once any order of a group is executed, the other orders belonging to this group will be deleted.
* IfDone: once any order of a group is executed, other orders belonging to this group will be submitted.
* ORO (One reduces Other): once any order of a group is executed, the size of the second order in this group will be reduced by the order volume of the first order.

The before-mentioned methods of linking the orders to each other are especially practical for users who only have the basic version of AgenaTrader. More advanced versions of AgenaTrader perform this complex function automatically by means of the **Setup Builder**. However, there are no limits on traders using order grouping in their own strategies (especially OCO orders for breakouts).

### OCO orders <a href="#oco-orders" id="oco-orders"></a>

To create an OCO group:

1. Submit two orders to the market,
2. then pressing and holding the **CTRL button**, click on the first order and then the second order.

You can link confirmed as well as unconfirmed orders to each other. The OCO connection line will be displayed in red.

The image below depicts two confirmed orders connected as an OCO group. The upper trade is a stop buy order and the lower is a stop sell order. The idea is that you will trade in the direction in which the price moves first (e.g. breakouts). If one order is executed, the other order will be deleted automatically.

<figure><img src="https://docs.agenatrader.com/~gitbook/image?url=https%3A%2F%2F2805764894-files.gitbook.io%2F%7E%2Ffiles%2Fv0%2Fb%2Fgitbook-legacy-files%2Fo%2Fassets%252F-MKZSsJBtSP9L4sqIe_q%252F-MRLA_udm1pePaElq4RM%252F-MRLEp5m1OeK6WPoQRXG%252FchartTradingOCO.png%3Falt%3Dmedia%26token%3D70275c5d-2f5d-46e0-ae32-f1b8ecabcb49&#x26;width=768&#x26;dpr=4&#x26;quality=100&#x26;sign=38359853&#x26;sv=1" alt=""><figcaption></figcaption></figure>

Two successive numbers in the OCO column of the **Order Manager** show the connection between orders.

<figure><img src="https://docs.agenatrader.com/~gitbook/image?url=https%3A%2F%2F2805764894-files.gitbook.io%2F%7E%2Ffiles%2Fv0%2Fb%2Fgitbook-legacy-files%2Fo%2Fassets%252F-MKZSsJBtSP9L4sqIe_q%252F-MRLA_udm1pePaElq4RM%252F-MRLEypgm2R-m6CRGAp4%252ForderManagerOCO.png%3Falt%3Dmedia%26token%3D273fe734-ed94-48c0-af45-87fc979efe05&#x26;width=768&#x26;dpr=4&#x26;quality=100&#x26;sign=9722513f&#x26;sv=1" alt=""><figcaption></figcaption></figure>

### IfDone orders <a href="#ifdone-orders" id="ifdone-orders"></a>

To create an IfDone group:

1. Submit two orders to the market,
2. then pressing and holding the **ALT button**, click on the first order and then the second order.

You can link confirmed as well as unconfirmed orders to each other. The IfDone connection line will be displayed in green.

The image below depicts two confirmed orders connected as an IfDone group. The trade in the middle is a confirmed stop sell order (entry order) and the other two are unconfirmed stop and target orders. If the entry order is executed, the stop and target orders will be activated automatically. In this example the stop and target orders are also linked to each other via OCO-connection.

<figure><img src="https://docs.agenatrader.com/~gitbook/image?url=https%3A%2F%2F2805764894-files.gitbook.io%2F%7E%2Ffiles%2Fv0%2Fb%2Fgitbook-legacy-files%2Fo%2Fassets%252F-MKZSsJBtSP9L4sqIe_q%252F-MRLA_udm1pePaElq4RM%252F-MRLFDTHTsRG156HISsQ%252FchartTradingIfDone.png%3Falt%3Dmedia%26token%3Df590df00-280c-4d2d-8a06-28b68df86162&#x26;width=768&#x26;dpr=4&#x26;quality=100&#x26;sign=5e7566a9&#x26;sv=1" alt=""><figcaption></figcaption></figure>

Three successive numbers in the IfDone column of the **Order Manager** show the connection between orders.

<figure><img src="https://docs.agenatrader.com/~gitbook/image?url=https%3A%2F%2F2805764894-files.gitbook.io%2F%7E%2Ffiles%2Fv0%2Fb%2Fgitbook-legacy-files%2Fo%2Fassets%252F-MKZSsJBtSP9L4sqIe_q%252F-MRLA_udm1pePaElq4RM%252F-MRLFJDJyvMNIs2tm4SB%252ForderManagerIfDone.png%3Falt%3Dmedia%26token%3D78a2a47b-4a15-49ab-938c-1ec1ecd566f5&#x26;width=768&#x26;dpr=4&#x26;quality=100&#x26;sign=82540aa6&#x26;sv=1" alt=""><figcaption></figcaption></figure>

### ORO orders <a href="#oro-orders" id="oro-orders"></a>

To create an ORO group:

1. Submit an order to the market,
2. then pressing and holding the **CTRL and Alt buttons**, click on the first order and then the second order.

The idea behind an ORO is to connect a stop order with a target order in case you have multiple targets being executed separately. The ORO connection line will be displayed in blue.

The image below depicts a stop-buy setup with one stop and two targets. There are four orders with three IfDone connections (once the entry order is executed, the stop and the targets will be submitted to the market). The stop order and the first target order create an ORO group. This means that the stop order will be reduced by the order volume of the partial execution (first target). If the ORO connection is not created, the stop order will move in the opposite direction after the execution of the first target, since the stop order size is not reduced. Additionally, the stop order is connected to the second target order via OCO, which implies that the execution of one of the two orders will exit the trade.

You also have the possibility of submitting the second target order to the market only after the first target order has been executed, using an If-Done connection. This connection between targets makes sense if you prefer not to reveal the real order volume for as long as possible.

What happens if only the stop (and not the first target) is reached? In this case, the ORO connection will cause the first target order to be deleted, since the order size will be reduced and will become negative (- 5000). The second target order will be deleted due to the OCO-connection.

<figure><img src="https://docs.agenatrader.com/~gitbook/image?url=https%3A%2F%2F2805764894-files.gitbook.io%2F%7E%2Ffiles%2Fv0%2Fb%2Fgitbook-legacy-files%2Fo%2Fassets%252F-MKZSsJBtSP9L4sqIe_q%252F-MRLA_udm1pePaElq4RM%252F-MRLFOb8c2q1ibJxVd99%252FchartTradingORO.png%3Falt%3Dmedia%26token%3D51aa2bde-5af6-4732-b6c7-d6680d0bdfc1&#x26;width=768&#x26;dpr=4&#x26;quality=100&#x26;sign=d38cae75&#x26;sv=1" alt=""><figcaption></figcaption></figure>

Two successive numbers in the ORO column within the **Order Manager** show the connection between orders.

<figure><img src="https://docs.agenatrader.com/~gitbook/image?url=https%3A%2F%2F2805764894-files.gitbook.io%2F%7E%2Ffiles%2Fv0%2Fb%2Fgitbook-legacy-files%2Fo%2Fassets%252F-MKZSsJBtSP9L4sqIe_q%252F-MRLA_udm1pePaElq4RM%252F-MRLFUc4F2iRVANynaTo%252ForderManagerORO.png%3Falt%3Dmedia%26token%3D309051b9-73c9-4580-bd86-03fca292aebe&#x26;width=768&#x26;dpr=4&#x26;quality=100&#x26;sign=9d2e4ca3&#x26;sv=1" alt=""><figcaption></figcaption></figure>

### Grouping two entry orders for different instruments with OCO-connection <a href="#grouping-two-entry-orders-for-different-instruments-with-oco-connection" id="grouping-two-entry-orders-for-different-instruments-with-oco-connection"></a>

If you have similar setups for two different instruments but only wish to submit one trade, you can create an OCO group for these orders. If the entry order for one instrument is submitted earlier than the other entry order, the latter is automatically deleted. Nevertheless, unconfirmed stop and target orders must be deleted manually (although these have no impact on trades). If AgenaTrader++ is running, these stop and target orders will be deleted automatically.

The entry orders cannot be connected on the chart itself, therefore you must create an OCO group within the OrderManager in the following way:

1. Mark both entry orders,
2. Right click in the **Order Manager tab** to open the context menu,
3. Select the **Create OCO Group** menu option.

<figure><img src="https://docs.agenatrader.com/~gitbook/image?url=https%3A%2F%2F2805764894-files.gitbook.io%2F%7E%2Ffiles%2Fv0%2Fb%2Fgitbook-legacy-files%2Fo%2Fassets%252F-MKZSsJBtSP9L4sqIe_q%252F-MRLA_udm1pePaElq4RM%252F-MRLFaEvidzoeiy1TS9P%252FchartTradingOCOtwoInstruments.png%3Falt%3Dmedia%26token%3Df9d459aa-6328-45cb-89d7-edec6b692dea&#x26;width=768&#x26;dpr=4&#x26;quality=100&#x26;sign=500dd0d8&#x26;sv=1" alt=""><figcaption></figcaption></figure>

## Position display <a href="#position-display" id="position-display"></a>

Positions and orders are displayed in a visual manner with the cancel box, unrealized profit/loss, strategy and position size on the chart.

<figure><img src="https://docs.agenatrader.com/~gitbook/image?url=https%3A%2F%2F2805764894-files.gitbook.io%2F%7E%2Ffiles%2Fv0%2Fb%2Fgitbook-legacy-files%2Fo%2Fassets%252F-MKZSsJBtSP9L4sqIe_q%252F-MRLA_udm1pePaElq4RM%252F-MRLFj99iEQe-KNJqyaY%252FtraderBalken_new.png%3Falt%3Dmedia%26token%3D0ec142b9-9868-414e-9b7b-359de659138c&#x26;width=768&#x26;dpr=4&#x26;quality=100&#x26;sign=1becdfe8&#x26;sv=1" alt=""><figcaption></figcaption></figure>

| Name                          | Description                                                                                                                                                                                                                                                                                                                                                                                                                                                                                                                                                                                                                                                                                                                                                                                                                                                                                                                                                                                                                                                                                                                                                                                                                                                                                                                                                                                                                                                                                                                                                                                                                                                                                                        | Icon                                                                                                                                                                                                                                                                                                                                                                                                               |
| ----------------------------- | ------------------------------------------------------------------------------------------------------------------------------------------------------------------------------------------------------------------------------------------------------------------------------------------------------------------------------------------------------------------------------------------------------------------------------------------------------------------------------------------------------------------------------------------------------------------------------------------------------------------------------------------------------------------------------------------------------------------------------------------------------------------------------------------------------------------------------------------------------------------------------------------------------------------------------------------------------------------------------------------------------------------------------------------------------------------------------------------------------------------------------------------------------------------------------------------------------------------------------------------------------------------------------------------------------------------------------------------------------------------------------------------------------------------------------------------------------------------------------------------------------------------------------------------------------------------------------------------------------------------------------------------------------------------------------------------------------------------ | ------------------------------------------------------------------------------------------------------------------------------------------------------------------------------------------------------------------------------------------------------------------------------------------------------------------------------------------------------------------------------------------------------------------ |
| Cancel box                    | Closes the position immediately                                                                                                                                                                                                                                                                                                                                                                                                                                                                                                                                                                                                                                                                                                                                                                                                                                                                                                                                                                                                                                                                                                                                                                                                                                                                                                                                                                                                                                                                                                                                                                                                                                                                                    | ![Pos1](https://docs.agenatrader.com/~gitbook/image?url=https%3A%2F%2F2805764894-files.gitbook.io%2F%7E%2Ffiles%2Fv0%2Fb%2Fgitbook-legacy-files%2Fo%2Fassets%252F-MKZSsJBtSP9L4sqIe_q%252F-MRLA_udm1pePaElq4RM%252F-MRLFsZPe8iiYuNfEsTC%252Fpos1.png%3Falt%3Dmedia%26token%3Db662c127-71b2-4c9e-8606-d8380fdb9bab\&width=300\&dpr=4\&quality=100\&sign=fb554b89\&sv=1)                                             |
| Profit/loss                   | shows the current profit or loss of the position (estimated but not yet realized). If you left click in this field, you will see the following display options in the drop-down list: [![Dot](https://docs.agenatrader.com/~gitbook/image?url=https%3A%2F%2Fagenatrader.com%2Fwiki%2Ftiki-download_file.php%3FfileId%3D22%26display\&width=300\&dpr=4\&quality=100\&sign=5ef5815b\&sv=1) ](https://agenatrader.com/wiki/tiki-download_file.php?fileId=22\&display)Amount; [![Dot](https://docs.agenatrader.com/~gitbook/image?url=https%3A%2F%2Fagenatrader.com%2Fwiki%2Ftiki-download_file.php%3FfileId%3D22%26display\&width=300\&dpr=4\&quality=100\&sign=5ef5815b\&sv=1) ](https://agenatrader.com/wiki/tiki-download_file.php?fileId=22\&display)Percent; [![Dot](https://docs.agenatrader.com/~gitbook/image?url=https%3A%2F%2Fagenatrader.com%2Fwiki%2Ftiki-download_file.php%3FfileId%3D22%26display\&width=300\&dpr=4\&quality=100\&sign=5ef5815b\&sv=1) ](https://agenatrader.com/wiki/tiki-download_file.php?fileId=22\&display)Risks (AgenaTrader++); [![Dot](https://docs.agenatrader.com/~gitbook/image?url=https%3A%2F%2Fagenatrader.com%2Fwiki%2Ftiki-download_file.php%3FfileId%3D22%26display\&width=300\&dpr=4\&quality=100\&sign=5ef5815b\&sv=1) ](https://agenatrader.com/wiki/tiki-download_file.php?fileId=22\&display)Ticks Important: Outside market trading hours the ask/bid prices can differ from regular ask/bid prices. This influences the display of the current open P/L. Usually when the markets are open this resolves itself automatically. We do not want to ignore this ask/bid prices since it is possible that the market opens with a gap and this P/L become realized. | ![TraderBalken GV](https://docs.agenatrader.com/~gitbook/image?url=https%3A%2F%2F2805764894-files.gitbook.io%2F%7E%2Ffiles%2Fv0%2Fb%2Fgitbook-legacy-files%2Fo%2Fassets%252F-MKZSsJBtSP9L4sqIe_q%252F-MRLA_udm1pePaElq4RM%252F-MRLG3nBNLTjB23m_zpa%252FtraderBalken_GV.png%3Falt%3Dmedia%26token%3D6c760d3c-a4da-40ed-8813-9adedb2e7286\&width=300\&dpr=4\&quality=100\&sign=c35f86e5\&sv=1)                       |
| Strategy                      | Contains the name of the selected trading strategy                                                                                                                                                                                                                                                                                                                                                                                                                                                                                                                                                                                                                                                                                                                                                                                                                                                                                                                                                                                                                                                                                                                                                                                                                                                                                                                                                                                                                                                                                                                                                                                                                                                                 | ![Jojo](https://docs.agenatrader.com/~gitbook/image?url=https%3A%2F%2F2805764894-files.gitbook.io%2F%7E%2Ffiles%2Fv0%2Fb%2Fgitbook-legacy-files%2Fo%2Fassets%252F-MKZSsJBtSP9L4sqIe_q%252F-MRLA_udm1pePaElq4RM%252F-MRLG73IucneoH9-GEhH%252FJojo.png%3Falt%3Dmedia%26token%3Ddfb4e4c5-1891-42be-9be4-2a9c4511de44\&width=300\&dpr=4\&quality=100\&sign=107047d2\&sv=1)                                             |
| Position size                 | Shows the volume of the position and the number of underlying buy (or sell) orders. The position size can be changed any time.                                                                                                                                                                                                                                                                                                                                                                                                                                                                                                                                                                                                                                                                                                                                                                                                                                                                                                                                                                                                                                                                                                                                                                                                                                                                                                                                                                                                                                                                                                                                                                                     | ![TraderBalken Contracts](https://docs.agenatrader.com/~gitbook/image?url=https%3A%2F%2F2805764894-files.gitbook.io%2F%7E%2Ffiles%2Fv0%2Fb%2Fgitbook-legacy-files%2Fo%2Fassets%252F-MKZSsJBtSP9L4sqIe_q%252F-MRLA_udm1pePaElq4RM%252F-MRLGBMLD5iaXf4SrA57%252FtraderBalken_contracts.png%3Falt%3Dmedia%26token%3D3adb24f7-666a-424d-afdb-0a2b175adf7e\&width=300\&dpr=4\&quality=100\&sign=c3b261c6\&sv=1)         |
| Edit Trade (Trade Expires at) | As far as an order is executed you can change the expiration date of the trade: ![EditTrade](https://docs.agenatrader.com/~gitbook/image?url=https%3A%2F%2F2805764894-files.gitbook.io%2F%7E%2Ffiles%2Fv0%2Fb%2Fgitbook-legacy-files%2Fo%2Fassets%252F-MKZSsJBtSP9L4sqIe_q%252F-MRLA_udm1pePaElq4RM%252F-MRLGLn3OiWbaXSQ0QDL%252FEditTrade.png%3Falt%3Dmedia%26token%3D9f31a135-c186-40cf-afb2-639c24017d38\&width=300\&dpr=4\&quality=100\&sign=627d9520\&sv=1)                                                                                                                                                                                                                                                                                                                                                                                                                                                                                                                                                                                                                                                                                                                                                                                                                                                                                                                                                                                                                                                                                                                                                                                                                                                   | ![OrderBalken EditTrade Icon](https://docs.agenatrader.com/~gitbook/image?url=https%3A%2F%2F2805764894-files.gitbook.io%2F%7E%2Ffiles%2Fv0%2Fb%2Fgitbook-legacy-files%2Fo%2Fassets%252F-MKZSsJBtSP9L4sqIe_q%252F-MRLA_udm1pePaElq4RM%252F-MRLGGeBT80djIzxrT_k%252ForderBalken_editTrade_icon.png%3Falt%3Dmedia%26token%3Dcd35aef6-6fd6-4b17-ad39-7d7b02d957c0\&width=300\&dpr=4\&quality=100\&sign=7b17f4a8\&sv=1) |

Should an order neither be touched nor activated then it can be edited and replaced:

<figure><img src="https://docs.agenatrader.com/~gitbook/image?url=https%3A%2F%2F2805764894-files.gitbook.io%2F%7E%2Ffiles%2Fv0%2Fb%2Fgitbook-legacy-files%2Fo%2Fassets%252F-MKZSsJBtSP9L4sqIe_q%252F-MRLA_udm1pePaElq4RM%252F-MRLGTeJue6EeIleYoaW%252FReplaceOrder.png%3Falt%3Dmedia%26token%3Ddc481a0b-c0e7-4980-8003-689a3a61672e&#x26;width=768&#x26;dpr=4&#x26;quality=100&#x26;sign=fbbcf799&#x26;sv=1" alt=""><figcaption></figcaption></figure>

| Function              | Description                                                                                                |
| --------------------- | ---------------------------------------------------------------------------------------------------------- |
| Order General Options | The order size can be changed as well as the option "Out RTH" (out regular trading hours) can be selected. |
| Order Expiry          | Allows to select between the options: Good till Cancel (GTC), Good till Date (Gtd) and Day.                |
| Order type options    | Allows to select order types and change a Stop or Limit price.                                             |
| Name                  | Allows to select from the drop-down list available strategies in **Setup Builder**.                        |

If the order has been activated some functions will not be available anymore:

<figure><img src="https://docs.agenatrader.com/~gitbook/image?url=https%3A%2F%2F2805764894-files.gitbook.io%2F%7E%2Ffiles%2Fv0%2Fb%2Fgitbook-legacy-files%2Fo%2Fassets%252F-MKZSsJBtSP9L4sqIe_q%252F-MRLA_udm1pePaElq4RM%252F-MRLGaUgvYKMIKZnI9aj%252FReplaceOrder1.png%3Falt%3Dmedia%26token%3D05d457b4-f96f-44f6-a610-8a7c6df77afb&#x26;width=768&#x26;dpr=4&#x26;quality=100&#x26;sign=e03e9055&#x26;sv=1" alt=""><figcaption></figcaption></figure>

The position price is not adjustable due to the fact that it is based on the average price of the underlying buy (or sell) orders. This means that it cannot be affected by adding new sell (or buy) orders.

## Orders templates

**Orders templates are ONLY suitable for trading in standard mode (without AgenaTrader++).**

You can manually [place orders on the chart and link them to each other](https://docs.agenatrader.com/main/chart-area/untitled/chart-context-menu#Order_groups) and then apply the saved manual (discretionary) setup to other trades.

The easiest way to demonstrate how this works is with the help of several examples.

#### Example 1. SimpleLong <a href="#example_1-._simplelong" id="example_1-._simplelong"></a>

To create an orders template, complete the following steps:

1\. Manually place 3 orders on the chart:

* Target = Sell Limit Order
* Entry = Buy Stop Order
* Stop = Sell Stop Order

<figure><img src="https://docs.agenatrader.com/~gitbook/image?url=https%3A%2F%2F2805764894-files.gitbook.io%2F%7E%2Ffiles%2Fv0%2Fb%2Fgitbook-legacy-files%2Fo%2Fassets%252F-MKZSsJBtSP9L4sqIe_q%252F-MPnJBQf73uIOGhK2XwX%252F-MPnSp8awVBkpfcwgMDG%252ForderTemplatesExample.png%3Falt%3Dmedia%26token%3D22a722ef-7f5d-461c-925f-ef65971c05c9&#x26;width=768&#x26;dpr=4&#x26;quality=100&#x26;sign=b4a2bef3&#x26;sv=1" alt=""><figcaption></figcaption></figure>

2\. Create an IfDone group consisting of the EntryOrder linked to the TargetOrder and StopOrder (Alt + left click)

<figure><img src="https://docs.agenatrader.com/~gitbook/image?url=https%3A%2F%2F2805764894-files.gitbook.io%2F%7E%2Ffiles%2Fv0%2Fb%2Fgitbook-legacy-files%2Fo%2Fassets%252F-MKZSsJBtSP9L4sqIe_q%252F-MPnJBQf73uIOGhK2XwX%252F-MPnSt7P1IS-IxO33AXV%252ForderTemplateIfDone.png%3Falt%3Dmedia%26token%3D167fa6b5-da0b-46d5-bb2f-d8dc292943e9&#x26;width=768&#x26;dpr=4&#x26;quality=100&#x26;sign=e2dd1a39&#x26;sv=1" alt=""><figcaption></figcaption></figure>

3\. Create an OCO group consisting of the TargetOrder and StopOrder (CTRL + left click)

<figure><img src="https://docs.agenatrader.com/~gitbook/image?url=https%3A%2F%2F2805764894-files.gitbook.io%2F%7E%2Ffiles%2Fv0%2Fb%2Fgitbook-legacy-files%2Fo%2Fassets%252F-MKZSsJBtSP9L4sqIe_q%252F-MPnJBQf73uIOGhK2XwX%252F-MPnSwEXwtEPRiplzqPt%252ForderTemplateOco.png%3Falt%3Dmedia%26token%3D7f3cb57e-723c-4074-9d71-0b2e714b75d5&#x26;width=768&#x26;dpr=4&#x26;quality=100&#x26;sign=e9cd3f48&#x26;sv=1" alt=""><figcaption></figcaption></figure>

4\. Save the orders template in order to use it again for other trades by doing the following:

* Right click in the charting area to bring up the context menu;
* Select **Settings** and then **Orders Templates**;
* Left click on the **Create Template from Chart** option.

<figure><img src="https://docs.agenatrader.com/~gitbook/image?url=https%3A%2F%2F2805764894-files.gitbook.io%2F%7E%2Ffiles%2Fv0%2Fb%2Fgitbook-legacy-files%2Fo%2Fassets%252F-MKZSsJBtSP9L4sqIe_q%252F-MPnJBQf73uIOGhK2XwX%252F-MPnT-EY_Hvy1gCHvALc%252ForderTemplateCreate.png%3Falt%3Dmedia%26token%3Dc001f897-3002-405f-bba5-0ccf8699b7fa&#x26;width=768&#x26;dpr=4&#x26;quality=100&#x26;sign=341bbdf7&#x26;sv=1" alt=""><figcaption></figcaption></figure>

{% hint style="info" %}
**Note!** The orders template will only be ACTIVATED if you check the ![Checkbox](https://docs.agenatrader.com/~gitbook/image?url=https%3A%2F%2F2805764894-files.gitbook.io%2F%7E%2Ffiles%2Fv0%2Fb%2Fgitbook-legacy-files%2Fo%2Fassets%252F-MKZSsJBtSP9L4sqIe_q%252F-MP9WizlMGepocaibx8N%252F-MP9h17TZa_NwAu_tTj5%252Fcheckbox.png%3Falt%3Dmedia%26token%3Db0bf3d6a-2e2b-4e80-8c33-16fa9c815637\&width=300\&dpr=4\&quality=100\&sign=806e5228\&sv=1) checkbox for the entry order!!
{% endhint %}

#### Example 2. SimpleShort <a href="#example_2-._simpleshort" id="example_2-._simpleshort"></a>

To create an orders template, complete the following steps:

1\. Manually place 3 orders on the chart:

* Target = Buy Limit Order
* Entry = Sell Stop Order
* Stop = Buy Stop Order

2\. Create an IfDone group consisting of the EntryOrder linked to the TargetOrder and StopOrder (Alt + left click)

3\. Create an OCO group consisting of the TargetOrder and StopOrder (CTRL + left click)

<figure><img src="https://docs.agenatrader.com/~gitbook/image?url=https%3A%2F%2F2805764894-files.gitbook.io%2F%7E%2Ffiles%2Fv0%2Fb%2Fgitbook-legacy-files%2Fo%2Fassets%252F-MKZSsJBtSP9L4sqIe_q%252F-MPnJBQf73uIOGhK2XwX%252F-MPnTA8_2UQUlulnZFU8%252ForderTemplateOco%2520%281%29.png%3Falt%3Dmedia%26token%3D811c16b6-abc9-43ee-8cbd-b0f2e11c136a&#x26;width=768&#x26;dpr=4&#x26;quality=100&#x26;sign=a6538e60&#x26;sv=1" alt=""><figcaption></figcaption></figure>

4\. Save the orders template in order to use it again for other trades by doing the following:

* Right click in the charting area to bring up the context menu;
* Select **Settings** and then **Orders Templates**;
* Left click on the **Create Template from Chart** option.

**Note!** The orders template will only be ACTIVATED if you check the ![Checkbox](https://docs.agenatrader.com/~gitbook/image?url=https%3A%2F%2F2805764894-files.gitbook.io%2F%7E%2Ffiles%2Fv0%2Fb%2Fgitbook-legacy-files%2Fo%2Fassets%252F-MKZSsJBtSP9L4sqIe_q%252F-MP9WizlMGepocaibx8N%252F-MP9h17TZa_NwAu_tTj5%252Fcheckbox.png%3Falt%3Dmedia%26token%3Db0bf3d6a-2e2b-4e80-8c33-16fa9c815637\&width=300\&dpr=4\&quality=100\&sign=806e5228\&sv=1) checkbox for the entry order!!

**Example 3. Channel Breakout (combines examples 1 and 2)**

To create an orders template, complete the following steps:

1\. Apply both templates (in this example SimpleLong and SimpleShort) to the chart.

2\. Create an OCO group consisting of the entry orders from both templates (CTRL + left click)

<figure><img src="https://docs.agenatrader.com/~gitbook/image?url=https%3A%2F%2F2805764894-files.gitbook.io%2F%7E%2Ffiles%2Fv0%2Fb%2Fgitbook-legacy-files%2Fo%2Fassets%252F-MKZSsJBtSP9L4sqIe_q%252F-MPnJBQf73uIOGhK2XwX%252F-MPnTVxsA7YL2sCTYbpu%252FOrderGroup.jpg%3Falt%3Dmedia%26token%3D6ea1ccc5-3539-402f-a5f5-2430939e0471&#x26;width=768&#x26;dpr=4&#x26;quality=100&#x26;sign=e6f8e701&#x26;sv=1" alt=""><figcaption></figcaption></figure>

3\. Save the orders template in order to use it again for other trades by doing the following:

* Right click in the charting area to bring up the context menu;
* Select **Settings** and then **Orders Templates**;
* Left click on the **Create Template from Chart** option.

**Note!** The orders template will only be ACTIVATED if you check the ![Checkbox](https://docs.agenatrader.com/~gitbook/image?url=https%3A%2F%2F2805764894-files.gitbook.io%2F%7E%2Ffiles%2Fv0%2Fb%2Fgitbook-legacy-files%2Fo%2Fassets%252F-MKZSsJBtSP9L4sqIe_q%252F-MP9WizlMGepocaibx8N%252F-MP9h17TZa_NwAu_tTj5%252Fcheckbox.png%3Falt%3Dmedia%26token%3Db0bf3d6a-2e2b-4e80-8c33-16fa9c815637\&width=300\&dpr=4\&quality=100\&sign=806e5228\&sv=1) checkbox for **BOTH** entry orders!!

See the [Order groups (connections](https://docs.agenatrader.com/main/chart-area/untitled/chart-context-menu#Order_groups)) section for further information.

## **Multitarget-Setups**

In Logs-tab you will receive an orange warning message. This means that the Broker-API does not support OCO with multi targets.

<figure><img src="https://docs.agenatrader.com/~gitbook/image?url=https%3A%2F%2F2805764894-files.gitbook.io%2F%7E%2Ffiles%2Fv0%2Fb%2Fgitbook-legacy-files%2Fo%2Fassets%252F-MKZSsJBtSP9L4sqIe_q%252F-MQwPCScTa47vxWsw7R-%252F-MQwRi6V_guMvnn6VYjT%252FOCOFehler.png%3Falt%3Dmedia%26token%3D1ac8d230-0535-476a-bad4-9d0e704c509b&#x26;width=768&#x26;dpr=4&#x26;quality=100&#x26;sign=7c1b2ad5&#x26;sv=1" alt=""><figcaption></figcaption></figure>

This is not really an error message but rather a warning for the user. As the broker cannot manage this order type via the API, the trade is traded by the AgenaTrader trade manager.

AgenaTrader must be running during a running strategy and also has to be connected to internet, broker and data feed in order to execute the trade properly.

Information about which order types are supported by the broker APIs you can find in the Broker Disclaimer, which appears as soon as you create or edit the account details in AgenaTrader in Tools -> Settings -> Add (or Edit) Broker Connections.

## **General**

### **Divergences in PnL calculation**

*Issue:*

1. PnL calculation differs from broker platform.
2. PnL calculation shows differencies between amount and percent.
3. PnL calculation differs from my calculation.

*This means:*

There are different ways of calculation: @ 1. and 3. There are minor differences based on different calculation of commissions, spread and execution.

@ 2. When you chose an amount, then the absolute account size comes into effect in the calculation. When you chose percent, then the absolute size of the account that was available, when you opened the trade, comes into effect in the calculation. As every trade is opened with a different account size, the calculation of percent can differ.

*Solution:*

Unfortunately there is no solution - minor divergences cannot be avoided.

**Will my AT++ or scripted trading strategy also be executed, when I am offline?**

An AT++ strategy usually consits of several trailing stops, OCO and IfDone order connections. Only in very few cases the three mentioned order types are supported by your broker´s APIs. For executing your strategy properly, AgenaTrader needs to be running and be connected to the internet, your broker and data feed.

Whern this connection is interrupted, faulty exections might happen. The same might happen with scripted strategies in case you used above mentioned order types.

**Can I purchase some trading logic for automated trading for AgenaTrader (strategies, indicators, conditions)?**

We do not offer support for creating strategies, indicators or conditions. Yet a scripted logic can be implemented in the platform - it requires skills in our scripting language[ AgenaScript.](https://agenatrader.github.io/AgenaScript-documentation/index.html)

Alternative to this you can create conditions with our SignalBuilder without any scripting knowledge and link it to an AT++ trading logic.

For very specific scriptings we are cooperating with [Quanteo](http://www.quanteo.de/index.php/entwicklung/) . Please contact Quanteo directly. In our [Forum](https://tradersyard.com/forums) there are many experienced AgenaTrader user as well, so here you also have the chance to share ideas and ask for help.

### Profit and Loss in positionbar

**Profit/loss** shows the current profit or loss of the position (estimated but not yet realized). If you left click in this field, you will see the following display options in the drop-down list Amount Percent Risks (AgenaTrader++) Ticks

<figure><img src="https://docs.agenatrader.com/~gitbook/image?url=https%3A%2F%2F2805764894-files.gitbook.io%2F%7E%2Ffiles%2Fv0%2Fb%2Fgitbook-legacy-files%2Fo%2Fassets%252F-MKZSsJBtSP9L4sqIe_q%252F-MQwPCScTa47vxWsw7R-%252F-MQwR_SCVrzgXw4HLKf9%252FOpenPL.png%3Falt%3Dmedia%26token%3Df2d1461f-581f-4382-a62c-aa930b539358&#x26;width=768&#x26;dpr=4&#x26;quality=100&#x26;sign=dd3e4721&#x26;sv=1" alt=""><figcaption></figcaption></figure>

{% hint style="info" %}
**Important:** Outside market trading hours the ask/bid prices can differ from regular ask/bid prices. This influences the display of the current open P/L. Usually when the markets are open this resolves itself automatically. We do not want to ignore this ask/bid prices since it is possible that the market opens with a gap and this P/L become realized.
{% endhint %}

### **Trading function is deactivated** <a href="#trading-function-is-deactivated" id="trading-function-is-deactivated"></a>

#### **Problem:** <a href="#problem" id="problem"></a>

Trading function in chart context menu and/or QuickSetup-buttons are deactivated:

<figure><img src="https://docs.agenatrader.com/~gitbook/image?url=https%3A%2F%2F2805764894-files.gitbook.io%2F%7E%2Ffiles%2Fv0%2Fb%2Fgitbook-legacy-files%2Fo%2Fassets%252F-MKZSsJBtSP9L4sqIe_q%252F-MQwPCScTa47vxWsw7R-%252F-MQwR3TWAaJqDrplHFAq%252FTradingFunctions.png%3Falt%3Dmedia%26token%3D957562fa-25b7-49a0-a283-a11cb706623d&#x26;width=768&#x26;dpr=4&#x26;quality=100&#x26;sign=8c56d4c2&#x26;sv=1" alt=""><figcaption></figcaption></figure>

#### **Reasons and possible solutions:** <a href="#reasons-and-possible-solutions" id="reasons-and-possible-solutions"></a>

* Account settings for multibrokerage are not correct. -> Please check, if you have activated broker as well as asset classes and exchanges you want to trade in Tools -> Settings -> Account connections. Here you can find further information on [multi-broker settings](https://docs.agenatrader.com/main/broker-and-datafeed-connections/multi-account-settings).
* You are not connected to your broker account. -> Please connect to your broker via Main -> Connections -> Connecting.
* Trading hours or trading breaks were adjusted. -> Please check in InstrumentEditor as well as in Global Configuration your settings of trading hours and trading breaks. Here you can find important information on [Market Place Escort](https://docs.agenatrader.com/tools/configuration-escort#Configuration_Escort__Market_Place_Escort).
* Over-the-counter trading hours are activated. -> Please check, whether you changed [Over-the-counter trading hours](https://docs.agenatrader.com/main/chart-area/untitled/switch-to-pre-and-post-market-data) and activated in chart via Toolbar-button <img src="/files/rTETRGcQoea33sPfccpm" alt="" data-size="line"> , and if so, deactivate it.

### **Transmission of order doesn´t work** <a href="#transmission-of-order-doesn-t-work" id="transmission-of-order-doesn-t-work"></a>

#### **Problem:** <a href="#problem-1" id="problem-1"></a>

Order is not sent to broker.

#### **Reasons and possible solutions:** <a href="#reasons-and-possible-solutions-1" id="reasons-and-possible-solutions-1"></a>

* Mappings were not (or not fully) imported or are wrong. You get this error message:

<figure><img src="https://docs.agenatrader.com/~gitbook/image?url=https%3A%2F%2F2805764894-files.gitbook.io%2F%7E%2Ffiles%2Fv0%2Fb%2Fgitbook-legacy-files%2Fo%2Fassets%252F-MKZSsJBtSP9L4sqIe_q%252F-MQwPCScTa47vxWsw7R-%252F-MQwR7ld8t2zeVPx0BsB%252FSecurityDefinition.png%3Falt%3Dmedia%26token%3Da8c126de-a51c-4f2d-b7fb-a99c4ada7e4d&#x26;width=768&#x26;dpr=4&#x26;quality=100&#x26;sign=843a39d5&#x26;sv=1" alt=""><figcaption></figcaption></figure>

-> Please re-import mappings. If mappingfor the instrument in question is still incorrect or missing, you can request correct mapping in InstrumentEditor with "Submit correct mapping"-button.

* Ticksize in instrument is not set correct. You get this error message:

<figure><img src="https://docs.agenatrader.com/~gitbook/image?url=https%3A%2F%2F2805764894-files.gitbook.io%2F%7E%2Ffiles%2Fv0%2Fb%2Fgitbook-legacy-files%2Fo%2Fassets%252F-MKZSsJBtSP9L4sqIe_q%252F-MQwPCScTa47vxWsw7R-%252F-MQwRSaFpEwD7FN1Ez__%252FTicksizeError.png%3Falt%3Dmedia%26token%3Daa462449-9657-4547-a6f4-2b86c22eb337&#x26;width=768&#x26;dpr=4&#x26;quality=100&#x26;sign=83346317&#x26;sv=1" alt=""><figcaption></figcaption></figure>

-> Please adjust ticksize according to your broker. You can find this information on broker´s website or in broker´s platform.

* Account size is too small for order size. -> Please book some money to your broker account or reduce order size.
* Margin requirements not fulfilled. -> Please book some money to your broker account or close some open positions.


# Order Management

The **Order Escort** is an order entry window that offers **far more options** than a standard order entry dialog. It serves as a **trading cockpit**, allowing you to configure all trade parameters necessary for **professional trade management**.

The **Order Escort** supports both an **automated mode** and a **manual mode**, giving traders flexibility in managing their orders efficiently.

## Standard trading pad

The standard chart trading pad provides quick access to all chart trading features, allowing you to easily adjust all settings for your orders.

*You can access the trading pad by doing one of the following:*

1. Left click on the <img src="/files/rkWb6DLU8OGccdVr0xvm" alt="" data-size="line"> icon within the chart toolbar.
2. Right click in the charting area to bring up the chart context menu, then select **Settings** followed by the **Standard Chart Trading Pad** menu item.

If [AgenaTrader++ ](/main/chart-area/chart-tools#start-agenatrader-plusplus)is running then the [Order Escort](https://docs.agenatrader.com/main/chart-area/order-escort) will be displayed.

<figure><img src="https://docs.agenatrader.com/~gitbook/image?url=https%3A%2F%2F2805764894-files.gitbook.io%2F%7E%2Ffiles%2Fv0%2Fb%2Fgitbook-legacy-files%2Fo%2Fassets%252F-MKZSsJBtSP9L4sqIe_q%252F-MPnTkthfsbB8xOD3aVI%252F-MPnXAdb2xBrHhrTaXYA%252FstandardOrderPadAT%252B%252B.png%3Falt%3Dmedia%26token%3D5e06b7a3-d12d-4b60-bad2-d32a8a52ccff&#x26;width=768&#x26;dpr=4&#x26;quality=100&#x26;sign=5685e7c&#x26;sv=1" alt=""><figcaption></figcaption></figure>

If AgenaTrader++ plusplus is not activated then the standard trading pad will be displayed.

<figure><img src="https://docs.agenatrader.com/~gitbook/image?url=https%3A%2F%2F2805764894-files.gitbook.io%2F%7E%2Ffiles%2Fv0%2Fb%2Fgitbook-legacy-files%2Fo%2Fassets%252F-MKZSsJBtSP9L4sqIe_q%252F-MPnTkthfsbB8xOD3aVI%252F-MPnXEONgw4FHBocxR0m%252FstandardTradingPad.png%3Falt%3Dmedia%26token%3Df6fb1ba6-8051-406b-b76f-00674f996daa&#x26;width=768&#x26;dpr=4&#x26;quality=100&#x26;sign=b3b6406&#x26;sv=1" alt=""><figcaption></figcaption></figure>

The standard trading pad allows you to define the following input parameters:

| Parameter         | Meaning                                                                                                          |
| ----------------- | ---------------------------------------------------------------------------------------------------------------- |
| Trade Options     | Define the symbol and the order size and receive trade confirmation (buy / sell).                                |
| Order Type        | Select the type of order to be submitted to the market.                                                          |
| Expiry            | Set the validity period for the order ('good till cancelled', 'good till date', or one day).                     |
| Financial Advisor | Use the profile key to notify the underlying trading systems about how the managed accounts should be allocated. |
| Operation         | place orders on the market with a mouse click.                                                                   |

**Execution of orders outside the regular trading hours (using the example of Interactive Brokers)**

To allow the execution of orders outside the regular trading hours check the **Out RTH** checkbox in the standard trading pad.

<figure><img src="https://docs.agenatrader.com/~gitbook/image?url=https%3A%2F%2F2805764894-files.gitbook.io%2F%7E%2Ffiles%2Fv0%2Fb%2Fgitbook-legacy-files%2Fo%2Fassets%252F-MKZSsJBtSP9L4sqIe_q%252F-MPnTkthfsbB8xOD3aVI%252F-MPnXqzje-93z2dbGDBd%252FstandardTradingPadRTH.png%3Falt%3Dmedia%26token%3D6d3d9597-b6b1-4b75-a009-20a3a957387a&#x26;width=768&#x26;dpr=4&#x26;quality=100&#x26;sign=d526fee8&#x26;sv=1" alt=""><figcaption></figcaption></figure>

## **AT++ trading Pad**

**The automatic mode will be activated when:**

* AgenaTrader++ (plusplus) is started,
* an entry signal for an instrument is recognized within the Analyzer Column (scanner) and
* the list chart group is opened and contains a chart within the same time frame in which the signal has appeared.

If the chart already contains an active manual setup, then newly occurring signals will not be placed in the chart automatically.

**The manual mode will only be activated when:**

* the checkbox **Enter manual** in the **Trade tab** of the **Order Escort** is checked.

This will allow you to input corrections to the automatic setups of AgenaTrader++ and enter your discretionary trades.

<figure><img src="https://docs.agenatrader.com/~gitbook/image?url=https%3A%2F%2F2805764894-files.gitbook.io%2F%7E%2Ffiles%2Fv0%2Fb%2Fgitbook-legacy-files%2Fo%2Fassets%252F-MKZSsJBtSP9L4sqIe_q%252F-MPsaNkq3q_vS5w7zRTc%252F-MPsfbpAbDusnLWnw2a8%252FOrder%2520Escort.PNG%3Falt%3Dmedia%26token%3Ddd0ef1a6-29aa-48a0-a16e-9454ecef1f9b&#x26;width=768&#x26;dpr=4&#x26;quality=100&#x26;sign=c4c54a89&#x26;sv=1" alt=""><figcaption></figcaption></figure>

The Order Escort window consists of four distinct tabs:

| Tab name        | Description                                                                                                                                                                                                                                                                                                                                                                                                                                                                                                                                                                                                                                                                                                                                                                                                       |
| --------------- | ----------------------------------------------------------------------------------------------------------------------------------------------------------------------------------------------------------------------------------------------------------------------------------------------------------------------------------------------------------------------------------------------------------------------------------------------------------------------------------------------------------------------------------------------------------------------------------------------------------------------------------------------------------------------------------------------------------------------------------------------------------------------------------------------------------------- |
| Trade           | Consists of two blocs: [![Dot](https://docs.agenatrader.com/~gitbook/image?url=https%3A%2F%2Fagenatrader.com%2Fwiki%2Ftiki-download_file.php%3FfileId%3D22%26display\&width=300\&dpr=4\&quality=100\&sign=5ef5815b\&sv=1) ](https://agenatrader.com/wiki/tiki-download_file.php?fileId=22\&display)Trade: displays the current trading parameters such as entry price, stops, order and position size and risk. [![Dot](https://docs.agenatrader.com/~gitbook/image?url=https%3A%2F%2Fagenatrader.com%2Fwiki%2Ftiki-download_file.php%3FfileId%3D22%26display\&width=300\&dpr=4\&quality=100\&sign=5ef5815b\&sv=1) ](https://agenatrader.com/wiki/tiki-download_file.php?fileId=22\&display)Strategy: displays the parameters for different strategies being used for currently running as well as future trades. |
| Target          | Displays the parameters for price level and target size.                                                                                                                                                                                                                                                                                                                                                                                                                                                                                                                                                                                                                                                                                                                                                          |
| Account         | Contains all important account data such as risk settings for the trading account.                                                                                                                                                                                                                                                                                                                                                                                                                                                                                                                                                                                                                                                                                                                                |
| Account manager | Is not available at the moment                                                                                                                                                                                                                                                                                                                                                                                                                                                                                                                                                                                                                                                                                                                                                                                    |

In the upper part of the Order Escort you can find the [order buttons](https://docs.agenatrader.com/main/chart-area/order-escort#Order_Escort__Order_buttons) with the subcategories: **"Direct", "Synthetic"** and **"Scale-In"**. The lower part of the Order Escort contains the output window, which will inform the trader about the various events within the platform (executions, stop adjustments etc).

Left clicking on the **Save Setup** button will open a new dialog window and allow you to save a new manual setup, which will then be saved within the **Setup Builder**.

To place orders on the market with a mouse click you may use **Discretionary** function:

<figure><img src="https://docs.agenatrader.com/~gitbook/image?url=https%3A%2F%2F2805764894-files.gitbook.io%2F%7E%2Ffiles%2Fv0%2Fb%2Fgitbook-legacy-files%2Fo%2Fassets%252F-MKZSsJBtSP9L4sqIe_q%252F-MPsaNkq3q_vS5w7zRTc%252F-MPsfitvRoE_w_wzw6j4%252FDiscretionary.png%3Falt%3Dmedia%26token%3Def011dac-07f5-46fc-ac01-0ca6cfbfe43e&#x26;width=768&#x26;dpr=4&#x26;quality=100&#x26;sign=7d48e040&#x26;sv=1" alt=""><figcaption></figcaption></figure>

*The background color of the Order Escort depends on the trading status of AgenaTrader++ and can be:*

* grey: AgenaTrader++ is in waiting mode, meaning that there is no setup attached to the instrument.
* light green: when you have accepted a long trade setup (proposing mode) suggested by the Order Escort and have opened the long position (trading mode).
* red: when you have accepted a short trade setup (proposing mode) suggested by the Order Escort and have opened the short position (trading mode).

The changes in background color will allow you to see immediately whether a signal has occurred, which chart is currently in trading mode and in which direction the trade has been submitted to the market.

## Order Escort

The Order Escort is a window that includes more entry parameters for submitting orders than the usual order entry dialog. The OrderEscort supports both automatic and manual mode.

### Order buttons <a href="#order_escort__order_buttons" id="order_escort__order_buttons"></a>

The order buttons are categorized into three sections:

* Direct orders
* Synthetic orders
* Scale-in orders (Scale-In orders are temporarily deactivated)

The functionality of all available buttons is always applied to an entry order.

Click the **Ignore/Flatten trade** button to delete the suggested order ("Ignore") or close the currently running trade ("Flatten trade").

<figure><img src="https://docs.agenatrader.com/~gitbook/image?url=https%3A%2F%2F2805764894-files.gitbook.io%2F%7E%2Ffiles%2Fv0%2Fb%2Fgitbook-legacy-files%2Fo%2Fassets%252F-MKZSsJBtSP9L4sqIe_q%252F-MPsaNkq3q_vS5w7zRTc%252F-MPsfnfTb-jrn3RFU6eb%252FOrderEscort_OrderButtons.png%3Falt%3Dmedia%26token%3Dafda5940-6c1a-4fe5-a321-6aa6c49b25a0&#x26;width=768&#x26;dpr=4&#x26;quality=100&#x26;sign=6151daa3&#x26;sv=1" alt=""><figcaption></figcaption></figure>

### Order types <a href="#order_types" id="order_types"></a>

The following order types can be submitted to the market:

| Order type | Description                                                                                                                                                                                                                                                                                                                                                                                                                                                                                                                                                                                                                                                                                                                                                             |
| ---------- | ----------------------------------------------------------------------------------------------------------------------------------------------------------------------------------------------------------------------------------------------------------------------------------------------------------------------------------------------------------------------------------------------------------------------------------------------------------------------------------------------------------------------------------------------------------------------------------------------------------------------------------------------------------------------------------------------------------------------------------------------------------------------- |
| Market     | Assumes no price limits since the purpose of this order type is to execute an order as soon as possible. There is a potential danger of a worse price execution in comparison to the initial entry price due to incurred slippage, especially in highly illiquid markets.                                                                                                                                                                                                                                                                                                                                                                                                                                                                                               |
| Limit      | Requires a price limit to be entered. The execution price is supposed to be: [![Dot](https://docs.agenatrader.com/~gitbook/image?url=https%3A%2F%2Fagenatrader.com%2Fwiki%2Ftiki-download_file.php%3FfileId%3D22%26display\&width=300\&dpr=4\&quality=100\&sign=5ef5815b\&sv=1) ](https://agenatrader.com/wiki/tiki-download_file.php?fileId=22\&display)for a buy order - at most, the price of a limit order or lower. [![Dot](https://docs.agenatrader.com/~gitbook/image?url=https%3A%2F%2Fagenatrader.com%2Fwiki%2Ftiki-download_file.php%3FfileId%3D22%26display\&width=300\&dpr=4\&quality=100\&sign=5ef5815b\&sv=1) ](https://agenatrader.com/wiki/tiki-download_file.php?fileId=22\&display)for a sell order - at least, the price of a limit order or higher. |
| Stop       | Is a combination of a stop and market order. It is characterized by automatic submission of the "best order" (market) to the market (order book) as far as the predefined stop price level is reached.                                                                                                                                                                                                                                                                                                                                                                                                                                                                                                                                                                  |
| StopLimit  | A stop limit order is a combination of a stop and limit order. It is characterized by automatic submission of the limit order (market) to the market (order book) as far as the predefined stop limit price level is reached. Example [**here**](https://docs.agenatrader.com/main/chart-area/untitled/chart-context-menu#Limit_entry_for_StopLimit_orders)                                                                                                                                                                                                                                                                                                                                                                                                             |

#### Direct orders <a href="#direct_orders" id="direct_orders"></a>

Direct orders are submitted to the broker. Once a direct order is placed on the market it will be located on the exchange.

<figure><img src="https://docs.agenatrader.com/~gitbook/image?url=https%3A%2F%2F2805764894-files.gitbook.io%2F%7E%2Ffiles%2Fv0%2Fb%2Fgitbook-legacy-files%2Fo%2Fassets%252F-MKZSsJBtSP9L4sqIe_q%252F-MPsaNkq3q_vS5w7zRTc%252F-MPsfwO9utt3mXEVYe7e%252FOrderEscort_DirectOrders.png%3Falt%3Dmedia%26token%3D82cfb654-e5ca-4a93-a0c4-c55ee86a59a0&#x26;width=768&#x26;dpr=4&#x26;quality=100&#x26;sign=92043a8f&#x26;sv=1" alt=""><figcaption></figcaption></figure>

Even if the application is closed, the direct orders will remain active.

{% hint style="info" %}
*Note that if the direct order was submitted within a strategy and AgenaTrader is closed, then the trade management rules will no longer apply and the automatic order management will not remain active for this trade.*
{% endhint %}

Direct orders can be recognized on the chart by the **Direct** label as well as by the solid connection line between the chart trader bar and the price scale.

You can submit all order types as direct orders.

<figure><img src="https://docs.agenatrader.com/~gitbook/image?url=https%3A%2F%2F2805764894-files.gitbook.io%2F%7E%2Ffiles%2Fv0%2Fb%2Fgitbook-legacy-files%2Fo%2Fassets%252F-MKZSsJBtSP9L4sqIe_q%252F-MPsaNkq3q_vS5w7zRTc%252F-MPsg4G_OgxJAYVKAbf4%252FOrderEscort_DirectOrders1.png%3Falt%3Dmedia%26token%3D1025b551-03ee-4658-9d2f-9215ac844e0a&#x26;width=768&#x26;dpr=4&#x26;quality=100&#x26;sign=a5bd8725&#x26;sv=1" alt=""><figcaption></figcaption></figure>

#### Synthetic orders <a href="#synthetic_orders" id="synthetic_orders"></a>

Synthetic orders are not forwarded to the exchange and remain locally placed on your computer.

<figure><img src="https://docs.agenatrader.com/~gitbook/image?url=https%3A%2F%2F2805764894-files.gitbook.io%2F%7E%2Ffiles%2Fv0%2Fb%2Fgitbook-legacy-files%2Fo%2Fassets%252F-MKZSsJBtSP9L4sqIe_q%252F-MPsaNkq3q_vS5w7zRTc%252F-MPsg9p7nImnw_uFggCD%252FOrderEscort_SynthetictOrders.png%3Falt%3Dmedia%26token%3D7f7d42e8-9458-449a-9f0e-dd119c408a9a&#x26;width=768&#x26;dpr=4&#x26;quality=100&#x26;sign=27ce2ef3&#x26;sv=1" alt=""><figcaption></figcaption></figure>

{% hint style="success" %}
**The advantage of synthetic orders: market participants will not be able to see your positions, which allows you to submit "invisible" orders to the market.**
{% endhint %}

Synthetic orders can be recognized on the chart by the **Synthetic** label or by the dashed connection line between the chart trader bar and the price scale.

The following order types are supported:

* Limit: submits a limit order to the inside bid or inside ask when the limit price is reached.
* StopLimit: forwards a limit order to the exchange when the stop price is reached. If a stop price and a limit price are equal, a limit order will be placed in the inside bid or inside ask.
* Stop: executes a market order when the stop price is reached.

A synthetic market order does not make sense due to its immediate execution as a direct market order.

<figure><img src="https://docs.agenatrader.com/~gitbook/image?url=https%3A%2F%2F2805764894-files.gitbook.io%2F%7E%2Ffiles%2Fv0%2Fb%2Fgitbook-legacy-files%2Fo%2Fassets%252F-MKZSsJBtSP9L4sqIe_q%252F-MPsaNkq3q_vS5w7zRTc%252F-MPsgEuasndYHanbB9qY%252FOrderEscort_SynthetictOrders1.png%3Falt%3Dmedia%26token%3Dc8771290-e57c-4330-a6fe-f42666eb3cfe&#x26;width=768&#x26;dpr=4&#x26;quality=100&#x26;sign=d8d115e2&#x26;sv=1" alt=""><figcaption></figcaption></figure>

#### Dynamic orders <a href="#dynamic_orders" id="dynamic_orders"></a>

The possibility of submitting dynamic orders is an innovation implemented in AgenaTrader++. This function is only available in the Andromeda or higher versions. Essentially, a dynamic order is a synthetic order that is only submitted when a „suspicion“ arises.

**The dynamic order trading pad parameters:**

* An order type ;
* The entry strategy is set within the **Setup Builder**;
* Exact order size or stops, target and other usual order parameters are excluded.

AgenaTrader will only activate a strategy when the market price reaches an entry price. Once reached, the setup within the Entry Escort will automatically be applied to the chart by setting the appropriate stop and target orders.

<figure><img src="https://docs.agenatrader.com/~gitbook/image?url=https%3A%2F%2F2805764894-files.gitbook.io%2F%7E%2Ffiles%2Fv0%2Fb%2Fgitbook-legacy-files%2Fo%2Fassets%252F-MKZSsJBtSP9L4sqIe_q%252F-MPsaNkq3q_vS5w7zRTc%252F-MPsgIT_S-o5K11ffIGL%252FAndromeda_DynamicOrders.png%3Falt%3Dmedia%26token%3D0e79cbd9-2d09-488f-83ff-4cef1fdef6cb&#x26;width=768&#x26;dpr=4&#x26;quality=100&#x26;sign=82924725&#x26;sv=1" alt=""><figcaption></figcaption></figure>

The order size will also be calculated based on risk parameters.

The following dynamic order types are supported:

* Limit: submits a limit order to the inside bid or inside ask when the limit price is reached.
* StopLimit: forwards a limit order to the exchange when the stop price is reached. If a stop price and a limit price are equal, a limit order will be placed in the inside bid or inside ask.
* Stop: executes a market order when the stop price is reached.

A dynamic market order does not make sense due to its immediate execution as a direct market order.

This order is highly important in terms of a micro-hedging approach, since it will allow you to submit orders on hundreds of charts.

**How does the dynamic order work?**

1. After submitting an order, the market will decide if it is activated or not;
2. If activated, the system will apply the specific setup parameters;
3. If a dynamic order is placed on a chart and no strategy is running, the AT++ strategy will be activated immediately;
4. The automatic account management will start to control your trade. The orders can be moved into the fallout list when the invested amount exceeds the allowed limit for market-neutral positions.

A dynamic order makes sense when used as an entry order. If you define a stop or target order as a dynamic order then these orders become synthetic orders.

**Example: Cancel an order if the market has moved far away in the opposite direction** The image below shows a situation in which a dynamic order was not activated because the price did not increase as expected.

If you wish to enter a short position you can use a dynamic order and simply place an order at the desired price level. The setup (stop, targets, order size etc.) will be calculated once the price level has been reached. If you do not wish to submit a short order because the last high price has been reached, then you can place a dynamic order and connect it with a price alert (OCO order via the Ctrl button), which will delete the order as soon as the level is achieved.

<figure><img src="https://docs.agenatrader.com/~gitbook/image?url=https%3A%2F%2F2805764894-files.gitbook.io%2F%7E%2Ffiles%2Fv0%2Fb%2Fgitbook-legacy-files%2Fo%2Fassets%252F-MKZSsJBtSP9L4sqIe_q%252F-MPsaNkq3q_vS5w7zRTc%252F-MPsgMtxqd67_Muv1e3Q%252FdynamicOrders.png%3Falt%3Dmedia%26token%3D45f3ae35-34a7-49b7-8615-41f93a59753c&#x26;width=768&#x26;dpr=4&#x26;quality=100&#x26;sign=747c055&#x26;sv=1" alt=""><figcaption></figcaption></figure>

The scenario shown on the image would also be acceptable:

<figure><img src="https://docs.agenatrader.com/~gitbook/image?url=https%3A%2F%2F2805764894-files.gitbook.io%2F%7E%2Ffiles%2Fv0%2Fb%2Fgitbook-legacy-files%2Fo%2Fassets%252F-MKZSsJBtSP9L4sqIe_q%252F-MPsaNkq3q_vS5w7zRTc%252F-MPsgQN9dLG-scV0BKso%252FdynamicOrders2.png%3Falt%3Dmedia%26token%3D0eef1a9c-bb96-44ef-b5a5-32d4c38c430e&#x26;width=768&#x26;dpr=4&#x26;quality=100&#x26;sign=2317e7de&#x26;sv=1" alt=""><figcaption></figcaption></figure>

This illustrates the advantage of dynamic orders. You can place an entry order for hundreds of instruments. When the order is actually submitted, the setup (incl. targets and order size) will be calculated and adjusted according to the specific setup conditions.

#### Scale-in orders <a href="#scale-in_orders" id="scale-in_orders"></a>

{% hint style="danger" %}
**IMPORTANT NOTE! SCALE-IN ORDERS ARE TEMPORARILY DEACTIVATED.**
{% endhint %}

A scale-in order sends multiple orders (tranches) to the market until the desired position size is reached. AgenaTrader manages the order logic.

The following order types are supported:

* Limit: submits a limit order with the scale-in size to the inside bid or inside ask when the limit price is reached (minus the scale-in interval). If this limit order is executed, the next order will be placed. This process will repeat as many times as necessary until the desired position size is filled completely.
* StopLimit: submits a limit order to the inside bid or inside ask if the stop price and the limit price are equal, or forwards it to the exchange when the stop price is reached (minus the scale-in interval). This process will repeat as many times as necessary until the desired position size is filled completely.

You must adjust a limit price within the [Trading Information: Order Manager](https://docs.agenatrader.com/tools/trading-information#Trading_Information__Order_Manager), otherwise the limit price and the stop price will be the same.

If the market moves away from the last position of the scale-in order, then this order will be automatically adjusted.

<figure><img src="https://docs.agenatrader.com/~gitbook/image?url=https%3A%2F%2F2805764894-files.gitbook.io%2F%7E%2Ffiles%2Fv0%2Fb%2Fgitbook-legacy-files%2Fo%2Fassets%252F-MKZSsJBtSP9L4sqIe_q%252F-MPsaNkq3q_vS5w7zRTc%252F-MPsgTnanYu2enGZjD5G%252FOrderEscort_Scale-InOrders.png%3Falt%3Dmedia%26token%3Dcac1ffa5-bb35-4fcf-8c2e-66ca8e699631&#x26;width=768&#x26;dpr=4&#x26;quality=100&#x26;sign=6ac1f829&#x26;sv=1" alt=""><figcaption></figcaption></figure>

The appropriate parameters can be defined within the **Global Configuration** in the [**AT (Plus Plus): Order Rounding**](https://docs.agenatrader.com/create-your-own-trading-strategy/at-plusplus-manager#at-plus-plus-order-rounding) tabs:

| Parameter           | Description                                                                                                                                                                                                                                                           |
| ------------------- | --------------------------------------------------------------------------------------------------------------------------------------------------------------------------------------------------------------------------------------------------------------------- |
| Scale-In Size       | Displays the size used for the scale-in orders.                                                                                                                                                                                                                       |
| Scale-In Distance   | Scale-in orders will be submitted to the market as limit orders. The scale-in distance defines how many ticks away from the inside bid or inside ask the limit order will be placed. "0" - inside bid/ask; "1" - 1 tick below the inside bid or above the inside ask. |
| Scale-In Area (ATR) | As long as the market is within the ATR area, the order will remain unchanged. If the market leaves this area then the scale-in order will be automatically adjusted based on the ATR-Factor (the default setting is 20 periods).                                     |

#### Limit order buttons <a href="#limit_order_buttons" id="limit_order_buttons"></a>

The limit order buttons in each of the three categories only become active when the current price is lower than the suggested limit entry price (long position) or higher than the suggested limit entry price (short position).

You can see this in the price fields on the right hand side next to the **Market** button.

<figure><img src="https://docs.agenatrader.com/~gitbook/image?url=https%3A%2F%2F2805764894-files.gitbook.io%2F%7E%2Ffiles%2Fv0%2Fb%2Fgitbook-legacy-files%2Fo%2Fassets%252F-MKZSsJBtSP9L4sqIe_q%252F-MPsaNkq3q_vS5w7zRTc%252F-MPsg_Cwi_3glOnpY3V7%252FOrderEscort_LimitOrderButtons.png%3Falt%3Dmedia%26token%3D250a534e-59db-4b54-8cb7-232e5c226791&#x26;width=768&#x26;dpr=4&#x26;quality=100&#x26;sign=468a9403&#x26;sv=1" alt=""><figcaption></figcaption></figure>

* The **left field** displays the current price
* Еhe **right field** shows the distance of ticks/pips from the suggested entry price.

If the background color of these fields is green, then no limit order can be submitted, since the current price is currently above the limit entry price (long position) or below the limit entry price (short position).

If the limit entry price is below the current price (long position) or above the current price (short position), the background color will be red and a limit order can be submitted.

#### "Ignore", "Flatten" and "Status" buttons <a href="#ignore_flatten_and_status_buttons" id="ignore_flatten_and_status_buttons"></a>

**Ignore/flatten buttons**

*Depending upon whether the trade is already opened or not, the following options are available:*

* Ignore: deletes the suggested setup and the orders that have been already sent to the exchange.
* Flatten trade: deletes the suggested setup and the orders that have been already sent to the exchange, and also closes running trades.

<figure><img src="https://docs.agenatrader.com/~gitbook/image?url=https%3A%2F%2F2805764894-files.gitbook.io%2F%7E%2Ffiles%2Fv0%2Fb%2Fgitbook-legacy-files%2Fo%2Fassets%252F-MKZSsJBtSP9L4sqIe_q%252F-MPsaNkq3q_vS5w7zRTc%252F-MPsgdl_taG9180A6bxU%252FOrderEscort_Ignore.png%3Falt%3Dmedia%26token%3D85646297-c074-4bfa-b024-121b86b1678e&#x26;width=768&#x26;dpr=4&#x26;quality=100&#x26;sign=38050023&#x26;sv=1" alt=""><figcaption></figcaption></figure>

**Trading status**

*The Order Escort accepts the following statuses:*

* Stalking: Order Escort is deactivated and is waiting for an Entry Escort signal or activation of the manual mode.
* Proposing: Order Escort is in suggestion mode, which allows you to edit a setup.
* Pending: the entries and parameter definitions have been accepted, and the entry order has been submitted but not yet executed.
* Trading: a position has been opened, the stop and target orders have been activated by the system and the Strategy Escort is monitoring the trade.

<figure><img src="https://docs.agenatrader.com/~gitbook/image?url=https%3A%2F%2F2805764894-files.gitbook.io%2F%7E%2Ffiles%2Fv0%2Fb%2Fgitbook-legacy-files%2Fo%2Fassets%252F-MKZSsJBtSP9L4sqIe_q%252F-MPsaNkq3q_vS5w7zRTc%252F-MPsgi8Cg4r7N2G8_eo9%252Fbutton_status_custom.png%3Falt%3Dmedia%26token%3Dd788eded-8916-4630-8333-54a83eca19e8&#x26;width=768&#x26;dpr=4&#x26;quality=100&#x26;sign=8c1c5518&#x26;sv=1" alt=""><figcaption></figcaption></figure>

### Trade tab <a href="#trade-tab" id="trade-tab"></a>

Please find details on page [**Setup Builder: Trade tab**](https://docs.agenatrader.com/create-your-own-trading-strategy/setup-escort#Setup_Escort__Trade_tab)

### Target <a href="#order_escort__target" id="order_escort__target"></a>

The **Target tab** displays the price levels of the corresponding target orders and their volumes. Each AT++ strategy will allow you to submit up to three different targets. The targets can be changed or moved until the moment that the first target is executed.

<figure><img src="https://docs.agenatrader.com/~gitbook/image?url=https%3A%2F%2F2805764894-files.gitbook.io%2F%7E%2Ffiles%2Fv0%2Fb%2Fgitbook-legacy-files%2Fo%2Fassets%252F-MKZSsJBtSP9L4sqIe_q%252F-MPsaNkq3q_vS5w7zRTc%252F-MPsgn3ok3s2aGhihkbU%252FOrderEscortTarget_tab.png%3Falt%3Dmedia%26token%3D01d9287b-697f-444e-b640-5d26a9119e5c&#x26;width=768&#x26;dpr=4&#x26;quality=100&#x26;sign=881b2b9a&#x26;sv=1" alt=""><figcaption></figcaption></figure>

**Target size 1 - 3**

The **Target tab** displays the order sizes of the 1st, 2nd and 3rd target orders.

<figure><img src="https://docs.agenatrader.com/~gitbook/image?url=https%3A%2F%2F2805764894-files.gitbook.io%2F%7E%2Ffiles%2Fv0%2Fb%2Fgitbook-legacy-files%2Fo%2Fassets%252F-MKZSsJBtSP9L4sqIe_q%252F-MPsaNkq3q_vS5w7zRTc%252F-MPsgr-yxZyX8Wbv3ta-%252FOrderEscortTargetsize_1-3.png%3Falt%3Dmedia%26token%3Df56f31fb-6475-404f-a6fc-ec70921862c4&#x26;width=768&#x26;dpr=4&#x26;quality=100&#x26;sign=b1f92e64&#x26;sv=1" alt=""><figcaption></figcaption></figure>

The order sizes are based on the position size and can be defined as percentages within the [Setup Builder](https://docs.agenatrader.com/create-your-own-trading-strategy/setup-escort#Setup_Escort__Parameters_tab) for the corresponding [target](https://docs.agenatrader.com/create-your-own-trading-strategy/setup-escort#targetescorts).

<figure><img src="https://docs.agenatrader.com/~gitbook/image?url=https%3A%2F%2F2805764894-files.gitbook.io%2F%7E%2Ffiles%2Fv0%2Fb%2Fgitbook-legacy-files%2Fo%2Fassets%252F-MKZSsJBtSP9L4sqIe_q%252F-MPsaNkq3q_vS5w7zRTc%252F-MPsgvdVBIEkQdik8FhM%252FParameterTab.png%3Falt%3Dmedia%26token%3D58f4e14d-5b96-4329-b659-dfdf19058f8b&#x26;width=768&#x26;dpr=4&#x26;quality=100&#x26;sign=c3145061&#x26;sv=1" alt=""><figcaption></figcaption></figure>

**Setting the target size above the suggested level (can only be done from within the Order Escort)**

If you wish to set the target size above the proposed level, manually enter the desired target size or change the amount using the up and down arrow keys. Once entered, the background color will change to red and will no longer be adjusted if the stop or entry orders are edited.

Here you are responsible for ensuring that the target sizes are consistent with the position size.

<figure><img src="https://docs.agenatrader.com/~gitbook/image?url=https%3A%2F%2F2805764894-files.gitbook.io%2F%7E%2Ffiles%2Fv0%2Fb%2Fgitbook-legacy-files%2Fo%2Fassets%252F-MKZSsJBtSP9L4sqIe_q%252F-MPsaNkq3q_vS5w7zRTc%252F-MPsh16oTVtLKQ0da4Vs%252FOrderEscortTargetsize_1-3_1.png%3Falt%3Dmedia%26token%3D334cca14-2d8c-4e8c-9dfa-9c4ba95881f1&#x26;width=768&#x26;dpr=4&#x26;quality=100&#x26;sign=67a4d8b&#x26;sv=1" alt=""><figcaption></figcaption></figure>

If you want AgenaTrader++ (plusplus) to calculate the target sizes automatically according to the risk-specific criteria, double click in this field and move the entry / stop line inside the chart.

**Target price 1 - 3**

The **Target tab** displays the prices of the1st, 2nd and 3rd target orders.

You can edit the price level in one of the following ways:

* Move the chart trader bar for the target order directly on the chart
* Enter a new price manually inside the **Target price** field
* Increase or decrease the price level tick by tick to the next high low using the up and down arrow keys
* Use the drop-down list to select a price among the 30 possible price levels in both directions.

<figure><img src="https://docs.agenatrader.com/~gitbook/image?url=https%3A%2F%2F2805764894-files.gitbook.io%2F%7E%2Ffiles%2Fv0%2Fb%2Fgitbook-legacy-files%2Fo%2Fassets%252F-MKZSsJBtSP9L4sqIe_q%252F-MPsaNkq3q_vS5w7zRTc%252F-MPsh6VU-AlCNvldYVtO%252FOrderEscortTargetPrice_1-3.png%3Falt%3Dmedia%26token%3D5efd654a-d58e-448b-88b8-27c72572482c&#x26;width=768&#x26;dpr=4&#x26;quality=100&#x26;sign=8e1bbadf&#x26;sv=1" alt=""><figcaption></figcaption></figure>

The target order prices are based on:

* calculations applied to the target selected from the [Target Escort](https://docs.agenatrader.com/create-your-own-trading-strategy/setup-escort#entryescorts-1) list;
* minimal risk intervals defined in the [Setup Builder](https://docs.agenatrader.com/create-your-own-trading-strategy/setup-escort).

<figure><img src="https://docs.agenatrader.com/~gitbook/image?url=https%3A%2F%2F2805764894-files.gitbook.io%2F%7E%2Ffiles%2Fv0%2Fb%2Fgitbook-legacy-files%2Fo%2Fassets%252F-MKZSsJBtSP9L4sqIe_q%252F-MPsaNkq3q_vS5w7zRTc%252F-MPshADVTgLcabVIdtpp%252FOrderEscortTargetPrice_1-3%2520%281%29.png%3Falt%3Dmedia%26token%3Dd6c1a1f5-2d21-4ebd-8901-1d6464c2481b&#x26;width=768&#x26;dpr=4&#x26;quality=100&#x26;sign=9197aeab&#x26;sv=1" alt=""><figcaption></figcaption></figure>

### Stop <a href="#stop" id="stop"></a>

The **Stop** checkboxes allow you to define the target order type:

* if checked - a stop target order;
* if not checked - a dynamic limit target order.

<figure><img src="https://docs.agenatrader.com/~gitbook/image?url=https%3A%2F%2F2805764894-files.gitbook.io%2F%7E%2Ffiles%2Fv0%2Fb%2Fgitbook-legacy-files%2Fo%2Fassets%252F-MKZSsJBtSP9L4sqIe_q%252F-MPsaNkq3q_vS5w7zRTc%252F-MPshGy8Mlo3AebRpCu8%252FOrderEscortTargetStop.png%3Falt%3Dmedia%26token%3D7c82c8b4-af4a-415d-9c38-31b3f6303871&#x26;width=768&#x26;dpr=4&#x26;quality=100&#x26;sign=b3df1786&#x26;sv=1" alt=""><figcaption></figcaption></figure>

**Example.**

We will assume that you submit the target to the market as a **dynamic limit order**. After execution, this order becomes an additional trailing stop that will be triggered until the target marker is crossed. The stop target's trailing stop should run closer than the **Soft Trail stop** and will therefore start behind the bar that activated the stop target. The stop target will react similarly to a **Hard stop** and will be executed immediately. The advantage of this stop target method is that (partial) positions of targets will be secured but not closed, meaning that on a strongly trending market more profits can be realized with a larger position size.

<figure><img src="https://docs.agenatrader.com/~gitbook/image?url=https%3A%2F%2F2805764894-files.gitbook.io%2F%7E%2Ffiles%2Fv0%2Fb%2Fgitbook-legacy-files%2Fo%2Fassets%252F-MKZSsJBtSP9L4sqIe_q%252F-MPsaNkq3q_vS5w7zRTc%252F-MPshNFvwgYXd4_aBhp8%252FConfigurationTab.png%3Falt%3Dmedia%26token%3D35c03994-1c88-46b7-8eed-7e542a8a5ba3&#x26;width=768&#x26;dpr=4&#x26;quality=100&#x26;sign=15dbd4a0&#x26;sv=1" alt=""><figcaption></figcaption></figure>

**Lock**

If you have suggested (unconfirmed) orders within the chart and check the **Lock** checkbox, the targets will no longer be recalculated if the entry or stop order is edited.

<figure><img src="https://docs.agenatrader.com/~gitbook/image?url=https%3A%2F%2F2805764894-files.gitbook.io%2F%7E%2Ffiles%2Fv0%2Fb%2Fgitbook-legacy-files%2Fo%2Fassets%252F-MKZSsJBtSP9L4sqIe_q%252F-MPsaNkq3q_vS5w7zRTc%252F-MPshR7FGAaKvK2Y5oPr%252FOrderEscortTargetLock.png%3Falt%3Dmedia%26token%3D5c6e3947-b513-454e-ac01-ef62446fc521&#x26;width=768&#x26;dpr=4&#x26;quality=100&#x26;sign=30afaddc&#x26;sv=1" alt=""><figcaption></figcaption></figure>

### Account <a href="#order_escort__account" id="order_escort__account"></a>

The Order Escort **Account tab** contains all important account data and risk settings for a particular account. Please consult the [account settings](https://docs.agenatrader.com/create-your-own-trading-strategy/at-plusplus-manager#at-plus-plus-risk-management) to define the account to be displayed in this tab (depends upon the instrument type).

<figure><img src="https://docs.agenatrader.com/~gitbook/image?url=https%3A%2F%2F2805764894-files.gitbook.io%2F%7E%2Ffiles%2Fv0%2Fb%2Fgitbook-legacy-files%2Fo%2Fassets%252F-MKZSsJBtSP9L4sqIe_q%252F-MPsaNkq3q_vS5w7zRTc%252F-MPshWxua8ReEl2HANSp%252FOrderEscortAccount_tab.png%3Falt%3Dmedia%26token%3Ddb54ccb5-086d-48f2-880c-01d149007bf4&#x26;width=768&#x26;dpr=4&#x26;quality=100&#x26;sign=e69eb0e8&#x26;sv=1" alt=""><figcaption></figcaption></figure>

**Currencies and conversion**

Currencies are represented by the combination of profit & loss currency bases (see the [Global Configuration](https://docs.agenatrader.com/tools/configuration-escort)) and the current currency in which the instrument is listed. The P\&L currency is the first symbol, and the currency in which the instrument is listed is the second symbol.

*This is not representative of an actual currency pair!*

The conversion is performed using a synthetic exchange rate between the profit and loss currency base in which the corresponding underlying instrument is listed.

This exchange rate is set once a day (when AgenaTrader++ is started up and when the first conversion takes place).

<figure><img src="https://docs.agenatrader.com/~gitbook/image?url=https%3A%2F%2F2805764894-files.gitbook.io%2F%7E%2Ffiles%2Fv0%2Fb%2Fgitbook-legacy-files%2Fo%2Fassets%252F-MKZSsJBtSP9L4sqIe_q%252F-MPsaNkq3q_vS5w7zRTc%252F-MPsha5cTHcDS56c-LRj%252FOrderEscortAccount_tab_Currencies.png%3Falt%3Dmedia%26token%3D2e6fc453-56d2-4f8b-b10c-6e482c6b81d3&#x26;width=768&#x26;dpr=4&#x26;quality=100&#x26;sign=de61b883&#x26;sv=1" alt=""><figcaption></figcaption></figure>

**Examples**

P\&L currency: EUR Instrument: AAPL (listed in USD) Currencies: EURUSD

P\&L currency: EUR Instrument: BMW (listed in EUR) Currencies: EUREUR

P\&L currency: EUR Instrument: USDJPY (listed in JPY) Currencies: EURJPY

**NOTE!** A 3rd party platform will hardly ever manage to calculate the P\&L with regard to the exchange rate like a broker does. For this reason deviations are possible. Many brokers calculate this at the end of a day, while others use foreign currency pools, which are gradually bought by users and reconverted - although not regularly (once a day, week, month etc.). The exchange rates are obtained from Yahoo only once after starting AgenaTrader- at the moment when the first currency trading has been executed. Therefore, if you perform trades at varying times and using different computers, your P\&Ls that have been converted in the particular currency of brokers will deviate.

**Account size and buying power**

**Account size (cash value)** This is the amount of money available on an account.

**Buying power** Buying power is the number of shares, futures and currencies that can be bought. The initial risk is calculated based on the buying power. Some brokers increase the account size by a predefined factor in order to provide your account with leverage. This should not be confused with CFDs since buying power refers only to account leverage. The buying power may vary during the day (intraday) and the night (overnight trading). Usually the buying power is reduced by half for overnight trading. Higher buying power allows you more flexibility when trading and thus the possibility to trade more stocks. But note that stocks are usually traded 1:1 and have no leverage attached to them, therefore the account size can be exhausted very quickly.

<figure><img src="https://docs.agenatrader.com/~gitbook/image?url=https%3A%2F%2F2805764894-files.gitbook.io%2F%7E%2Ffiles%2Fv0%2Fb%2Fgitbook-legacy-files%2Fo%2Fassets%252F-MKZSsJBtSP9L4sqIe_q%252F-MPsaNkq3q_vS5w7zRTc%252F-MPshk94CBKsIgcwwrAi%252FOrderEscortAccount_tab_BuyingPower.png%3Falt%3Dmedia%26token%3D62e76d23-3478-444c-95d9-3313b2779ae0&#x26;width=768&#x26;dpr=4&#x26;quality=100&#x26;sign=180c3c9c&#x26;sv=1" alt=""><figcaption></figcaption></figure>

{% hint style="danger" %}
**IMPORTANT NOTE! BP2Invest / BP4Long / BP4Short parameters (are temporarily deactivated in the account settings)**
{% endhint %}

*You can see the following fields within the account tab:*

* BP2Invest: displays the size of the total buying power based on the risk restrictions for the specific trade.
* BP4Long: displays the amount invested into a long position based on the risk restrictions for the specific trade.
* BP4Short: displays the amount invested into a short position based on the risk restrictions for the specific trade.

In the **Used** fields you can see the current usage rate of the buying power.

The image below shows how these settings relate to the entry possibilities inside the [**General -> Account**](https://docs.agenatrader.com/create-your-own-trading-strategy/at-plusplus-manager#at-plus-plus-risk-management) tabs within the **Global Configuration** window.

<figure><img src="https://docs.agenatrader.com/~gitbook/image?url=https%3A%2F%2F2805764894-files.gitbook.io%2F%7E%2Ffiles%2Fv0%2Fb%2Fgitbook-legacy-files%2Fo%2Fassets%252F-MKZSsJBtSP9L4sqIe_q%252F-MPsaNkq3q_vS5w7zRTc%252F-MPshrZ9ycotuAPixYvQ%252Frisk.png%3Falt%3Dmedia%26token%3De27ac875-18f4-4b09-8a86-3c637e043536&#x26;width=768&#x26;dpr=4&#x26;quality=100&#x26;sign=6b53deec&#x26;sv=1" alt=""><figcaption></figcaption></figure>

**Initial risk**

See additional information about **Initial risk** (% field) in the [Trade-Tab: Strategy box](https://docs.agenatrader.com/create-your-own-trading-strategy/setup-escort#Strategy_box) section.

On the right hand side of the **Account tab** you can see the total amount that will be risked per trade.

<figure><img src="https://docs.agenatrader.com/~gitbook/image?url=https%3A%2F%2F2805764894-files.gitbook.io%2F%7E%2Ffiles%2Fv0%2Fb%2Fgitbook-legacy-files%2Fo%2Fassets%252F-MKZSsJBtSP9L4sqIe_q%252F-MPsaNkq3q_vS5w7zRTc%252F-MPshwqg42vrNyh9gcuV%252FOrderEscortAccount_tab_InitialRisk.png%3Falt%3Dmedia%26token%3Deba471b5-1ba0-40bc-ae7c-1d07a8607544&#x26;width=768&#x26;dpr=4&#x26;quality=100&#x26;sign=88c43f63&#x26;sv=1" alt=""><figcaption></figcaption></figure>

The **"EUR"** button shows the P\&L currency, which is:

* used for calculation of all specific criteria for money and risk management
* not necessarily the currency in which the account is held
* always relevant when the instruments are traded in different currencies.

For example, American stocks or futures that are traded in a EUR account. In a case such as this, AgenaTrader ++ will automatically perform all conversions for the various [risk and money management parameters](https://docs.agenatrader.com/create-your-own-trading-strategy/at-plusplus-manager#at-plus-plus-risk-management) for the [P\&L currency](https://docs.agenatrader.com/tools/configuration-escort#general).


# OptionTrading

## Introduction <a href="#introduction" id="introduction"></a>

Clear option chains for each instrument directly under your charts or as a separate window make it possible to keep track of the latest option data at all times and to find the optimal option for your own trading. The option selected in the OptionChain is synchronized directly with the new OptionTradingPad, which can be used to buy or sell the option with a single further click.

In addition, there is the possibility to trade options directly from a chart (Option-ChartTrading) using the right-click menu - a particularly convenient solution for trading options. The current option trades are displayed directly in the chart of the underlying.

With new indicators that can display greeks and other options data, it is possible to graphically analyze these data series and also incorporate them into automatic scans and signals with the SignalBuilder. Our aim is to offer the best possible software and the most advanced tools for option traders.

<figure><img src="https://docs.agenatrader.com/~gitbook/image?url=https%3A%2F%2F2805764894-files.gitbook.io%2F%7E%2Ffiles%2Fv0%2Fb%2Fgitbook-legacy-files%2Fo%2Fassets%252F-MKZSsJBtSP9L4sqIe_q%252F-MPDtoZQcIfH15XRa6OO%252F-MPDzKxwss-lY_6EdMYP%252FChain01.png%3Falt%3Dmedia%26token%3D4a92b97e-fb2f-4eeb-8034-c6e049b1fc68&#x26;width=768&#x26;dpr=4&#x26;quality=100&#x26;sign=d3762e84&#x26;sv=1" alt=""><figcaption></figcaption></figure>

### Requirements <a href="#requirements" id="requirements"></a>

To enable your broker and datafeed in AgenaTrader to receive options-data / trade options, you need to enable the „Option“ Instrument Type in the account-connection setup window for the accounts you want to use.

<figure><img src="https://docs.agenatrader.com/~gitbook/image?url=https%3A%2F%2F2805764894-files.gitbook.io%2F%7E%2Ffiles%2Fv0%2Fb%2Fgitbook-legacy-files%2Fo%2Fassets%252F-MKZSsJBtSP9L4sqIe_q%252F-MQBxqyXcax_338ajC9L%252F-MQBy2UvB3TPHDW8CSe7%252FSettings01.png%3Falt%3Dmedia%26token%3D1e7dd2bc-6b5d-4d1e-a58e-6bafb0969ee6&#x26;width=768&#x26;dpr=4&#x26;quality=100&#x26;sign=67860719&#x26;sv=1" alt=""><figcaption></figcaption></figure>

#### **1. Datafeeds** <a href="#id-1.-datafeeds" id="id-1.-datafeeds"></a>

The feed for which you activate the „Option“ Instrument Type will serve as the data source for the OptionChain and the option-indicators. You can also use the Multi-Feed possbilitiy of AgenaTrader to use one datafeed only for Options, and another datafeed for the underlying.

* InteractiveBrokers (Additional subscription to OPRA-data necessary)
* IQ Feed (Additional subscription to OPRA-data necessary)
* Rithmic

#### **2. Broker / Technology providers** <a href="#id-2.-broker-technology-providers" id="id-2.-broker-technology-providers"></a>

* InteractiveBrokers
* Rithmic

## OptionChain <a href="#optionchain" id="optionchain"></a>

Table of contents:

Access the option chain from the chart toolbar using this symbol: <img src="/files/NbEU8CmiwW5UtCqnxyGv" alt="" data-size="line">

This symbol refers to a uppercase greek delta letter, which therefore associates to the greeks shown and calculated in the OptionChain. If you are connected to a datafeed which is able to receive option-data for the underlying you have opened in your chart, the OptionChain will load and data will appear in the table.

<figure><img src="https://docs.agenatrader.com/~gitbook/image?url=https%3A%2F%2F2805764894-files.gitbook.io%2F%7E%2Ffiles%2Fv0%2Fb%2Fgitbook-legacy-files%2Fo%2Fassets%252F-MKZSsJBtSP9L4sqIe_q%252F-MQBxqyXcax_338ajC9L%252F-MQBzQdkTF4bqJ6-cZhq%252FChain02.png%3Falt%3Dmedia%26token%3D63a8dabc-5774-4047-ab80-02f7999366a9&#x26;width=768&#x26;dpr=4&#x26;quality=100&#x26;sign=9b08ffb3&#x26;sv=1" alt=""><figcaption></figcaption></figure>

The left side of the chain shows data for Calls, the right side shows Put-information. In the middle column, each available strike price is shown. If you open e.g. the AAPL stock in your chart and then load the OptionChain, automatically the available optionexpiries (tabs) and available strikes (rows) will be loaded. There is one row which has darker background than the others – this is the at-the-money (ATM) strike, which means it is the strike which is nearest to the current price of the underlying. The rows with lighter background are the in-the-money (ITM) options, while the darker background indicates out-of-the-money (OTM) options.

You also can open a standalone OptionChain with Main -> New -> OptionChain.

### **Settings** <a href="#settings" id="settings"></a>

**​1. General Settings**

**1 Expirations**

AgenaTrader is automatically detecting the available option-expiries for each individual instrument. Each expiry is a single Tab with following information:

* Expiry-Date
* Regular expiry (R) or weekly expiry
* Days remaining until expiry

You can increase the shown expiries (tabs) by changing the number in the Expiration-field. The available expiries are limited regarding how far in the future they are provided.

**1.1.1.2. 2 Strikes**

Here you can select, how many strikes in total should be shown in the OptionChain. The ATM strike is not considered in this count. If you choose a strike count of 10, then 5 strikes above the ATM-strike and 5 strikes below the ATM-strike will be shown. If you increase the number of strikes, a new strike will be added one time above and one time below the ATM-strike alternately.

**1.1.1. OptionLines**

By activating „Show OptionLines“, each specific option which you click on in the OptionChain from now on will be graphically shown in the underlying chart. In that way, you can easily check visually, how far the strike price would be away from the current market price, as well as how far in the future the expiry will be. ![Image](file:///C:/Users/Manuel/AppData/Local/Temp/msohtmlclip1/01/clip_image005.jpg) If you activate „Temp. Lines“, only the lines for the latest clicked option are drawn in the chart. With the „Expiry“ and „Strikes“ you can change the color of each new shown option in the chart. You can use this tool to quickly check, where you want to place your option-orders.

**1.1.2. StrikeRanges**

With this tool you can add far-away strikes to your strike-list. That is particularly useful if you for example want to write calls or puts e.g. 10% above/below the current market price. In that case you can set the lower range to 10-12%, thus all strikes which are 10-12% below from the current market price will be added to your OptionChain, vice versa for the upper range. You can select if you put the values in „%“ (values between 0 and 100 allowed) or in absolute numbers „Abs“. With the „Abs“ setting, you e.g. can put the lower range to 110-130 for AAPL options, consequently all strikes with are between these pricec this range will be added to your OptionChain. Activating the „Fix“ checkbox means, the borders you are set for the ranges will not be included in the selection. If we take the example from above with lower absolute range 110-130, then strikes of 110 and 130 will not be included in the list. If you deactivate the „Fix“ checkbox, the OptionChain will add the border-values to the selection. If there are no strikes for the border-values, the next available strike will be added to the list, even if it is slightly out of the range. In that way, you can avoid that you slightly miss a strike if your selection is too strict.

**1.1.3. Choose Columns**

If you right-click in the header of the OptionChain columns, the right-click menu opens and you can select „Choose Columns“. In the following window you can select and deselect which columns you want to see in your option chain.

**1.1.4. Move Columns**

You can easily change the order of the columns in your OptionChain, by left-clicking the header of a row and drag\&drop it to the position where you want it to be.

**1.1.5. Color Settings**

By opening the Color-menu in the chart-toolbar, you will find a new button „Option Chain setting“ – click on it for the detailled configuration of the graphics of your OptionChain.

<figure><img src="https://docs.agenatrader.com/~gitbook/image?url=https%3A%2F%2F2805764894-files.gitbook.io%2F%7E%2Ffiles%2Fv0%2Fb%2Fgitbook-legacy-files%2Fo%2Fassets%252F-MKZSsJBtSP9L4sqIe_q%252F-MQBxqyXcax_338ajC9L%252F-MQBzdCuwl0iSR1EsbNN%252FColorSettings.png%3Falt%3Dmedia%26token%3D9b039cd1-84ca-47f9-b600-8a8688665922&#x26;width=768&#x26;dpr=4&#x26;quality=100&#x26;sign=9802c7a2&#x26;sv=1" alt=""><figcaption></figcaption></figure>

The most important settings here are the colors for each column – e.g. the property „clmCallsAsk“ represents the ask-column on the call-side. You easily can change the background color of each single column here in the settings. If you want to set the coloring back to default values, just press the „Default“ button in the lower left corner of this window.

<figure><img src="https://docs.agenatrader.com/~gitbook/image?url=https%3A%2F%2F2805764894-files.gitbook.io%2F%7E%2Ffiles%2Fv0%2Fb%2Fgitbook-legacy-files%2Fo%2Fassets%252F-MKZSsJBtSP9L4sqIe_q%252F-MQBxqyXcax_338ajC9L%252F-MQBziD7JAoR8bFvepgM%252FColorSettings02.png%3Falt%3Dmedia%26token%3D82ba6faf-1daa-4a1f-bdd1-aba3d7736371&#x26;width=768&#x26;dpr=4&#x26;quality=100&#x26;sign=639187e&#x26;sv=1" alt=""><figcaption></figcaption></figure>

### **Available Columns** <a href="#available_columns" id="available_columns"></a>

1. Bid/Ask
2. BidSize/AskSize
3. Last price
4. Option Volume
5. Option OpenInterest (OI)
6. ImpliedVolatility (IV%)
7. Greeks
   * Delta
   * Gamma
   * Theta
   * Vega

(Information about the greeks can be found here: [LINK](https://www.investopedia.com/terms/g/greeks.asp))

{% hint style="info" %}
**IMPORTANT:**

InteractiveBrokers is calculating the greeks inside the TWS and sending the values directly to AgenaTrader. IQ-Feed does not provide greek-values directly, so we need to calculate the greeks based on the BlackScholes formula inside AgenaTrader. BlackScholes calculations are quite complex and dependent on many input factors. For that reason, there are new settings in the GlobalConfiguration, where you can set the basic input parameters which AgenaTrader should use for the greeks-calculations for IQ-Feed. If you do not have deep knowledge about the BlackScholes formula, we recommend that you do not change the values provided by default. The values calculated by BlackScholes formula also have some estimations in it, as BlackScholes is basically calculating greeks for european style options, while today most options are american style options. Greeks are a complex topic, and you most probably will get different results for greeks and implied volatility for each single source you check. Anyway, we try to calculate the greeks in the most efficient and best possible way.
{% endhint %}

<figure><img src="https://docs.agenatrader.com/~gitbook/image?url=https%3A%2F%2F2805764894-files.gitbook.io%2F%7E%2Ffiles%2Fv0%2Fb%2Fgitbook-legacy-files%2Fo%2Fassets%252F-MKZSsJBtSP9L4sqIe_q%252F-MQBxqyXcax_338ajC9L%252F-MQBzn95ej4lK7qMF2hY%252FBlackScholes.png%3Falt%3Dmedia%26token%3Dec9c8d8a-68e7-4955-a2cb-38062f92de9a&#x26;width=768&#x26;dpr=4&#x26;quality=100&#x26;sign=3747d3af&#x26;sv=1" alt=""><figcaption></figcaption></figure>

#### **Send option to option pad** <a href="#send-option-to-option-pad" id="send-option-to-option-pad"></a>

The OptionTradingPad stays always synchronized to the OptionChain. To send a selected option to the OptionTradingPad, you just need to left-click on the row of the option you would like to trade. If you click in any of the Call-columns, a call with the selected strike and expiry will be sent to the OptionTradingPad, vice versa if you click in any of the Put-columns. You will see the synchronization in the Instrument-field in the OptionTradingPad – it is constantly changing if you select different options in the OptionChain.

## <img src="/files/DRzc4C4u5iLEJssKzQaK" alt="" data-size="line">OptionTradingPad <a href="#optiontradingpad" id="optiontradingpad"></a>

With this new pad you can send option-orders very easily to your broker. The pad is accessible from the ChartToolbar and also directly from the ActionBar:<img src="/files/lCYkIMfAnkXAn0qejWwZ" alt="" data-size="line">

<figure><img src="https://docs.agenatrader.com/~gitbook/image?url=https%3A%2F%2F2805764894-files.gitbook.io%2F%7E%2Ffiles%2Fv0%2Fb%2Fgitbook-legacy-files%2Fo%2Fassets%252F-MKZSsJBtSP9L4sqIe_q%252F-MQBxqyXcax_338ajC9L%252F-MQBzrRQM3ikNjRReDp0%252FOptionPad.png%3Falt%3Dmedia%26token%3D1f0ad014-99f7-4df5-a4bf-e502302ac760&#x26;width=768&#x26;dpr=4&#x26;quality=100&#x26;sign=4b47c05a&#x26;sv=1" alt=""><figcaption></figcaption></figure>

**CHOOSE AN OPTION (MANUALLY)**

The „Instrument“ field in the „Order General Settings“ is a read-only field, so you cannot change it directly. This field will get updated according to the changes you are doing below. So you can select the order quantity, if you want a Put or Call option. In addition, for the expiry if you open the drop-down menu, you will see all expiries available for this underlying. Same logic applies to the Strike-selection.

**CHOOSE AN OPTION (SYNC FROM OPTION CHAIN)**

To choose a specific option you want to trade, you can select the instrument you want directly in the OptionChain (described in 2.c) – then Expiry and Strike will be immidiately passed to the OptionTradingPad. All you need to choose is the Quantity how many of these options you want to trade.

**REALTIME OPTION DATA**

If your datafeed is providing realtime information about the option you chose in the „Order General Settings“, current Bid and Ask price is shown in this field, so you quickly can see the latest price of the selected option.

**ORDER TYPES AND ORDER EXPIRY**

These settings are the same as for any other order in stocks, futures, etc. – you can place Market, Stop, Limit and StopLimit orders for options. They will be triggered, if the option-price reaches the specified level (so they are not triggered by the underlying price, but by the price of the actual option for which you are creating an order). The order expiry simply manages, how long your order should be valid:

* Gtc = Good Till Cancel
* Day = Valid until end of day
* Gtd = Good Till Date
* Ioc = Immidiate or Cancel

**BUY / SELL**

Click the Buy / Sell buttons, to transmit your order to the broker. If you activate the „Out RTH“ checkbox, your order is allowed to be filled outside of regular trading hours – your broker is responsible for these executions.

<figure><img src="https://docs.agenatrader.com/~gitbook/image?url=https%3A%2F%2F2805764894-files.gitbook.io%2F%7E%2Ffiles%2Fv0%2Fb%2Fgitbook-legacy-files%2Fo%2Fassets%252F-MKZSsJBtSP9L4sqIe_q%252F-MQBxqyXcax_338ajC9L%252F-MQBzw03CzQs4R98WjpY%252FOptionPad02.png%3Falt%3Dmedia%26token%3D39db7e18-38f3-4a86-b8d0-50aba24d2502&#x26;width=768&#x26;dpr=4&#x26;quality=100&#x26;sign=5bfa47f2&#x26;sv=1" alt=""><figcaption></figcaption></figure>

**TRADE OPTION COMBINATIONS**

This button currently is without any function, in future with this button you will be able to open the advanced option trading pad, with which you will be able to easily and efficiently trade option combinations like straddles, strangles, spreads, butterflies, etc.

## Options Chart-Trading <a href="#options_chart_trading" id="options_chart_trading"></a>

**Place an option trade**

To place a option-order directly in the chart, you simply open the right-click menu in the chart and choose „Buy Option“ or „Sell Option“:

<figure><img src="https://docs.agenatrader.com/~gitbook/image?url=https%3A%2F%2F2805764894-files.gitbook.io%2F%7E%2Ffiles%2Fv0%2Fb%2Fgitbook-legacy-files%2Fo%2Fassets%252F-MKZSsJBtSP9L4sqIe_q%252F-MQBxqyXcax_338ajC9L%252F-MQC--2bVJGFwjTegBBr%252FRightClickMenu01.png%3Falt%3Dmedia%26token%3Df80114f7-1a7a-4c92-8daa-f50f5ecf8133&#x26;width=768&#x26;dpr=4&#x26;quality=100&#x26;sign=d0ba0e8d&#x26;sv=1" alt=""><figcaption></figcaption></figure>

**OptionTraderBar**

The TraderBars in the chart for option-orders have new properties, so you can select the option you want to trade directly from the TraderBar:

<figure><img src="https://docs.agenatrader.com/~gitbook/image?url=https%3A%2F%2F2805764894-files.gitbook.io%2F%7E%2Ffiles%2Fv0%2Fb%2Fgitbook-legacy-files%2Fo%2Fassets%252F-MKZSsJBtSP9L4sqIe_q%252F-MQBxqyXcax_338ajC9L%252F-MQC-2qhJT7sLNJsjVkZ%252FChartBar01.png%3Falt%3Dmedia%26token%3D965ca610-19f0-4d23-985c-8bca425ba69a&#x26;width=768&#x26;dpr=4&#x26;quality=100&#x26;sign=4b551f7a&#x26;sv=1" alt=""><figcaption></figcaption></figure>

**Strike selection**

* If you click on the strike-price, a dropdown with all available strikes will open up – just select the strike you want to trade.
* **IMPORTANT**! The OptionTraderBar will always be displayed in the underlying instrument at the strike-price you select. So if you select a strike of 250.00, the OptionTraderBar will be shown at a price of 250.00 of the underlying. The strike price is the only real connection between the underlying and the option, therefore the underlying-price and the options‘ strike price are connected in the chart.

**Expiry selection**

If you click on the expiry-date, a dropdown with all available expiries will open up – just select the expiry you want to trade.

**Stop price (for Stop-Orders)**

This is the field on the most left side of the TraderBar, you can simply type in the price you want to be transmitted as Stop-price for your order.

**Limit price (for Limit-Orders)**

This is the field on the most left side of the TraderBar, you can simply type in the price you want to be transmitted as Stop-price for your order.

**Stop and Limit price (for StopLimit-Orders)**

For StopLimit Orders you can select the limit price in the „L:“ field and the Stop price in the „S:“ field.

<figure><img src="https://docs.agenatrader.com/~gitbook/image?url=https%3A%2F%2F2805764894-files.gitbook.io%2F%7E%2Ffiles%2Fv0%2Fb%2Fgitbook-legacy-files%2Fo%2Fassets%252F-MKZSsJBtSP9L4sqIe_q%252F-MQBxqyXcax_338ajC9L%252F-MQC-7WLOAiWG1-XPk8S%252FChartBar02.png%3Falt%3Dmedia%26token%3Dfa00fbdc-fa52-4dc9-834a-9eb9a77c567a&#x26;width=768&#x26;dpr=4&#x26;quality=100&#x26;sign=a88ecd78&#x26;sv=1" alt=""><figcaption></figcaption></figure>

**Multiple TraderBars per chart**

For OptionTrades from now on it is possible to see multiple active TraderBars in your chart – each strike price will have ist own TraderBar. On the right side of the TraderBar, you see exactly which option you are trading at this strike price at the moment.

<figure><img src="https://docs.agenatrader.com/~gitbook/image?url=https%3A%2F%2F2805764894-files.gitbook.io%2F%7E%2Ffiles%2Fv0%2Fb%2Fgitbook-legacy-files%2Fo%2Fassets%252F-MKZSsJBtSP9L4sqIe_q%252F-MQBxqyXcax_338ajC9L%252F-MQC-Bj5APrHtelzZiCZ%252FChartBar03.png%3Falt%3Dmedia%26token%3D4f16ba30-590a-41af-a110-06d4d026cf8f&#x26;width=768&#x26;dpr=4&#x26;quality=100&#x26;sign=990608b&#x26;sv=1" alt=""><figcaption></figcaption></figure>

**Multiple trades on the same strike**

If you open multiple orders/trades on exactly the same strike, the OrderBar will switch to MultiOrder mode - a button will appear on the left side of the OrderBar to unfold the order-view. By clicking on the button, all orders on this strike will be listed one below the other and highlighted with a blue background, indicating that all these orders/trades are placed on the same strike. Without this new display method, orders on the same strike would otherwise be overlayed and would no longer be manageable individually.

<figure><img src="https://docs.agenatrader.com/~gitbook/image?url=https%3A%2F%2F2805764894-files.gitbook.io%2F%7E%2Ffiles%2Fv0%2Fb%2Fgitbook-legacy-files%2Fo%2Fassets%252F-MKZSsJBtSP9L4sqIe_q%252F-MQBxqyXcax_338ajC9L%252F-MQC-GbUvlThNjFV0qhQ%252FMultipleOrdersSameStrike.png%3Falt%3Dmedia%26token%3Dc745f4ab-b95d-4b9c-a859-81042a5d91a5&#x26;width=768&#x26;dpr=4&#x26;quality=100&#x26;sign=69721f7b&#x26;sv=1" alt=""><figcaption></figcaption></figure>

**Proposal orders vs activated orders**

Proposal orders work the same way as orders in all other asset classes in AgenaTrader. You can choose the strike, expiry, stop/limit prices until you are satisfied. Only when you press the green checkmark-symbol in the OptionTraderBar, the order is transmitted to your broker and is now an active open order.

**Calculate Profit/Loss**

Profit/Loss of option trades is calculated the same way as for all other trades in AgenaTrader: the P\&L is calculated inside AgenaTrader with current bid/ask prices. If no bid/ask price is received from your datafeed, P\&L can not be calculated and „0.00“ will be shown in the traderbar. Please always make sure that you control the displayed P\&L with your brokers‘ plattform.

**Mark-color in a ChartGroup**

If you are net-long with option-trades (you bought more options than you sold for this underlying), the instrument will be marked with cyan color (long color for options) in a LCG. If you are net-short with option-trades (you sold more options than you bougth for this underlying), the instrument will be marked with purple background. For proposal option-orders the background color of a instrument in the LCG will be light-blue (same as for orders in other asset classes).

**Cancel/Close an order/trade**

Cancelling an order or a trade works the same way as for all other asset classes. If you click the red cross in the OptionTradingBar, an active order will be cancelled / an active trade will be closed by transmitting the closing (market) order automatically to your broker.

## Option Indicators <a href="#option_indicators" id="option_indicators"></a>

With the new option indicators you can chart options-data directly in your chart and also add them to conditions and signals in your columns or in SignalBuilder. InteractiveBrokers does not provide historical data for options, while IQ does provide historical data for options.

<figure><img src="https://docs.agenatrader.com/~gitbook/image?url=https%3A%2F%2F2805764894-files.gitbook.io%2F%7E%2Ffiles%2Fv0%2Fb%2Fgitbook-legacy-files%2Fo%2Fassets%252F-MKZSsJBtSP9L4sqIe_q%252F-MQBxqyXcax_338ajC9L%252F-MQC-L7ZPe-EqiwvUNlc%252FOptionIndicators.png%3Falt%3Dmedia%26token%3Dcbd76007-98b8-46b4-95f7-1b9748383943&#x26;width=768&#x26;dpr=4&#x26;quality=100&#x26;sign=8f51fef8&#x26;sv=1" alt=""><figcaption></figcaption></figure>

**Option Listener**

This is a realtime-indicator, it will start loading data as soon as you add the indicator to your chart. Switch to the 1-Minute timeframe to see some results more quickly. No historical options data will be loaded with this indicator.

* **Expiry:** Choose for which option expiry the data should be loaded
* **Field:** Choose the datseries you want to output with the indicator
* **OptionType:** Put or Call option data
* **Strike:** Choose for which strike the data should be loaded

**Option Listener Atm**

Same indicator as the OptionListener, but this indicator always detects the current ATM strike and the nearest expiry, so you can load this indicator as a column to your LCG and e.g. print out any of the greeks values without having to manually select which exact option (strike/expiry) you want to see.

**Option Multiline Listener**

Again, basically the same logic as the OptionListener, but with this indicator you can plot many dataseries of a single option at once. You have a list of selections which optionsdata should be shown in the indicator panel.

* **Days in Year:** Input value for BlackScholes calculation. There are two main mostly used settings: 365days or 250days. The chosen value will affect the greeks and implied volatility calculations.
* **Dividend Yield:** Input value for BlackScholes calculation. What dividend the underlying yields. As there is not dividend data available in AgenaTrader, you can set the dividend yield on your own. IQ also uses a dividend yield of „0“ for their internal calculation.
* **Expiry:** Choose for which option expiry the data should be loaded
* **OptionType:** Put or Call option data
* **Risk-Free Rate:** Input value for BlackScholes calculation. What risk-free rate is available in the markets? Usually returns of US-Bonds are used as proxy for this value. IQ-Feed uses 5% as risk-free rate in their internal greek-calculations, therefore we also take this value by default.
* **Strike:** Choose for which strike the data should be loaded

**​Option BlackScholes Listener**

This again follows the logic of the OptionMultilineListener, but this indicator is calculating the greek values and the implied volatility with the BlackScholes formula. It is available for IQFeed and is calculating all values also for historical values (as IQFeed is providing historical options data). You can

**InstrumentExpiries**

This new indicator works in future-charts (shows future expiries) as well as in stock-charts (shows stock-option expiries). Scroll the chart to the left and you will see vertical lines in the chart which represent the next expiries for this instrument.

<figure><img src="https://docs.agenatrader.com/~gitbook/image?url=https%3A%2F%2F2805764894-files.gitbook.io%2F%7E%2Ffiles%2Fv0%2Fb%2Fgitbook-legacy-files%2Fo%2Fassets%252F-MKZSsJBtSP9L4sqIe_q%252F-MQBxqyXcax_338ajC9L%252F-MQC-Qo3M6kWVwpTtL23%252FInstrumentExpiries02.png%3Falt%3Dmedia%26token%3Ddf6456c8-8646-4613-953a-f4221faa27d8&#x26;width=768&#x26;dpr=4&#x26;quality=100&#x26;sign=55532450&#x26;sv=1" alt=""><figcaption></figcaption></figure>

<figure><img src="https://docs.agenatrader.com/~gitbook/image?url=https%3A%2F%2F2805764894-files.gitbook.io%2F%7E%2Ffiles%2Fv0%2Fb%2Fgitbook-legacy-files%2Fo%2Fassets%252F-MKZSsJBtSP9L4sqIe_q%252F-MQBxqyXcax_338ajC9L%252F-MQC-VNyp8Qr3zxdRrB7%252FInstrumentExpiries01.png%3Falt%3Dmedia%26token%3Ddd55dd1f-fb5d-4588-a8fd-6e64af5ba865&#x26;width=768&#x26;dpr=4&#x26;quality=100&#x26;sign=b4579aca&#x26;sv=1" alt=""><figcaption></figcaption></figure>

## **Hotkeys** <a href="#hotkeys" id="hotkeys"></a>

Following hotkeys are available:

1. Toggle Options Trading Pad (Category „Chart Pads“)
2. OptionChain (Category „Charts“)


# Realtime Scanner

AgenaTrader has developed an innovative scanner that allows you to scan hundreds of instruments in real time.

The scanner can be accessed by creating:

* a [watch list](https://docs.agenatrader.com/main/main-menu/watch-lists) (**Main -> New -> Watch**) (see image below) or
* a [list chart group](https://docs.agenatrader.com/main/chart-area/chart-container/chart-container#Chart_Container__List_Chart_Group) (LCG) (**Main -> New -> Chart container -> List chart group**)

<figure><img src="/files/MLvzg3ItfZKTXv5Yp6jP" alt=""><figcaption></figcaption></figure>

The scanner columns may have different colors:

* <mark style="color:green;">green:</mark> indicates a long position
* <mark style="color:red;">red:</mark> indicates a short position
* <mark style="color:blue;">blue:</mark> indicates suggested but not confirmed orders

You can find additional AT++ scanner functions, in the [Setup Builder: Analyzer Column](https://docs.agenatrader.com/create-your-own-trading-strategy/setup-escort#analyzer-escort-column) section. If you make changes to the **Entry Escorts** list within the **Setup Builder** activation tab, then the scanner must be reloaded for the LCG or watch list. You can rearrange the instruments/symbols in the scanner via drag and drop.

{% hint style="success" %}
Tip!

By holding the Shift- or Ctrl-Key you can easily select multiple items of a Watchlist or any other list. By pressing the 'Del' key afterwards, you can delete all those symbols at once.
{% endhint %}

<figure><img src="/files/5JHUugCtJ5MFrSdv93Ul" alt=""><figcaption></figcaption></figure>

## **Dot Display for No Signal**

In the Analyzer Columns, each cell displays either a **trading signal** or a **dot**, depending on whether a signal has been detected during the current scan.

#### ● When is the dot shown?

* A **dot** is shown when **no trading signal** is found during the current candle scan.
* As soon as a valid signal is detected, it will **replace the dot** and display the **signal name**.
* This ensures that every cell always shows either an **active signal** or an **explicit "no signal" indication**.

#### 🟢🟡 Dot Color Behavior

The **dot color does not indicate signal strength or status** — it simply shows that AgenaTrader is **actively scanning each new candle**.

* The first scan after launching or switching timeframes will show a **green dot**.
* If **no signal** is found in the next candle, the dot turns **yellow**.
* The color **alternates** with each new candle — green, yellow, green, yellow — as long as no signal is found.

This color shift helps visually confirm that the analyzer is evaluating each new candle in real time.

### Tooltip

Hovering over a dot displays the following tooltip:\
**"No signal detected, wait for the next candle."**

#### ⚠️ Notes

* If an instrument is **not ticking or not delivering new data**, the dot color will **not change**, as no new candle is being scanned.
* As soon as a valid trading signal is found, the dot will be replaced with the corresponding **signal label**.

## Scanner Toolbar <a href="#scanner-toolbar" id="scanner-toolbar"></a>

The scanner toolbar provides swift access to critical scanner functions and is highly customizable. Click on the toolbar options and select **Add / Remove commands** to choose the icons you prefer to display on the toolbar.

<figure><img src="/files/est9OUuAL9dxmzKBQhwy" alt=""><figcaption></figcaption></figure>

## Scanner context menu <a href="#scanner-context-menu" id="scanner-context-menu"></a>

To bring up the context menu, right click within the scanner interface.

The context menu can be reached from the watch list or a list chart group.

The image below shows the context menu options and several additional choices for a list chart group (marked in red).

<figure><img src="/files/DaH1ZW0xvQK2k3ZGhQfN" alt=""><figcaption></figcaption></figure>

## <img src="/files/MgVq4eilDqDLV3DK2ybd" alt="" data-size="line"> Maximize-or-Minimize <a href="#maximize-or-minimize" id="maximize-or-minimize"></a>

This function enables the adjustment of scanner size, allowing for both increases and decreases as needed.

Scanner maximizing button <img src="/files/MgVq4eilDqDLV3DK2ybd" alt="" data-size="line">

<figure><img src="/files/mMEaN2v3MBqLhZbe45o6" alt=""><figcaption></figcaption></figure>

Scanner minimizing button <img src="/files/toXR5tQ3EXOsSII5rAHK" alt="" data-size="line">

<figure><img src="/files/1WyRCebaDJtcngZtxwVC" alt=""><figcaption></figcaption></figure>

To hide the scanner, simply click on the splitter bar with the left mouse button.

<figure><img src="/files/ZzyhzHAgF4pMDLiqrPYf" alt=""><figcaption></figcaption></figure>

## <img src="/files/Kl0avelXJNZmkeFlqcqV" alt="" data-size="line"> Add Analyzer <a href="#add-analyzer" id="add-analyzer"></a>

This function allows adding Analyzer session column to Scanner.

In order to add Analyzer click on <img src="/files/Kl0avelXJNZmkeFlqcqV" alt="" data-size="line"> button.

<figure><img src="https://docs.agenatrader.com/~gitbook/image?url=https%3A%2F%2F2805764894-files.gitbook.io%2F%7E%2Ffiles%2Fv0%2Fb%2Fgitbook-legacy-files%2Fo%2Fassets%252F-MKZSsJBtSP9L4sqIe_q%252F-MPsIqOl_ECMugCN3DBX%252F-MPsPVY43sswg-Z0NgUz%252FAnalyzer%2520popup.png%3Falt%3Dmedia%26token%3D94062f46-9ccc-4fa8-99fe-772a6490be0e&#x26;width=768&#x26;dpr=4&#x26;quality=100&#x26;sign=e9a105d6&#x26;sv=1" alt=""><figcaption></figcaption></figure>

The Analyzer definitions popup allows you to input the following parameters:

* **Name**: Allows users to name the Analyzer session column header. This is particularly useful if multiple Analyzer session columns are in use. We recommend that you change the header text so that the signals and the corresponding time frame can be recognized immediately.
* **TimeFrame:** Please specify the time frame which signals should be scanned for;
* **Session:** Select between the available layers that have been determined in the Setup Builder as analyzer sessions.

{% hint style="info" %}
**Important!** Please find details about Analyzer on pages [**Setup Builder: Analyzer Column**](https://docs.agenatrader.com/create-your-own-trading-strategy/setup-escort#analyzer-escort-column) and [**Setup Builder: Analyzer sessions**](https://docs.agenatrader.com/create-your-own-trading-strategy/setup-escort#analyzer-sessions)
{% endhint %}

## <img src="/files/uJKe2k5CJY44bkCMOmJK" alt="" data-size="line"> Remove Analyzer <a href="#remove-analyzer" id="remove-analyzer"></a>

This function allows the user to remove Analyzer column from the Scanner.

Click on Remove Analyzer button and select column you want to delete from the list:

<figure><img src="https://docs.agenatrader.com/~gitbook/image?url=https%3A%2F%2F2805764894-files.gitbook.io%2F%7E%2Ffiles%2Fv0%2Fb%2Fgitbook-legacy-files%2Fo%2Fassets%252F-MKZSsJBtSP9L4sqIe_q%252F-MPsIqOl_ECMugCN3DBX%252F-MPsPtHotDygjGiJGaSa%252Fremove%2520analyzer.png%3Falt%3Dmedia%26token%3Dbc821ca2-b5eb-4a04-b31c-be8c013dcc97&#x26;width=768&#x26;dpr=4&#x26;quality=100&#x26;sign=dcce21a3&#x26;sv=1" alt=""><figcaption></figcaption></figure>

{% hint style="info" %}
**Important!** Please find details about Analyzer on pages [**Setup Builder: Analyzer Column**](https://docs.agenatrader.com/create-your-own-trading-strategy/setup-escort#analyzer-escort-column) and [**Setup Builder: Analyzer sessions**](https://docs.agenatrader.com/create-your-own-trading-strategy/setup-escort#analyzer-sessions)
{% endhint %}

## <img src="/files/LEpQsvw1GDdpElcTYAqA" alt="" data-size="line"> Edit Columns <a href="#edit-columns" id="edit-columns"></a>

Right-click on the scanner column and select the **Edit columns** option to access the scanner columns editor and manage column settings.

#### Scanner columns editor <a href="#scanner-columns-editor" id="scanner-columns-editor"></a>

The scanner columns editor lets you add, remove, or modify various columns for the scanner.

<figure><img src="https://docs.agenatrader.com/~gitbook/image?url=https%3A%2F%2F2805764894-files.gitbook.io%2F%7E%2Ffiles%2Fv0%2Fb%2Fgitbook-legacy-files%2Fo%2Fassets%252F-MKZSsJBtSP9L4sqIe_q%252F-MPsIqOl_ECMugCN3DBX%252F-MPsQpVznt_GeU2q6b2Q%252FEditColumn.png%3Falt%3Dmedia%26token%3D9a777c53-2df6-486f-804c-0acef6b775e6&#x26;width=768&#x26;dpr=4&#x26;quality=100&#x26;sign=f16fe408&#x26;sv=1" alt=""><figcaption></figcaption></figure>

The selection tree (top left) enables the insertion of various columns and offers the following options:

| Category            | Function                                                                                                           |
| ------------------- | ------------------------------------------------------------------------------------------------------------------ |
| Information         | Refers to the real time data such as bid, ask, time, volume etc.                                                   |
| Indicators          | Includes standard indicators                                                                                       |
| Conditions          | Includes complex signal combinations of indicators created within the Signal Builder                               |
| Scripted conditions | Includes self-programmed signals                                                                                   |
| Custom              | Includes self-programmed indicators                                                                                |
| AnalyzerColumn      | Shows the setups defined within the Setup Builder (only available in AgenaTrader++, Andromeda and higher versions) |
| Quick Chart         | Displays the last ticks for a specific instrument                                                                  |
| Pause               | Lets you stop current scanning for the selected value                                                              |

Double-clicking or clicking the **New** button will add components to the column list (bottom left). Left clicking the **Remove** button will remove them.

If you left click on a component from the column list, the parameter box (on the right side) will display the associated settings. Click the **Apply** button to apply the components and their settings to the scanner or the **OK** button to apply the components to the scanner and close the editor.

<figure><img src="https://docs.agenatrader.com/~gitbook/image?url=https%3A%2F%2F2805764894-files.gitbook.io%2F%7E%2Ffiles%2Fv0%2Fb%2Fgitbook-legacy-files%2Fo%2Fassets%252F-MKZSsJBtSP9L4sqIe_q%252F-MPsIqOl_ECMugCN3DBX%252F-MPsR49kDF2-YCi1LQA2%252FscannerEditColumns_Columns.png%3Falt%3Dmedia%26token%3D8bf9dcfe-a0d6-4247-9c65-d63881aa2551&#x26;width=768&#x26;dpr=4&#x26;quality=100&#x26;sign=cdedb400&#x26;sv=1" alt=""><figcaption></figcaption></figure>

If you wish to revert all unconfirmed changes and close the column editor window click the **Cancel** button.

#### Parameter box <a href="#parameter-box" id="parameter-box"></a>

The parameter box allows you to define different scanner (i.e. watch list) column parameters.

<figure><img src="https://docs.agenatrader.com/~gitbook/image?url=https%3A%2F%2F2805764894-files.gitbook.io%2F%7E%2Ffiles%2Fv0%2Fb%2Fgitbook-legacy-files%2Fo%2Fassets%252F-MKZSsJBtSP9L4sqIe_q%252F-MPsIqOl_ECMugCN3DBX%252F-MPsRDR9XrLeCsMaefck%252FEditColumn1.png%3Falt%3Dmedia%26token%3D60205d2c-48ae-499c-96b8-fb10ea277cab&#x26;width=768&#x26;dpr=4&#x26;quality=100&#x26;sign=9299d6ac&#x26;sv=1" alt=""><figcaption></figcaption></figure>

*Parameter settings are grouped by several categories:*

* **General:**
  * Indicator Name: symbol for the indicator.
  * Bars required: set the number of historical periods (bars) required for the indicator calculation.
  * Back color: background color of the column .
  * Font: font type.
  * Relative column width: column width changes.
  * Decimal places: number of decimal points.
  * Caption: column headings.
  * Input Price Type: data series (high, low, close, open) for calculation of a component .
  * Calculate On Bar Close: if set to "true" then the component will be calculated upon closing of each bar (period).&#x20;

{% hint style="warning" %}
**Warning! If "CalculateOnBarClose" is set to 'false' then re-calculation will occur on every tick. This can result in speed (performance) problems for the entire application!**
{% endhint %}

* Time frame:
  * Periodicity: defines the interval type (seconds, minutes, hours, days, weeks, months, etc)
  * Value: defines the length of the interval (e.g. 5 min.).
* Vertical grid lines: applicable for the chart but not for the scanner.
* Displacement: applicable for the chart but not for the scanner.
* **Input & Output:**
  * Input: only pertains to the data series based on which the indicator is calculated. The standard setting is "close", i.e. the indicator will be calculated based on the closing prices of the corresponding period.
  * Series or Output Value: allows you to assign e.g. either the "D" or "K" value for stochastic indicators displayed in the scanner column.
* **Parameters:** displays specific indicator settings. Please view the corresponding indicator description for more information.
* **Ranges:** shows relevant threshold values (upper, lower, zero lines) for the oscillators.
  * Lower: this is usually the line that refers to the indicators in the oversold position.
  * Upper: this is usually the line that refers to the indicators in the overbought position.
  * Zero line: some indicators bounce around the zero line in a positive/negative area.
* **Special:** allows you to perform very simple scanning for indicators.
  * Cross Above Upper: crosses the upper line from below
  * Is Above Upper: the oscillator is above the upper line
  * Cross Below Upper: crosses the upper line from above (can sometimes be considered a "bear" signal)
  * Cross Below Lower: crosses the lower line from above
  * Is Below Lower: the oscillator is below the lower line
  * Cross Above Lower: crosses the lower line from below (can sometimes be considered a "bull" signal)
  * Is Above: the zero line oscillator is above the zero line
  * Cross Above: the zero line is crossed bottom-up
  * Cross Below: the zero line is crossed top-down
  * Is Below: the zero line oscillator is below the zero line

Despite the fact that some indicators displayed on the chart (SMA, EMA) do not have threshold values, you may still input the same scanning criteria for them as for zero line oscillators. The indicator line will then be viewed as the zero line and a price will represent the oscillating value.&#x20;

The image below illustrates this: The color red has been selected for the Bollinger ribbon indicator for the **Is Above Upper** option. As soon as the closing price of the currency pairs crosses above the upper Bollinger ribbon, the corresponding instrument cells will turn red.

<figure><img src="https://docs.agenatrader.com/~gitbook/image?url=https%3A%2F%2F2805764894-files.gitbook.io%2F%7E%2Ffiles%2Fv0%2Fb%2Fgitbook-legacy-files%2Fo%2Fassets%252F-MKZSsJBtSP9L4sqIe_q%252F-MPsIqOl_ECMugCN3DBX%252F-MPsRNWgIzpZvIIk55qB%252FColumns.png%3Falt%3Dmedia%26token%3Dd16f0808-4960-418e-b9ad-f666fa0f976c&#x26;width=768&#x26;dpr=4&#x26;quality=100&#x26;sign=4dc244f9&#x26;sv=1" alt=""><figcaption></figcaption></figure>

### Open Linked Chart or Chartgroup <a href="#open-linked-chart-or-chartgroup" id="open-linked-chart-or-chartgroup"></a>

Select the **Open linked chart** menu item to open the chart dialog and create a [single chart](https://docs.agenatrader.com/main/chart-area/chart-container/chart-container#single-chart).

After defining all parameters, click the **OK** button to confirm them.

<figure><img src="https://docs.agenatrader.com/~gitbook/image?url=https%3A%2F%2F2805764894-files.gitbook.io%2F%7E%2Ffiles%2Fv0%2Fb%2Fgitbook-legacy-files%2Fo%2Fassets%252F-MKZSsJBtSP9L4sqIe_q%252F-MPsIqOl_ECMugCN3DBX%252F-MPsRYXqa0Gtj37Jli-M%252FscannerLinkedChart.png%3Falt%3Dmedia%26token%3Ddc54b673-2c74-4c13-8943-5c2f04307835&#x26;width=768&#x26;dpr=4&#x26;quality=100&#x26;sign=7c54400&#x26;sv=1" alt=""><figcaption></figcaption></figure>

## <img src="/files/suLXsQVzXIZoAnEepbRk" alt="" data-size="line"> Show Fundamentals from Yahoo <a href="#show-fundamentals-from-yahoo" id="show-fundamentals-from-yahoo"></a>

This feature provides access to Instrument News from Yahoo Finance website without needing to open a browser.

To access **Show Fundamentals from Yahoo** click on button<img src="/files/2PIc9xM3WqAZctI4pHSS" alt="" data-size="line">,

Open tab automatically searches news about the instrument you use. In addition, the user can navigate through the Yahoo finance pages without using the browser.

<figure><img src="https://docs.agenatrader.com/~gitbook/image?url=https%3A%2F%2F2805764894-files.gitbook.io%2F%7E%2Ffiles%2Fv0%2Fb%2Fgitbook-legacy-files%2Fo%2Fassets%252F-MKZSsJBtSP9L4sqIe_q%252F-MPsIqOl_ECMugCN3DBX%252F-MPsRfy5WrB-Z4caJZ63%252FYahoo%2520page.png%3Falt%3Dmedia%26token%3Da7ff499c-758b-4be6-ad47-0e26badc58ae&#x26;width=768&#x26;dpr=4&#x26;quality=100&#x26;sign=ced7d314&#x26;sv=1" alt=""><figcaption></figcaption></figure>

## <img src="/files/As0Xqgm4IWaKxoZqnaPk" alt="" data-size="line"> Start strategy <a href="#start-strategy" id="start-strategy"></a>

The scanner context menu allows you to start a strategy for selected instruments. To do so, right click on one or multiple market rows and choose the **Start Strategy** menu item.

<figure><img src="https://docs.agenatrader.com/~gitbook/image?url=https%3A%2F%2F2805764894-files.gitbook.io%2F%7E%2Ffiles%2Fv0%2Fb%2Fgitbook-legacy-files%2Fo%2Fassets%252F-MKZSsJBtSP9L4sqIe_q%252F-MPsIqOl_ECMugCN3DBX%252F-MPsRkk3BXO8__ReXbZY%252FscannerStartStrategy.png%3Falt%3Dmedia%26token%3D266336f7-209c-412f-be6d-93d655d5700a&#x26;width=768&#x26;dpr=4&#x26;quality=100&#x26;sign=f4b135d2&#x26;sv=1" alt=""><figcaption></figcaption></figure>

Once selected, the following strategies dialog window will appear:

<figure><img src="https://docs.agenatrader.com/~gitbook/image?url=https%3A%2F%2F2805764894-files.gitbook.io%2F%7E%2Ffiles%2Fv0%2Fb%2Fgitbook-legacy-files%2Fo%2Fassets%252F-MKZSsJBtSP9L4sqIe_q%252F-MPsIqOl_ECMugCN3DBX%252F-MPsRp8RrfVw8n0_5A-v%252FStrategies.png%3Falt%3Dmedia%26token%3Dd6c0e03f-7a84-4a66-9b06-a7394fce3c55&#x26;width=768&#x26;dpr=4&#x26;quality=100&#x26;sign=37977058&#x26;sv=1" alt=""><figcaption></figcaption></figure>

Select the desired strategy within this dialog and click either the **OK** or the **Apply** button. You can find the list of active strategies in the [**Strategy manager**](https://docs.agenatrader.com/create-your-own-trading-strategy/strategy-escort#Strategy_Escort_tab) tab.

Further information is available in the [Chart Toolbar: Strategies](https://docs.agenatrader.com/main/chart-area/untitled/strategies) section.

## <img src="/files/NCGfr1PcqPpK6zwshYC1" alt="" data-size="line"><img src="/files/tSselCLGFeaQYrpQ3uNO" alt="" data-size="line"> Add or remove instrument(s) <a href="#scanner_context_menu__add_or_remove_instrument_s" id="scanner_context_menu__add_or_remove_instrument_s"></a>

#### <img src="/files/NCGfr1PcqPpK6zwshYC1" alt="" data-size="line">  Add instruments <a href="#add-instruments" id="add-instruments"></a>

Left click the **Add Instruments** menu item to open the **Instrument Editor** popup and select an instrument list or single instrument. The chosen instrument list or instrument will be attached to already existing instruments within the scanner.

If the selected list contains instruments already included in the scanner, these instruments will be ignored, since duplicate entries cannot be created.

<figure><img src="https://docs.agenatrader.com/~gitbook/image?url=https%3A%2F%2F2805764894-files.gitbook.io%2F%7E%2Ffiles%2Fv0%2Fb%2Fgitbook-legacy-files%2Fo%2Fassets%252F-MKZSsJBtSP9L4sqIe_q%252F-MPsIqOl_ECMugCN3DBX%252F-MPsRtNoolbn0UPqiaFm%252FAddSymbol.png%3Falt%3Dmedia%26token%3D5bef093a-4f07-4eff-951c-0182bc91d71d&#x26;width=768&#x26;dpr=4&#x26;quality=100&#x26;sign=1e8296fa&#x26;sv=1" alt=""><figcaption></figcaption></figure>

#### <img src="/files/tSselCLGFeaQYrpQ3uNO" alt="" data-size="line"> Remove instrument <a href="#remove-instrument" id="remove-instrument"></a>

In order to delete an instrument from the scanner:

* Select a row with the instrument name,f
* right click on it to open the context menu (the row will be highlighted in blue),
* select the **Remove instrument** option.

#### <img src="/files/dQakTy3POKUlioO7ODdN" alt="" data-size="line"> Remove all instruments <a href="#remove-all-instruments" id="remove-all-instruments"></a>

* Select any row with the instrument name,
* right click to open the context menu,
* select the **Remove all instruments** option.

## <img src="/files/kXOmpq3rVdd8dA8ANl5w" alt="" data-size="line"> Copy to instrument list <a href="#copy-to-instrument-list" id="copy-to-instrument-list"></a>

The context menu option **Copy to Instrument List** offers two possibilities:

**Instrument Lists**: Displays all available instrument lists in the submenu. Here, you can select the list to which the instrument should be copied.

<figure><img src="https://docs.agenatrader.com/~gitbook/image?url=https%3A%2F%2F2805764894-files.gitbook.io%2F%7E%2Ffiles%2Fv0%2Fb%2Fgitbook-legacy-files%2Fo%2Fassets%252F-MKZSsJBtSP9L4sqIe_q%252F-MPsIqOl_ECMugCN3DBX%252F-MPsRy_kLo0j7BEC9DdM%252FCopyToInstrument.png%3Falt%3Dmedia%26token%3D02f4c915-dee1-4ad8-b61c-043f364326e4&#x26;width=768&#x26;dpr=4&#x26;quality=100&#x26;sign=a2561079&#x26;sv=1" alt=""><figcaption></figcaption></figure>

* *New*: opens the **Instrument Editor** and creates a \<New List> for selected multiple rows in the scanner. If only one row is selected, all instruments will be placed into the \<New List> within the **Instrument Editor**.

<figure><img src="https://docs.agenatrader.com/~gitbook/image?url=https%3A%2F%2F2805764894-files.gitbook.io%2F%7E%2Ffiles%2Fv0%2Fb%2Fgitbook-legacy-files%2Fo%2Fassets%252F-MKZSsJBtSP9L4sqIe_q%252F-MPsIqOl_ECMugCN3DBX%252F-MPsS1Ibgk9yAL9pso6g%252FCreateInstrList.png%3Falt%3Dmedia%26token%3Decd3fe25-068c-4cb4-b741-ec70abdb63b8&#x26;width=768&#x26;dpr=4&#x26;quality=100&#x26;sign=71f60b75&#x26;sv=1" alt=""><figcaption></figcaption></figure>

## <img src="/files/Jk7uGiuy29vIoUsMxr5x" alt="" data-size="line"> Reload instrument lists <a href="#reload-instrument-lists" id="reload-instrument-lists"></a>

It is necessary to distinguish between scanner lists and instrument lists. If you add a new instrument to an instrument list via Instrument editor, it will not automatically be displayed in the scanner. You will only be able to see it after reloading the scanner.

AgenaTrader allows you to reload multiple instrument lists using the **Reload Instrument Lists** option in the context menu. After reloading, current information will be saved to the appropriate scanner.

This option makes the most sense when you need to fetch the current values for a static, dynamic instrument list or one of the **Preset scanner lists**. In addition **Authomatically Reload Instruments Lists** function allows you to reload instrument list authomatically.

<figure><img src="https://docs.agenatrader.com/~gitbook/image?url=https%3A%2F%2F2805764894-files.gitbook.io%2F%7E%2Ffiles%2Fv0%2Fb%2Fgitbook-legacy-files%2Fo%2Fassets%252F-MKZSsJBtSP9L4sqIe_q%252F-MPsIqOl_ECMugCN3DBX%252F-MPsS5IJf0XeeSHBaonh%252FReloadInstList.png%3Falt%3Dmedia%26token%3Dae0e3dad-449d-4f40-a4ed-f69d88adf890&#x26;width=768&#x26;dpr=4&#x26;quality=100&#x26;sign=32df547f&#x26;sv=1" alt=""><figcaption></figcaption></figure>

## <img src="/files/3llUlf3HchmCvBL752xv" alt="" data-size="line"> Move to next expiry (Futures only) <a href="#scanner_context_menu__move_to_next_expire__futures_only" id="scanner_context_menu__move_to_next_expire__futures_only"></a>

This menu function only becomes available for the futures contract.

The function allows the user to move expiration date of a futures contract in ascending order. You can find additional information about expiry function in [Instrument Editor: Futures contract rollover](https://docs.agenatrader.com/tools/instrument-escort#Instrument_Escort__Futures_contract_rollover)

<figure><img src="https://docs.agenatrader.com/~gitbook/image?url=https%3A%2F%2F2805764894-files.gitbook.io%2F%7E%2Ffiles%2Fv0%2Fb%2Fgitbook-legacy-files%2Fo%2Fassets%252F-MKZSsJBtSP9L4sqIe_q%252F-MPsIqOl_ECMugCN3DBX%252F-MPsS8zPH_VSSy0-sfyi%252FMove%2520to%2520next%2520expiry.png%3Falt%3Dmedia%26token%3D54a4f9f5-dc3e-4253-809c-4dc957bbc11a&#x26;width=768&#x26;dpr=4&#x26;quality=100&#x26;sign=4df8f3ee&#x26;sv=1" alt=""><figcaption></figcaption></figure>

## <img src="/files/vxnWZiv0n2KLISydHS7M" alt="" data-size="line">  Assign AnalyzerSession <a href="#assign-analyzersession" id="assign-analyzersession"></a>

The [**Assign Analyzer session**](https://docs.agenatrader.com/create-your-own-trading-strategy/setup-escort#analyzer-sessions) menu function only becomes available when at least one [Analyzer Column column](https://docs.agenatrader.com/create-your-own-trading-strategy/setup-escort#analyzer-escort-column) is attached to the scanner.

Right click in this column to bring up the context menu, then choose between the available layers determined by you as analyzer sessions in the **Setup Builder**.

<figure><img src="https://docs.agenatrader.com/~gitbook/image?url=https%3A%2F%2F2805764894-files.gitbook.io%2F%7E%2Ffiles%2Fv0%2Fb%2Fgitbook-legacy-files%2Fo%2Fassets%252F-MKZSsJBtSP9L4sqIe_q%252F-MPsIqOl_ECMugCN3DBX%252F-MPsSCz1nC4LOTe6P0P6%252FAssignAnalyzerSession.png%3Falt%3Dmedia%26token%3Dab68c524-c31d-45c7-aa21-579b7ead1c01&#x26;width=768&#x26;dpr=4&#x26;quality=100&#x26;sign=84086513&#x26;sv=1" alt=""><figcaption></figcaption></figure>

## <img src="/files/Tvt9PYLcbI4IpovJXIsG" alt="" data-size="line"> Signal Direction <a href="#signal-direction" id="signal-direction"></a>

The **Signal Direction** menu function only becomes available when at least one [Setup Builder: Analyzer Column](https://docs.agenatrader.com/create-your-own-trading-strategy/setup-escort#analyzer-escort-column) is attached to the scanner.

Right-click in this column to bring up the context menu, then choose between Signal directions you want to display in Analyzer Column column.

<figure><img src="https://docs.agenatrader.com/~gitbook/image?url=https%3A%2F%2F2805764894-files.gitbook.io%2F%7E%2Ffiles%2Fv0%2Fb%2Fgitbook-legacy-files%2Fo%2Fassets%252F-MKZSsJBtSP9L4sqIe_q%252F-MPsIqOl_ECMugCN3DBX%252F-MPsSJMKVVmKhQNah-1I%252FSignalDirections.png%3Falt%3Dmedia%26token%3Db57d2394-c7d2-4db9-ab59-99a1389c02ee&#x26;width=768&#x26;dpr=4&#x26;quality=100&#x26;sign=15b9ac04&#x26;sv=1" alt=""><figcaption></figcaption></figure>

* **Both Directions:** Analyzer Column column would display both direction signals.
* **Long Only:** Analyzer Column column would display only long direction signals.
* **Short Only:** Analyzer Column column would display only short direction signals.

## <img src="/files/T55QwyFb0kefqw2l0FSg" alt="" data-size="line"> Sort interval <a href="#sort-interval" id="sort-interval"></a>

The sort interval function allows you to define how often AgenaTrader will automatically sort your signals in the Analyzer Column columns. In order to tell AgenaTrader how you want these signals sorted, you must initially manually sort the Analyzer Column column as you wish to have it by clicking the title bar. You only need to carry this out once, but this function will not work if you do not sort the column manually first.

Now proceed to left click the title bar of the column that you wish to sort, and the **Sort Interval** function will become available.

![](https://docs.agenatrader.com/~gitbook/image?url=https%3A%2F%2F2805764894-files.gitbook.io%2F%7E%2Ffiles%2Fv0%2Fb%2Fgitbook-legacy-files%2Fo%2Fassets%252F-MKZSsJBtSP9L4sqIe_q%252F-MPsIqOl_ECMugCN3DBX%252F-MPsSR6veyq-fKY3AwzZ%252FsortInterval.png%3Falt%3Dmedia%26token%3D4d62905a-fec3-4f81-bc5d-213a48991521\&width=768\&dpr=4\&quality=100\&sign=89dc41af\&sv=1)![](https://docs.agenatrader.com/~gitbook/image?url=https%3A%2F%2F2805764894-files.gitbook.io%2F%7E%2Ffiles%2Fv0%2Fb%2Fgitbook-legacy-files%2Fo%2Fassets%252F-MKZSsJBtSP9L4sqIe_q%252F-MPsIqOl_ECMugCN3DBX%252F-MPsSV6IYDd6d1-G1nrV%252FscannerSortIntervalSettings.png%3Falt%3Dmedia%26token%3D798705f3-141d-47d0-bb8c-5cce63768593\&width=768\&dpr=4\&quality=100\&sign=8dd27db2\&sv=1)

Enter the time interval in seconds by which you wish to sort the selected column. For example, a 5 sec. interval means that sorting will take place every 5 seconds.

## <img src="/files/IwkAXlvnkdoPchkCczDL" alt="" data-size="line"> Enable Sound Alerts <a href="#enable-sound-alerts" id="enable-sound-alerts"></a>

This functionality makes it possible for you to be notified of signals or events that occur. When you activate (or deactivate) the **Enable Sound Alerts** option, it will be applied to the entire watch list or list chart group.

To assign a sound to specific entry signals, select **Setup Builder -> Parameter tab-> Choose entry escort from the list-> SignalSound.**

Please find details [here](https://docs.agenatrader.com/create-your-own-trading-strategy/setup-escort#entryescorts)

You can also customize sound settings not only for specific indicators but also for the **Analyzer Column columns**.

**Example. Indicators**

Right click within the scanner/list chart group to access the context menu, then select the **Edit columns** option.

<figure><img src="https://docs.agenatrader.com/~gitbook/image?url=https%3A%2F%2F2805764894-files.gitbook.io%2F%7E%2Ffiles%2Fv0%2Fb%2Fgitbook-legacy-files%2Fo%2Fassets%252F-MKZSsJBtSP9L4sqIe_q%252F-MPsIqOl_ECMugCN3DBX%252F-MPsSezN536lWPS9a3hC%252FsortInterval%2520%281%29.png%3Falt%3Dmedia%26token%3Da74cfea3-c7ac-4c64-b456-fb4d7a9d7a5c&#x26;width=768&#x26;dpr=4&#x26;quality=100&#x26;sign=ddd19ee2&#x26;sv=1" alt=""><figcaption></figcaption></figure>

For indicators such as Bollinger bands you can set the sound in the special section. The image below shows how you can manage different crossovers between the price and the indicator.

<figure><img src="https://docs.agenatrader.com/~gitbook/image?url=https%3A%2F%2F2805764894-files.gitbook.io%2F%7E%2Ffiles%2Fv0%2Fb%2Fgitbook-legacy-files%2Fo%2Fassets%252F-MKZSsJBtSP9L4sqIe_q%252F-MPsIqOl_ECMugCN3DBX%252F-MPsSj5D3F3t6r3HoyOl%252FColumns%2520%281%29.png%3Falt%3Dmedia%26token%3D13f313b0-8e0b-43cc-a491-b8c9c4da0b99&#x26;width=768&#x26;dpr=4&#x26;quality=100&#x26;sign=dfdb0263&#x26;sv=1" alt=""><figcaption></figcaption></figure>

## <img src="/files/HRRwCwESjbfaIiCOU7R3" alt="" data-size="line"> Export to MS Excel <a href="#export-to-ms-excel" id="export-to-ms-excel"></a>

Selecting the Export to MS Excel option from the context menu will export the scanner list into a CSV file.

## <img src="/files/SsFRhKrAEXTFkt0fMPbp" alt="" data-size="line"> Scanner Templates <a href="#scanner-templates" id="scanner-templates"></a>

AgenaTrader allows you to apply the saved settings to a new scanner using scanner templates.

When saving a scanner template, the following settings will be stored:

* columns inside the chart
* your current settings (background color, indicator parameters, etc.)

However, the list of instruments from the scanner will not be saved.

<figure><img src="https://docs.agenatrader.com/~gitbook/image?url=https%3A%2F%2F2805764894-files.gitbook.io%2F%7E%2Ffiles%2Fv0%2Fb%2Fgitbook-legacy-files%2Fo%2Fassets%252F-MKZSsJBtSP9L4sqIe_q%252F-MPsIqOl_ECMugCN3DBX%252F-MPsSnEdnvhnBZXAeqUs%252Fscanner_template.png%3Falt%3Dmedia%26token%3D57d89a57-c64f-4458-8467-4c622f279e9a&#x26;width=768&#x26;dpr=4&#x26;quality=100&#x26;sign=fbc58270&#x26;sv=1" alt=""><figcaption></figcaption></figure>

To load a scanner template, right click on a scanner column and then select the **Scanner Templates -> Load** submenu.

<figure><img src="https://docs.agenatrader.com/~gitbook/image?url=https%3A%2F%2F2805764894-files.gitbook.io%2F%7E%2Ffiles%2Fv0%2Fb%2Fgitbook-legacy-files%2Fo%2Fassets%252F-MKZSsJBtSP9L4sqIe_q%252F-MPsIqOl_ECMugCN3DBX%252F-MPsSrMCmjfYMOWpJuE0%252Fscanner_templates.png%3Falt%3Dmedia%26token%3D569c708a-c1fd-423d-a47a-f696a4c7d1bd&#x26;width=768&#x26;dpr=4&#x26;quality=100&#x26;sign=26f9f99d&#x26;sv=1" alt=""><figcaption></figcaption></figure>

Once selected, the following popup window will appear:

<figure><img src="https://docs.agenatrader.com/~gitbook/image?url=https%3A%2F%2F2805764894-files.gitbook.io%2F%7E%2Ffiles%2Fv0%2Fb%2Fgitbook-legacy-files%2Fo%2Fassets%252F-MKZSsJBtSP9L4sqIe_q%252F-MPsIqOl_ECMugCN3DBX%252F-MPsSvbtwXbryb-KwaiU%252Fselect%2520template.png%3Falt%3Dmedia%26token%3Dd7d2dfcb-72f3-4b39-b1b8-05877069e7bb&#x26;width=768&#x26;dpr=4&#x26;quality=100&#x26;sign=acf5a1a4&#x26;sv=1" alt=""><figcaption></figcaption></figure>

You can select available templates from the drop-down list.

## <img src="/files/qhJA2pBYTwwnMoaLoMKF" alt="" data-size="line"> Reload <a href="#reload-1" id="reload-1"></a>

Agenatrader allows you to reload whole scanner or the single column: **Reload** and **Reload 'field\_name'**

<figure><img src="https://docs.agenatrader.com/~gitbook/image?url=https%3A%2F%2F2805764894-files.gitbook.io%2F%7E%2Ffiles%2Fv0%2Fb%2Fgitbook-legacy-files%2Fo%2Fassets%252F-MKZSsJBtSP9L4sqIe_q%252F-MPsIqOl_ECMugCN3DBX%252F-MPsT-OBK5c8j9mc3TE3%252Fscanner_reload%2520%281%29.png%3Falt%3Dmedia%26token%3Db506aeed-67a9-4108-ae3b-b476b5e35e58&#x26;width=768&#x26;dpr=4&#x26;quality=100&#x26;sign=74b6e711&#x26;sv=1" alt=""><figcaption></figcaption></figure>

Enter <img src="/files/VTZmgHV4UljYYmzoCxYY" alt="" data-size="line"> **Set Refresh Interval** in milliseconds up to 10000 by which you wish to refresh scanner columns (Ask/Bid, etc):

<figure><img src="https://docs.agenatrader.com/~gitbook/image?url=https%3A%2F%2F2805764894-files.gitbook.io%2F%7E%2Ffiles%2Fv0%2Fb%2Fgitbook-legacy-files%2Fo%2Fassets%252F-MKZSsJBtSP9L4sqIe_q%252F-MPsIqOl_ECMugCN3DBX%252F-MPsT3Ox5PPtKzYKl4Tb%252Fscanner_refreshrate%2520%281%29.png%3Falt%3Dmedia%26token%3Df1ca1355-cab6-4c1e-abf9-2aef33092cb4&#x26;width=768&#x26;dpr=4&#x26;quality=100&#x26;sign=eabdebf4&#x26;sv=1" alt=""><figcaption></figcaption></figure>

In addition, the user can edit self-scripted indicators and conditions (they should be added to the scanner columns ) through the context menu by using **Edit** function:

<figure><img src="https://docs.agenatrader.com/~gitbook/image?url=https%3A%2F%2F2805764894-files.gitbook.io%2F%7E%2Ffiles%2Fv0%2Fb%2Fgitbook-legacy-files%2Fo%2Fassets%252F-MKZSsJBtSP9L4sqIe_q%252F-MPsIqOl_ECMugCN3DBX%252F-MPsT9X57UI00jAGjwne%252FEdit%2520%281%29.png%3Falt%3Dmedia%26token%3D638e6852-b916-4506-a752-cd6a5f7ccd90&#x26;width=768&#x26;dpr=4&#x26;quality=100&#x26;sign=301970db&#x26;sv=1" alt=""><figcaption></figcaption></figure>

## Scanner for a list chart group <a href="#scanner-for-a-list-chart-group" id="scanner-for-a-list-chart-group"></a>

The scanner for a list chart group is linked to the associated charts. This means that charts will be created and displayed in correspondence with entries made in scanner.

<figure><img src="https://docs.agenatrader.com/~gitbook/image?url=https%3A%2F%2F2805764894-files.gitbook.io%2F%7E%2Ffiles%2Fv0%2Fb%2Fgitbook-legacy-files%2Fo%2Fassets%252F-MKZSsJBtSP9L4sqIe_q%252F-MPsIqOl_ECMugCN3DBX%252F-MPsTFFTc9-2gqKzjZpI%252Fscanner%2520%281%29.png%3Falt%3Dmedia%26token%3Dc3fc9b26-dc85-4be8-bf58-0325c141ed4a&#x26;width=768&#x26;dpr=4&#x26;quality=100&#x26;sign=f4123708&#x26;sv=1" alt=""><figcaption></figcaption></figure>

*The scanner context menu allows the following entry possibilities:*

* <img src="/files/v1UkEhHrpOXxprrDctUF" alt="" data-size="line"> Save/Print: [prints](https://docs.agenatrader.com/main/chart-area/untitled/print) or [saves](https://docs.agenatrader.com/main/chart-area/untitled/saving-as-image) the chart group of the instrument currently selected or in use.
* <img src="/files/MPVWepsDr9vxHYyWcwTE" alt="" data-size="line">Chart Group: contains the following range of [functions](https://docs.agenatrader.com/main/chart-area/chart-container/chart-container#Chart_Container__List_Chart_Group):

<figure><img src="https://docs.agenatrader.com/~gitbook/image?url=https%3A%2F%2F2805764894-files.gitbook.io%2F%7E%2Ffiles%2Fv0%2Fb%2Fgitbook-legacy-files%2Fo%2Fassets%252F-MKZSsJBtSP9L4sqIe_q%252F-MPsIqOl_ECMugCN3DBX%252F-MPsTKAXqw5Iq_dnrOoG%252Fscanner-LCG1.png%3Falt%3Dmedia%26token%3D46c170e5-bf2f-44fc-980d-a5732b95bdd7&#x26;width=768&#x26;dpr=4&#x26;quality=100&#x26;sign=a3123e5e&#x26;sv=1" alt=""><figcaption></figcaption></figure>

* <img src="/files/52bNv0uSf8hJUj6mht0M" alt="" data-size="line">Mark Item: allows you to mark/color a symbol.

<figure><img src="https://docs.agenatrader.com/~gitbook/image?url=https%3A%2F%2F2805764894-files.gitbook.io%2F%7E%2Ffiles%2Fv0%2Fb%2Fgitbook-legacy-files%2Fo%2Fassets%252F-MKZSsJBtSP9L4sqIe_q%252F-MPsIqOl_ECMugCN3DBX%252F-MPsTOPqjrSEzz9n4Yma%252Fscanner-LCG2.png%3Falt%3Dmedia%26token%3D4723c72b-6b0a-49df-9499-bea3af478ba0&#x26;width=768&#x26;dpr=4&#x26;quality=100&#x26;sign=7b0699b1&#x26;sv=1" alt=""><figcaption></figcaption></figure>

* <img src="/files/rCJltD0nOQcu4WpUyJpr" alt="" data-size="line">Reset Marked Item: here you can undo a symbol's marking.

<figure><img src="https://docs.agenatrader.com/~gitbook/image?url=https%3A%2F%2F2805764894-files.gitbook.io%2F%7E%2Ffiles%2Fv0%2Fb%2Fgitbook-legacy-files%2Fo%2Fassets%252F-MKZSsJBtSP9L4sqIe_q%252F-MPsIqOl_ECMugCN3DBX%252F-MPsTTje3k1UHBWgCtka%252FResetMarked.png%3Falt%3Dmedia%26token%3Dd7590a1a-f4b2-4db7-9c73-7b2b1a0fd6b5&#x26;width=768&#x26;dpr=4&#x26;quality=100&#x26;sign=3a6f4d59&#x26;sv=1" alt=""><figcaption></figcaption></figure>


# OrderStream

## <img src="/files/NSYR44WTjNqzOZacAAkV" alt="" data-size="line"> OrderStream Suite Documentation <a href="#orderstream_suite_documentation" id="orderstream_suite_documentation"></a>

OrderStream charts are a multidimensional type of candlestick charts that can provide a trader with additional variables and information for technical analysis in the form of different volume numbers, beyond the pure price. These volume figures make it much easier to see where the market has larger or smaller volumes, which ultimately means at what price levels much or less money has flowed into the market and at what prices the 'big money' has bought or sold.

<figure><img src="https://docs.agenatrader.com/~gitbook/image?url=https%3A%2F%2F2805764894-files.gitbook.io%2F%7E%2Ffiles%2Fv0%2Fb%2Fgitbook-legacy-files%2Fo%2Fassets%252F-MKZSsJBtSP9L4sqIe_q%252F-MPnYEEKnqA3r9gakiuF%252F-MPnsWFSdVPQwffFmzc9%252F1.png%3Falt%3Dmedia%26token%3D5d357eba-db76-4faa-857e-6abeee8903a7&#x26;width=768&#x26;dpr=4&#x26;quality=100&#x26;sign=742c2936&#x26;sv=1" alt=""><figcaption></figcaption></figure>

The order stream suite offers on the one hand

* The chart in which the OrderStream-Bars are displayed with the Ask-Bid information of the respective OrderStream-BarTypes.
* The OrderStream-Cells and OrderStreamLines indicators
* The OrderStream Pad, which can be used to control the bar types and the two indicators.

Order streaming is started via the OrderStream entry in the PriceStyle menu.

<figure><img src="https://docs.agenatrader.com/~gitbook/image?url=https%3A%2F%2F2805764894-files.gitbook.io%2F%7E%2Ffiles%2Fv0%2Fb%2Fgitbook-legacy-files%2Fo%2Fassets%252F-MKZSsJBtSP9L4sqIe_q%252F-MPnYEEKnqA3r9gakiuF%252F-MPnsedu11TmN-UVFIkE%252F2.png%3Falt%3Dmedia%26token%3D8b899abb-842f-42ba-83ad-5be8d68b6bd9&#x26;width=768&#x26;dpr=4&#x26;quality=100&#x26;sign=1bed6d13&#x26;sv=1" alt=""><figcaption></figcaption></figure>

Use the OrderStream button in the action bar to open or close the OrderStream pad.

<figure><img src="https://docs.agenatrader.com/~gitbook/image?url=https%3A%2F%2F2805764894-files.gitbook.io%2F%7E%2Ffiles%2Fv0%2Fb%2Fgitbook-legacy-files%2Fo%2Fassets%252F-MKZSsJBtSP9L4sqIe_q%252F-MPnYEEKnqA3r9gakiuF%252F-MPnsqvmBw3hXJo01kG7%252F3.png%3Falt%3Dmedia%26token%3D3f359a0d-b799-45f4-ad97-f37fb71e6f06&#x26;width=768&#x26;dpr=4&#x26;quality=100&#x26;sign=9ac2d2c5&#x26;sv=1" alt=""><figcaption></figcaption></figure>

#### OrderStream Bars <a href="#orderstream_bars" id="orderstream_bars"></a>

<figure><img src="https://docs.agenatrader.com/~gitbook/image?url=https%3A%2F%2F2805764894-files.gitbook.io%2F%7E%2Ffiles%2Fv0%2Fb%2Fgitbook-legacy-files%2Fo%2Fassets%252F-MKZSsJBtSP9L4sqIe_q%252F-MPnYEEKnqA3r9gakiuF%252F-MPnsvhZLWzjLRXtEwzC%252F4.png%3Falt%3Dmedia%26token%3D45a8a96a-c2a2-458c-9924-f2e59956bdef&#x26;width=768&#x26;dpr=4&#x26;quality=100&#x26;sign=72a925c5&#x26;sv=1" alt=""><figcaption></figcaption></figure>

The OrderStream-Bars can be displayed for all

* Time Based time units.
  * i.e. 1 sec, 1 min, 5 min, 15 min, 1 hr, 4 hr.....
  * However, volume trading only makes sense with subordinate time units.
  * Some data feeds have problems displaying price levels greater than 30 minutes.
* The following Non Time Based charts are supported:
  * TickBars
  * RangeBars
  * VolumeBars
  * NTB's like Kagi, Renko, P\&F etc. cannot be supported.

On the left side you see the volume traded at the bid, the right side shows the volume at the ask.

<figure><img src="https://docs.agenatrader.com/~gitbook/image?url=https%3A%2F%2F2805764894-files.gitbook.io%2F%7E%2Ffiles%2Fv0%2Fb%2Fgitbook-legacy-files%2Fo%2Fassets%252F-MKZSsJBtSP9L4sqIe_q%252F-MPnYEEKnqA3r9gakiuF%252F-MPntJ6LwaxhBHmvazm0%252F5.png%3Falt%3Dmedia%26token%3D0d934cd3-1738-4801-8e12-a2d484477104&#x26;width=768&#x26;dpr=4&#x26;quality=100&#x26;sign=c1f66eeb&#x26;sv=1" alt=""><figcaption></figcaption></figure>

The highlighted font shows the highest bid or ask volume within the candle.

The highlighted cells show where the highest volumes in the long or short direction have taken place within the complete data series loaded into the chart.

The more intense the background color, the higher the traded volume in the respective direction within the analysis area.

#### OrderStream BarTypes <a href="#orderstream_bartypes" id="orderstream_bartypes"></a>

The different OrderStream bar types can be selected in the OrderStream pad:

<figure><img src="https://docs.agenatrader.com/~gitbook/image?url=https%3A%2F%2F2805764894-files.gitbook.io%2F%7E%2Ffiles%2Fv0%2Fb%2Fgitbook-legacy-files%2Fo%2Fassets%252F-MKZSsJBtSP9L4sqIe_q%252F-MPnYEEKnqA3r9gakiuF%252F-MPntOlFSwTlqQCmWB2h%252F6.png%3Falt%3Dmedia%26token%3Dbd9a27b3-eb34-4c03-9f99-042ef3309cca&#x26;width=768&#x26;dpr=4&#x26;quality=100&#x26;sign=62535cf7&#x26;sv=1" alt=""><figcaption></figcaption></figure>

* **AskBidVolume:** This is the most frequently used display form of the order stream chart. The AskBid-Volume is the actual volume traded on the ask or bid in the current time period at this price level. This volume comes from the Times\&Sales stream.

<figure><img src="https://docs.agenatrader.com/~gitbook/image?url=https%3A%2F%2F2805764894-files.gitbook.io%2F%7E%2Ffiles%2Fv0%2Fb%2Fgitbook-legacy-files%2Fo%2Fassets%252F-MKZSsJBtSP9L4sqIe_q%252F-MPsGg6HjgHNeKnPeyog%252F-MPsH1D2QpzeOhVAinZd%252F7.png%3Falt%3Dmedia%26token%3D48a6294d-d4e1-4d34-b6b9-241dc6b1420b&#x26;width=768&#x26;dpr=4&#x26;quality=100&#x26;sign=a26921e5&#x26;sv=1" alt=""><figcaption></figcaption></figure>

* **Delta:** This display shows the difference between Ask and Bid on the basis of the AskBid volume chart. Here you don't have to compare or calculate around for a long time, but you can see much better where the volume increased at the Ask or at the Bid.

<figure><img src="https://docs.agenatrader.com/~gitbook/image?url=https%3A%2F%2F2805764894-files.gitbook.io%2F%7E%2Ffiles%2Fv0%2Fb%2Fgitbook-legacy-files%2Fo%2Fassets%252F-MKZSsJBtSP9L4sqIe_q%252F-MPsGg6HjgHNeKnPeyog%252F-MPsH6-BikZYdjvI2aKo%252F8.png%3Falt%3Dmedia%26token%3D3d5e8688-a27a-460b-ad37-dc88f1f0ad3d&#x26;width=768&#x26;dpr=4&#x26;quality=100&#x26;sign=d2019e3a&#x26;sv=1" alt=""><figcaption></figcaption></figure>

* **Disparity Charts** (imbalance): The volume Disparity Chart compares the traded bid volume of a price with the traded ask volume of the price directly above/below it. It then uses an algorithm built into the order streams that compares the volume ratio between the two.

<figure><img src="https://docs.agenatrader.com/~gitbook/image?url=https%3A%2F%2F2805764894-files.gitbook.io%2F%7E%2Ffiles%2Fv0%2Fb%2Fgitbook-legacy-files%2Fo%2Fassets%252F-MKZSsJBtSP9L4sqIe_q%252F-MPsGg6HjgHNeKnPeyog%252F-MPsH9XxXhGgG_3bCivz%252F9.png%3Falt%3Dmedia%26token%3D51b5e156-24e1-4399-be86-baea50320f59&#x26;width=768&#x26;dpr=4&#x26;quality=100&#x26;sign=4f543f47&#x26;sv=1" alt=""><figcaption></figcaption></figure>

Description:

* Bid prices are compared with higher ask prices and vice versa.
* If the volume on the bid or ask side differs by a factor of 1.5 (default value) as the equivalent value to be compared, it is considered and highlighted as disparity.
* Once the core is complete, the imbalance is persited, i.e. it no longer changes. In a running candle, the disparity coloring can change again at any time when the market restarts these price levels and thus changes the volume at this price level again.
* The disparity charts help to find areas of support and resistance.

**Example:**

<figure><img src="https://docs.agenatrader.com/~gitbook/image?url=https%3A%2F%2F2805764894-files.gitbook.io%2F%7E%2Ffiles%2Fv0%2Fb%2Fgitbook-legacy-files%2Fo%2Fassets%252F-MKZSsJBtSP9L4sqIe_q%252F-MPsGg6HjgHNeKnPeyog%252F-MPsHIazlVbGu8QLwwKS%252F10.png%3Falt%3Dmedia%26token%3D9babd6d0-bca0-4e05-8b53-801584c2e385&#x26;width=768&#x26;dpr=4&#x26;quality=100&#x26;sign=338457f1&#x26;sv=1" alt=""><figcaption></figcaption></figure>

* **AskBidSize:** This shows the OrderSizes on the Ask or Bid. This is not the size of the trade, but the volume before the actual trades at the ask or bid. So this chart show much higher Volumes than the AskBidVolume chart. With this chart you can see much better was placed at the various price levels, but did not get executed.

<figure><img src="https://docs.agenatrader.com/~gitbook/image?url=https%3A%2F%2F2805764894-files.gitbook.io%2F%7E%2Ffiles%2Fv0%2Fb%2Fgitbook-legacy-files%2Fo%2Fassets%252F-MKZSsJBtSP9L4sqIe_q%252F-MPsGg6HjgHNeKnPeyog%252F-MPsHNHufYI4MXrVL0FN%252F11.png%3Falt%3Dmedia%26token%3D810f5bf8-9336-44d2-9acf-743bfb0fe8d3&#x26;width=768&#x26;dpr=4&#x26;quality=100&#x26;sign=4afc4a73&#x26;sv=1" alt=""><figcaption></figcaption></figure>

#### OrderStream Indicators <a href="#orderstream_indicators" id="orderstream_indicators"></a>

In addition to the OrderStream bars, there are two indicators to show the different activities within the bars.

<figure><img src="https://docs.agenatrader.com/~gitbook/image?url=https%3A%2F%2F2805764894-files.gitbook.io%2F%7E%2Ffiles%2Fv0%2Fb%2Fgitbook-legacy-files%2Fo%2Fassets%252F-MKZSsJBtSP9L4sqIe_q%252F-MPsGg6HjgHNeKnPeyog%252F-MPsHRko770gvb_XKyX2%252F12.png%3Falt%3Dmedia%26token%3D3aec975d-5c72-40eb-bf0e-78c70671e367&#x26;width=768&#x26;dpr=4&#x26;quality=100&#x26;sign=a26478c0&#x26;sv=1" alt=""><figcaption></figcaption></figure>

* Cell Statistics and
* Line statistics

The following values are displayed in the cell statistics

1. Volume: Total volume in each bar
2. BuyVolume: purchase volume in the entire bar
3. SellVolume: sales volume throughout the bar
4. Delta: Difference between purchase and sales volume
5. Agregated Delta: Added up delta of the entire review time span
6. DeltaShift: The difference between the current and the previous delta value

The line statistics are the oscillator lines to the values in CellStatistics. The big advantage is that you can see right away where lows and highs form and do not have to search long in the cell statistics.

#### OrderStream Pad <a href="#orderstream_pad" id="orderstream_pad"></a>

AgenaTrader has already used the pad concept for several other applications. The OrderStream pad allows you to change your settings very efficiently without finding a parameter in an indicator popup in the 10th submenu.

To open and close the pad, click on the red icon in the ActionBar.

<figure><img src="https://docs.agenatrader.com/~gitbook/image?url=https%3A%2F%2F2805764894-files.gitbook.io%2F%7E%2Ffiles%2Fv0%2Fb%2Fgitbook-legacy-files%2Fo%2Fassets%252F-MKZSsJBtSP9L4sqIe_q%252F-MPsGg6HjgHNeKnPeyog%252F-MPsHWuKAQNSs9E60hmU%252F13.png%3Falt%3Dmedia%26token%3D03e472d1-f735-4d1a-b555-24f08fb93e60&#x26;width=768&#x26;dpr=4&#x26;quality=100&#x26;sign=dd1327a1&#x26;sv=1" alt=""><figcaption></figcaption></figure>

#### OrderStream-Bar Settings <a href="#orderstream-bar_settings" id="orderstream-bar_settings"></a>

* **BarType:** Allows the selection of the previously described bar types:
  * AskBidVolume
  * Disparity
  * AskBidSize
  * Delta
* **Colorize Cells:** controls the visibility of the cell background color

<figure><img src="https://docs.agenatrader.com/~gitbook/image?url=https%3A%2F%2F2805764894-files.gitbook.io%2F%7E%2Ffiles%2Fv0%2Fb%2Fgitbook-legacy-files%2Fo%2Fassets%252F-MKZSsJBtSP9L4sqIe_q%252F-MPsGg6HjgHNeKnPeyog%252F-MPsHalBjfY1t5A4CXnb%252F14.png%3Falt%3Dmedia%26token%3D75c8f450-f771-4742-98d4-c3579c25a4f8&#x26;width=768&#x26;dpr=4&#x26;quality=100&#x26;sign=9afc6105&#x26;sv=1" alt=""><figcaption></figcaption></figure>

* **DrawBound:** Sets whether you want to see a border around the bid/ask price levels.

<figure><img src="https://docs.agenatrader.com/~gitbook/image?url=https%3A%2F%2F2805764894-files.gitbook.io%2F%7E%2Ffiles%2Fv0%2Fb%2Fgitbook-legacy-files%2Fo%2Fassets%252F-MKZSsJBtSP9L4sqIe_q%252F-MPsGg6HjgHNeKnPeyog%252F-MPsHgKCi1g-3-aZXe-O%252F15.png%3Falt%3Dmedia%26token%3D173aa321-1a6c-4b6b-84dd-a2648ce54444&#x26;width=768&#x26;dpr=4&#x26;quality=100&#x26;sign=541ec90e&#x26;sv=1" alt=""><figcaption></figcaption></figure>

* **SellSide and BuySide Color:** This sets the color of the high purchase and sales volumes.

<figure><img src="https://docs.agenatrader.com/~gitbook/image?url=https%3A%2F%2F2805764894-files.gitbook.io%2F%7E%2Ffiles%2Fv0%2Fb%2Fgitbook-legacy-files%2Fo%2Fassets%252F-MKZSsJBtSP9L4sqIe_q%252F-MPsGg6HjgHNeKnPeyog%252F-MPsHkFTI5--AO1ScVhv%252F16.png%3Falt%3Dmedia%26token%3Da72477cb-911e-4ecd-94dd-55ca0df210cb&#x26;width=768&#x26;dpr=4&#x26;quality=100&#x26;sign=b89af06&#x26;sv=1" alt=""><figcaption></figcaption></figure>

* **MaxValueBright- and MaxValueDark-Color:** Setting the foreground color of the maximum values of the single bar.

<figure><img src="https://docs.agenatrader.com/~gitbook/image?url=https%3A%2F%2F2805764894-files.gitbook.io%2F%7E%2Ffiles%2Fv0%2Fb%2Fgitbook-legacy-files%2Fo%2Fassets%252F-MKZSsJBtSP9L4sqIe_q%252F-MPsGg6HjgHNeKnPeyog%252F-MPsHojauLuefgSYVH_1%252F17.png%3Falt%3Dmedia%26token%3D3f0b24e6-0d3c-416f-9bce-b3d2169b6a7d&#x26;width=768&#x26;dpr=4&#x26;quality=100&#x26;sign=4843e370&#x26;sv=1" alt=""><figcaption></figcaption></figure>

* **Aggregated Levels:** Number of aggregated price levels within which the volumes of the individual price levels are added up. This mainly makes sense for higher units of time.

<figure><img src="https://docs.agenatrader.com/~gitbook/image?url=https%3A%2F%2F2805764894-files.gitbook.io%2F%7E%2Ffiles%2Fv0%2Fb%2Fgitbook-legacy-files%2Fo%2Fassets%252F-MKZSsJBtSP9L4sqIe_q%252F-MPsGg6HjgHNeKnPeyog%252F-MPsHtK99hhgHAK1EMkg%252F18.png%3Falt%3Dmedia%26token%3Dcedbc51b-adfb-430b-92be-48efca8816a6&#x26;width=768&#x26;dpr=4&#x26;quality=100&#x26;sign=fa71bbcd&#x26;sv=1" alt=""><figcaption></figcaption></figure>

* **Min Volume Size:** This field can be used to filter out small volumes, i.e. volumes that are smaller than the entered value are not taken into account in the real-time construction of the order stream bar. It is mainly used to see the large volumes, which are mostly traded by the institutions and to hide the noise of the small and often inexperienced traders.
* **DisparityRatio:** sets the parameterization of the coloring in the DisparityChart

Default is 1.5 and means that the value to be compared on the higher Ask is higher or lower by more than the factor 1.5. If, for example, you set it to 2.0, this means that the comparison value deviates from the underlying by twice or half.

<figure><img src="https://docs.agenatrader.com/~gitbook/image?url=https%3A%2F%2F2805764894-files.gitbook.io%2F%7E%2Ffiles%2Fv0%2Fb%2Fgitbook-legacy-files%2Fo%2Fassets%252F-MKZSsJBtSP9L4sqIe_q%252F-MPsGg6HjgHNeKnPeyog%252F-MPsHxasewlaZFnewjGd%252F19.png%3Falt%3Dmedia%26token%3D74bca29f-36c2-4bac-a772-0f0ec75d1231&#x26;width=768&#x26;dpr=4&#x26;quality=100&#x26;sign=b887fb&#x26;sv=1" alt=""><figcaption></figcaption></figure>

* **ShowMaxValue:** Controls the display of the colored maximum value within a candle.

<figure><img src="https://docs.agenatrader.com/~gitbook/image?url=https%3A%2F%2F2805764894-files.gitbook.io%2F%7E%2Ffiles%2Fv0%2Fb%2Fgitbook-legacy-files%2Fo%2Fassets%252F-MKZSsJBtSP9L4sqIe_q%252F-MPsGg6HjgHNeKnPeyog%252F-MPsI10c3SGeTVKug4YP%252F20.png%3Falt%3Dmedia%26token%3Db55a2531-cd42-4afa-b22c-af1cb42c7068&#x26;width=768&#x26;dpr=4&#x26;quality=100&#x26;sign=b0cf90b3&#x26;sv=1" alt=""><figcaption></figcaption></figure>

* **TextFont:** This can be used to change the font of the order stream candles.
* **Max Hours Back:** is the number of hours for which the historical order stream ticket data is read.

<figure><img src="https://docs.agenatrader.com/~gitbook/image?url=https%3A%2F%2F2805764894-files.gitbook.io%2F%7E%2Ffiles%2Fv0%2Fb%2Fgitbook-legacy-files%2Fo%2Fassets%252F-MKZSsJBtSP9L4sqIe_q%252F-MPsGg6HjgHNeKnPeyog%252F-MPsIVTFq_zUAFx6i_to%252F21.png%3Falt%3Dmedia%26token%3D4bb49dd8-30f7-42a8-ba0a-38ca972ec3ea&#x26;width=768&#x26;dpr=4&#x26;quality=100&#x26;sign=2d57217e&#x26;sv=1" alt=""><figcaption></figcaption></figure>

#### OrderStream Indicator Settings <a href="#orderstream_indicator_settings" id="orderstream_indicator_settings"></a>

* **Cells and Lines checkbox:** this activates/deactivates the two indicators

<figure><img src="https://docs.agenatrader.com/~gitbook/image?url=https%3A%2F%2F2805764894-files.gitbook.io%2F%7E%2Ffiles%2Fv0%2Fb%2Fgitbook-legacy-files%2Fo%2Fassets%252F-MKZSsJBtSP9L4sqIe_q%252F-MPsGg6HjgHNeKnPeyog%252F-MPsIasKkH2IzDpDDgiI%252F22.png%3Falt%3Dmedia%26token%3Dde948bbe-8b23-42a7-9819-0103d8dd0a77&#x26;width=768&#x26;dpr=4&#x26;quality=100&#x26;sign=abcab916&#x26;sv=1" alt=""><figcaption></figcaption></figure>

* **“Volume” to “DeltaShift” checkboxes/colour bars:** Allows you to toggle the individual options on and off or to adjust the colour individually.

<figure><img src="https://docs.agenatrader.com/~gitbook/image?url=https%3A%2F%2F2805764894-files.gitbook.io%2F%7E%2Ffiles%2Fv0%2Fb%2Fgitbook-legacy-files%2Fo%2Fassets%252F-MKZSsJBtSP9L4sqIe_q%252F-MPsGg6HjgHNeKnPeyog%252F-MPsIfmH4vf1dr271t5f%252F23.png%3Falt%3Dmedia%26token%3Dec9593b7-c970-4e67-8a25-5daaf4ab0874&#x26;width=768&#x26;dpr=4&#x26;quality=100&#x26;sign=1a3c5a81&#x26;sv=1" alt=""><figcaption></figcaption></figure>

* **DrawBounds:** Draws the cell borders for the CellStatistic-Indicator

<figure><img src="https://docs.agenatrader.com/~gitbook/image?url=https%3A%2F%2F2805764894-files.gitbook.io%2F%7E%2Ffiles%2Fv0%2Fb%2Fgitbook-legacy-files%2Fo%2Fassets%252F-MKZSsJBtSP9L4sqIe_q%252F-MPsGg6HjgHNeKnPeyog%252F-MPsIkCNNeq0_0x2o-mN%252F24.png%3Falt%3Dmedia%26token%3Dbaa04f4e-13c6-4380-af6a-ee4640d4f3c5&#x26;width=768&#x26;dpr=4&#x26;quality=100&#x26;sign=ee689b80&#x26;sv=1" alt=""><figcaption></figcaption></figure>

* **Reset Settings:** resets all values to the system default settings


# ActionBar

The Action bar is located on the right hand side of the chart and is equipped with various functions to improve trading management.

| Icon                                                                | Decription                                     |
| ------------------------------------------------------------------- | ---------------------------------------------- |
| <img src="/files/CaYGSUZz15J9hxKug1hT" alt="" data-size="original"> | Maximize chart                                 |
| <img src="/files/bWE5BGSmWCUiMsKOrPv8" alt="" data-size="original"> | Fixate action bar                              |
| <img src="/files/UzpAhV7sYQbRSOfDKCAf" alt="" data-size="original"> | Show/hide trading pad                          |
| <img src="/files/4jtQjZF9Yk2OY2cFP12V" alt="" data-size="original"> | Open Quick Trader                              |
| <img src="/files/IhgldcAkUkWg7cplg55A" alt="" data-size="original"> | Open Option Pad                                |
| <img src="/files/GV9y98QIC81tvp6WNpUh" alt="" data-size="original"> | Fundamentals Pad                               |
| <img src="/files/gAe9QuXNnQ8VbflSHMlD" alt="" data-size="original"> | Open Chart Trading Pad (Standard oder AT++)    |
| <img src="/files/TaUxVqbgzTJsfoW1UBxi" alt="" data-size="original"> | Open DOM                                       |
| <img src="/files/jmMwlSTxsxIFMn5S9K0t" alt="" data-size="original"> | Open ActionBar settings                        |
| <img src="/files/bNRqlIG7XWDZH3yIwiN6" alt="" data-size="original"> | ActionBar: Instrument News from Google Finance |
| <img src="/files/UIL8icoPVBAYiCAl28WN" alt="" data-size="original"> | Change time frames                             |
| <img src="/files/89RcWqcQd4g2Tu1O2kow" alt="" data-size="original"> | Instrument lists                               |
| <img src="/files/7zu5GbEQ8gDn4BxpE98C" alt="" data-size="original"> | Quick setup buttons                            |
| <img src="/files/twVf0rQVxdxpW5ln5wyP" alt="" data-size="original"> | Quick indicators                               |
| <img src="/files/4GnExp2JVKhikVWfxZlq" alt="" data-size="original"> | Drawing objects                                |
| <img src="/files/uMoxJLbV2sUYCrKsHQ9K" alt="" data-size="original"> | Price styles                                   |
| <img src="/files/lARtxTtIS7Qb04rp33zK" alt="" data-size="original"> | Order Templates                                |

*The Action bar settings can be accessed by doing one of the following:*

1. Select from the main menu **Tools ->Settings -> Preferences** and then [**ActionBar**](https://docs.agenatrader.com/tools/configuration-escort#actionbar)**.**
2. Right-click on the **Action Bar** within the chart.

Furthermore Action Bar settings can be set general for all Action Bars if the user uses the Preferences setup (left picture) or for each chart individually if he/she accesses the action bar with a right click within the chart (right picture).

<figure><img src="/files/nRkIBviRZuqKXpILY8e2" alt=""><figcaption></figcaption></figure>

| ActionBar global settings (Global Configuration)        | ActionBar individual settings (right clicking on the ActionBar)  |
| ------------------------------------------------------- | ---------------------------------------------------------------- |
| **Apply** button: for global settings of all ActionBars | **Apply** button: only for individual settings                   |
|                                                         | **Apply for All** button: for global settings of all Action bars |

Now we give an overview of the functions of each mentioned element.

## Enlarge chart <a href="#enlarge-chart" id="enlarge-chart"></a>

This function allows you to enlarge a chart up to the size of a list / tab chart group charting area. ( <img src="/files/ddXqiaOkvzT8SR1FjC1r" alt="" data-size="line"> chart maximizing button).

<figure><img src="/files/4ey8BTX2l9n0vtlAzBiT" alt=""><figcaption></figcaption></figure>

Using the chart minimizing button <img src="/files/NDml8aN4COzqLdFpXGXy" alt="" data-size="line"> you can revert the chart back to its original form.

<figure><img src="/files/qqm6NxDFq4NhqcqZyqpg" alt=""><figcaption></figcaption></figure>

## Fixate ActionBar <a href="#fixate-actionbar" id="fixate-actionbar"></a>

If the **Fixed Action Bars** option within the **Action Bar->** [**General**](https://docs.agenatrader.com/tools/configuration-escort#actionbar) is enabled, the pin will not appear and the action bar will always be visible. If it is not enabled, you can determine for each individual chart (by left clicking on the pin) whether the Action bar should be fixed or appear only when the cursor is placed within the chart area.

<figure><img src="/files/bsYOxFy5Hpgpny3kz0Xj" alt=""><figcaption></figcaption></figure>

<figure><img src="https://docs.agenatrader.com/~gitbook/image?url=https%3A%2F%2F2805764894-files.gitbook.io%2F%7E%2Ffiles%2Fv0%2Fb%2Fgitbook-legacy-files%2Fo%2Fassets%252F-MKZSsJBtSP9L4sqIe_q%252F-MPsTj0lgFqDAyLs3LxM%252F-MPsXwByPK9_WU0haRHF%252FActionbar_fixated_eng.png%3Falt%3Dmedia%26token%3D90992791-8912-40ab-bc13-52087bf0a925&#x26;width=768&#x26;dpr=4&#x26;quality=100&#x26;sign=9406a688&#x26;sv=1" alt=""><figcaption></figcaption></figure>

<figure><img src="https://docs.agenatrader.com/~gitbook/image?url=https%3A%2F%2F2805764894-files.gitbook.io%2F%7E%2Ffiles%2Fv0%2Fb%2Fgitbook-legacy-files%2Fo%2Fassets%252F-MKZSsJBtSP9L4sqIe_q%252F-MPsTj0lgFqDAyLs3LxM%252F-MPsXsnSx3g9U5JCgYw7%252FActionbar_hidden_eng.png%3Falt%3Dmedia%26token%3D94223287-f493-4e29-be6d-ace8ac19bae5&#x26;width=768&#x26;dpr=4&#x26;quality=100&#x26;sign=be99df8c&#x26;sv=1" alt=""><figcaption></figcaption></figure>

## Open the trading pad <a href="#open-the-trading-pad" id="open-the-trading-pad"></a>

Left click on the **Open TradingPad** button to open / expand the trading pad (Standard on the left picture and AgenaTrader++ on the right picture).

<figure><img src="https://docs.agenatrader.com/~gitbook/image?url=https%3A%2F%2F2805764894-files.gitbook.io%2F%7E%2Ffiles%2Fv0%2Fb%2Fgitbook-legacy-files%2Fo%2Fassets%252F-MKZSsJBtSP9L4sqIe_q%252F-MPsTj0lgFqDAyLs3LxM%252F-MPsYDYLxzGEKutZIsDb%252FActionbar_OpenTradingPad.png%3Falt%3Dmedia%26token%3D6270e830-1cde-4fac-9a78-3eaf11f9d71d&#x26;width=768&#x26;dpr=4&#x26;quality=100&#x26;sign=ed5312d8&#x26;sv=1" alt=""><figcaption></figcaption></figure>

If you left click on the **Close TradingPad** ![Hide](https://docs.agenatrader.com/~gitbook/image?url=https%3A%2F%2F2805764894-files.gitbook.io%2F%7E%2Ffiles%2Fv0%2Fb%2Fgitbook-legacy-files%2Fo%2Fassets%252F-MKZSsJBtSP9L4sqIe_q%252F-MPA2Up_kL4jcNCs4R-c%252F-MPA5Fra6Sk4pVaresES%252Fhide.png%3Falt%3Dmedia%26token%3Db41ec37b-1420-4098-b0eb-bef721c26a34\&width=300\&dpr=4\&quality=100\&sign=43c0127b\&sv=1) button again, the trading pad will be hidden.

## Time frame regulator <a href="#time-frame-regulator" id="time-frame-regulator"></a>

Using the time frame regulator you can change the time frames for the corresponding chart. Right-click within the action bar to bring up the **Global Configuration ->** [**ActionBar**](https://docs.agenatrader.com/tools/configuration-escort#actionbar) **-> Time Frames** window and customize predefined time frames.

<figure><img src="/files/moHDJWDwzpjHvMj3FHgg" alt=""><figcaption></figcaption></figure>

## Instrument list buttons <a href="#instrument-list-buttons" id="instrument-list-buttons"></a>

The instrument list buttons enable you to add instruments to your favorites list, customize them, or remove them with a mouse click.

Right-click within the action bar to bring up the **Global Configuration ->** [**ActionBar**](https://docs.agenatrader.com/tools/configuration-escort#actionbar) **-> Instrument List** window, then in the drop-down list, select multiple instrument lists from the [**Instrument Editor**](https://docs.agenatrader.com/tools/instrument-escort). For each of the selected lists, AgenaTrader will create a button in the action bar.

When the instrument list button is red, this indicates that the current instrument in the chart is included in the instrument list. To remove this instrument from the instrument list, left click on the button. When the button is not colored, this indicates that the current instrument is not included in the instrument list. To add this instrument to the instrument list, left click on the button.

You can also use [hot keys](https://docs.agenatrader.com/tools/configuration-escort#Configuration_Escort__Hot_Keys) to add or remove instruments from the instrument lists.

<figure><img src="/files/NvnA2AKRbiNYmmRXhZXq" alt=""><figcaption></figcaption></figure>

<figure><img src="https://docs.agenatrader.com/~gitbook/image?url=https%3A%2F%2F2805764894-files.gitbook.io%2F%7E%2Ffiles%2Fv0%2Fb%2Fgitbook-legacy-files%2Fo%2Fassets%252F-MKZSsJBtSP9L4sqIe_q%252F-MPsTj0lgFqDAyLs3LxM%252F-MPsYcfN5xbyOD-68nwY%252FactionSiteBar.png%3Falt%3Dmedia%26token%3D5fd395e4-5e29-4fad-9484-bb9dec85f747&#x26;width=300&#x26;dpr=4&#x26;quality=100&#x26;sign=6c504765&#x26;sv=1" alt=""><figcaption></figcaption></figure>

## Quick setups <a href="#quick-setups" id="quick-setups"></a>

This functionality is available in the AgenaTrader++ Centaurus version and higher. The quick setup functionality enables you to transfer your customized setups from the [**Setup Builder**](https://docs.agenatrader.com/create-your-own-trading-strategy/setup-escort) to a chart with just a click.

<figure><img src="/files/g4bU9d2DX5vIaavM7h6P" alt=""><figcaption></figcaption></figure>

Select the **Global Configuration** menu. This will bring up a window in which you can select the [**ActionBar**](https://docs.agenatrader.com/tools/configuration-escort#actionbar) **-> Entry Escort** to configure your quick setups.

<figure><img src="/files/KL1vAalaF8lr4J7mMrtB" alt=""><figcaption></figcaption></figure>

Once defined, the corresponding B(uy) and S(ell) buttons will appear in the **Action bar**. If you click the B(uy) or S(ell) button for a specific setup, AgenaTrader will automatically place an order with the corresponding risk criteria and other parameters defined within the **Global Configuration**.

<figure><img src="/files/rl0X4mMIohabCsaWemM2" alt=""><figcaption></figcaption></figure>

## Quick indicators <a href="#quick-indicators" id="quick-indicators"></a>

Quick indicators have an ergonomic function, providing quick access to the most important indicators without overloading the chart. This leaves you enough space to display information pertaining to actual trading. The **Quick indicator** buttons are available within the action bar. As long as the cursor remains over one of these buttons, the indicator will be visible on the chart. When you hover away then the indicator will be hidden. If you click the quick indicator button, the corresponding indicator will be shown on the chart until you click this button again.

<figure><img src="/files/78ETcsXV0T18Rn4qlwIL" alt=""><figcaption></figcaption></figure>

The buttons have the same color as the indicator's line.

Right click on [**ActionBar**](https://docs.agenatrader.com/tools/configuration-escort#actionbar)**->Indicators** to configure the quick indicator setups.

<figure><img src="/files/C6NdveQyIjJsZ9ugBXng" alt=""><figcaption></figcaption></figure>

## Drawing objects <a href="#drawing-objects" id="drawing-objects"></a>

Use your favorite drawing objects for a quick access with the Action Bar.

<figure><img src="/files/rb9vFWB20XJlo6WC0a7m" alt=""><figcaption></figcaption></figure>

Right click [**ActionBar**](https://docs.agenatrader.com/tools/configuration-escort#actionbar) **-> Drawings** to configure the drawing objects.

## Order Templates <a href="#order-templates" id="order-templates"></a>

Use your favorite order templates for quick access in the **Action Bar**.

<figure><img src="/files/yLTAg972SStLEFA6qZXZ" alt=""><figcaption></figcaption></figure>

Find details about orders template on page [Chart Toolbar: Orders templates](https://docs.agenatrader.com/main/chart-area/untitled/orders-templates)

## Price styles <a href="#price-styles" id="price-styles"></a>

Use your favorite price styles for a quick access in the **Action Bar**.

<figure><img src="/files/9vUWPy8wNmcdswcpFY3V" alt=""><figcaption></figcaption></figure>

Right-click within the action bar to bring up the **Global Configuration ->** [**Action Bar**](https://docs.agenatrader.com/tools/configuration-escort#actionbar) **-> Price Style** window and customize predefined price styles.

If the charts are too compressed vertically, so that only a few buttons are visible inside the action bar, then you will need to scroll up or down:

1. Click on **Chart/ActionBar** make it active,
2. Move the cursor over the Action bar and left click,
3. Scroll up and down with the mouse wheel.

<figure><img src="https://docs.agenatrader.com/~gitbook/image?url=https%3A%2F%2F2805764894-files.gitbook.io%2F%7E%2Ffiles%2Fv0%2Fb%2Fgitbook-legacy-files%2Fo%2Fassets%252F-MKZSsJBtSP9L4sqIe_q%252F-MPsTj0lgFqDAyLs3LxM%252F-MPs_GCI6KvL5GKnkJu5%252FActionBar%2520%28scroll%29.jpg%3Falt%3Dmedia%26token%3D6aae60b9-1a93-4d04-ac6f-3b0b6db5990c&#x26;width=768&#x26;dpr=4&#x26;quality=100&#x26;sign=6a3305f3&#x26;sv=1" alt=""><figcaption></figcaption></figure>

## Quick Trader <a href="#actionbar__quick_trader__en" id="actionbar__quick_trader__en"></a>

The QuickTrader as the name implies allows the user to quickly enter orders and strategies directly on the chart. To access the QuickTrader bars click on the ![Quicktrader Button](https://docs.agenatrader.com/~gitbook/image?url=https%3A%2F%2F2805764894-files.gitbook.io%2F%7E%2Ffiles%2Fv0%2Fb%2Fgitbook-legacy-files%2Fo%2Fassets%252F-MKZSsJBtSP9L4sqIe_q%252F-MPnJBQf73uIOGhK2XwX%252F-MPnQtCxpI8Mz_7sWcSY%252Fquicktrader_button.png%3Falt%3Dmedia%26token%3Dacb650f4-307b-43d0-858a-a607fd82ae4f\&width=300\&dpr=4\&quality=100\&sign=6750ab90\&sv=1) button on the ActionBar and two vertical bars (1) will become visible, one in red (short) and one in green (long) as well as a quantity and strategy selection window (2). If L2 information is available for the instrument in use, there will be horizontal bars as well. These horizontal bars have a max. length of 4cm and imply the market depth.

Inside these horizontal bars the volume of the price level is displayed as a number but note that these numbers will be displayed only if the tick size is not too tight so it can fit inside the bar. The bars are colored in red for market depth and volume above the market price and green for market depth and volume below the market price.

<figure><img src="https://docs.agenatrader.com/~gitbook/image?url=https%3A%2F%2F2805764894-files.gitbook.io%2F%7E%2Ffiles%2Fv0%2Fb%2Fgitbook-legacy-files%2Fo%2Fassets%252F-MKZSsJBtSP9L4sqIe_q%252F-MPsTj0lgFqDAyLs3LxM%252F-MPs_MIGeMTcRvUZ8PL5%252FQuickTrader.jpg%3Falt%3Dmedia%26token%3D81f2a54d-d44d-466c-9773-8a69e276bfda&#x26;width=768&#x26;dpr=4&#x26;quality=100&#x26;sign=666282aa&#x26;sv=1" alt=""><figcaption></figcaption></figure>

#### **Quantity and Strategy selection window** <a href="#quantity-and-strategy-selection-window" id="quantity-and-strategy-selection-window"></a>

* Quantity: standard order size of the trade, if AT++ is NOT activated
* Strategy: SetupBuilder strategies, if AT++ is activated

<figure><img src="https://docs.agenatrader.com/~gitbook/image?url=https%3A%2F%2F2805764894-files.gitbook.io%2F%7E%2Ffiles%2Fv0%2Fb%2Fgitbook-legacy-files%2Fo%2Fassets%252F-MKZSsJBtSP9L4sqIe_q%252F-MPsTj0lgFqDAyLs3LxM%252F-MPs_RnnbNjWylYFrUfr%252Fquicktrader2.png%3Falt%3Dmedia%26token%3D29e306fe-5328-428c-a526-ea4124c890e8&#x26;width=768&#x26;dpr=4&#x26;quality=100&#x26;sign=c84ab008&#x26;sv=1" alt=""><figcaption></figcaption></figure>

#### **Entering orders** <a href="#entering-orders" id="entering-orders"></a>

The order entry behaves in the same way as is in the DOM. A left mouse click on the green or red vertical bar will create a order or order setup (AT++ if a strategy was selected in).

| Order type       | Cursor location             | Action                     |
| ---------------- | --------------------------- | -------------------------- |
| Limit Buy (bid)  | Bid-Area below Market Price | + Left mouse button        |
| Limit Sell (ask) | Ask-Area above Market Price | + Left mouse button        |
| StopLimit Buy    | Bid Area above Market Price | + Left mouse button + CTRL |
| StopLimit Sell   | Ask Area below Market Price | + Left mouse button + CTRL |
| Stop Buy         | Bid-Area above Market Price | + Left mouse button        |
| Stop Sell        | Ask-Area below Market Price | + Left mouse button        |
| Market Buy       | Bid-Area on Market Price    | + Left mouse button        |
| Market Sell      | Ask-Area on Market Price    | + Left mouse button        |

<figure><img src="https://docs.agenatrader.com/~gitbook/image?url=https%3A%2F%2F2805764894-files.gitbook.io%2F%7E%2Ffiles%2Fv0%2Fb%2Fgitbook-legacy-files%2Fo%2Fassets%252F-MKZSsJBtSP9L4sqIe_q%252F-MPsTj0lgFqDAyLs3LxM%252F-MPs_a3ol2WteZ2L8izN%252FActionbar_quicktrader_eng.png%3Falt%3Dmedia%26token%3Dcfb9f4df-1fe8-4357-a5b4-9e06ddde6486&#x26;width=768&#x26;dpr=4&#x26;quality=100&#x26;sign=7489a0d4&#x26;sv=1" alt=""><figcaption></figcaption></figure>

#### QuickTrader settings <a href="#quicktrader-settings" id="quicktrader-settings"></a>

*To open QuickTrader settings please use the following steps:*

* Right mouse click on Buy\&Sell Area
* Select QuickTrader settings

In the open dialog, you may adjust the following settings for QuickTrader

<figure><img src="https://docs.agenatrader.com/~gitbook/image?url=https%3A%2F%2F2805764894-files.gitbook.io%2F%7E%2Ffiles%2Fv0%2Fb%2Fgitbook-legacy-files%2Fo%2Fassets%252F-MKZSsJBtSP9L4sqIe_q%252F-MPsTj0lgFqDAyLs3LxM%252F-MPs_tf3-UEU3IAq7lGB%252FQuickTrader.png%3Falt%3Dmedia%26token%3Dd39ee906-3c0b-4ef4-ac30-e5e44811e308&#x26;width=768&#x26;dpr=4&#x26;quality=100&#x26;sign=cb245cf0&#x26;sv=1" alt=""><figcaption></figcaption></figure>

Buy Column **Back Color:** adjust background color for buying area **Font Color:** adjust font color of buying price level **Width:** Width of buying area

Sell Column **Back Color:** adjust background color for sell area **Font Color:** adjust font of the sell price level **Width:** Width of sell area

**Distance Between Buy & Sell Areas:** There you may set distance between Buy & Sell Areas **Distance From Price Scale:** There you may set distance between QuickTrader and Price Scale **Price Levels:** There you may set the number of price levels. The user may switch off price level for Quick Trader if set **0.** **AutoScale Price Level.** **Minimize QuickTraderBox In Chart:** If activated ChartBox will be minimized:

![Chart Box](https://docs.agenatrader.com/~gitbook/image?url=https%3A%2F%2F2805764894-files.gitbook.io%2F%7E%2Ffiles%2Fv0%2Fb%2Fgitbook-legacy-files%2Fo%2Fassets%252F-MKZSsJBtSP9L4sqIe_q%252F-MPsTj0lgFqDAyLs3LxM%252F-MPs_xQmToWq0dYiGF4o%252Fchart%2520box.png%3Falt%3Dmedia%26token%3D5637c797-f7e9-488f-b518-2dc07f39b327\&width=300\&dpr=4\&quality=100\&sign=959b9c77\&sv=1)

Left mouse click on ![Minimiz](https://docs.agenatrader.com/~gitbook/image?url=https%3A%2F%2F2805764894-files.gitbook.io%2F%7E%2Ffiles%2Fv0%2Fb%2Fgitbook-legacy-files%2Fo%2Fassets%252F-MKZSsJBtSP9L4sqIe_q%252F-MPsTj0lgFqDAyLs3LxM%252F-MPsa0tjY7I_C6GZQ12h%252Fminimiz.png%3Falt%3Dmedia%26token%3D9ad64894-6a62-4150-94aa-1f513286d921\&width=300\&dpr=4\&quality=100\&sign=88f7f734\&sv=1) button will restore ChartBox to default size

With the **Reset** button, you may set all settings to default.

The spread-lines are displayed by default when you activate the QuickTrader. If you want to disable the spread-lines you can do that with the following setting:

<figure><img src="https://docs.agenatrader.com/~gitbook/image?url=https%3A%2F%2F2805764894-files.gitbook.io%2F%7E%2Ffiles%2Fv0%2Fb%2Fgitbook-legacy-files%2Fo%2Fassets%252F-MKZSsJBtSP9L4sqIe_q%252F-MPsTj0lgFqDAyLs3LxM%252F-MPsa56o-_zU16BXIlLj%252FSpreadLines.png%3Falt%3Dmedia%26token%3D73a624e9-1793-4018-af90-5b7cbcf6f964&#x26;width=768&#x26;dpr=4&#x26;quality=100&#x26;sign=ecddebd4&#x26;sv=1" alt=""><figcaption></figcaption></figure>

**Important!** The user can change colors a for the quick trader function. The Color settings are accessible via the chart toolbar. Details on page [**Chart Toolbar: Color**](https://docs.agenatrader.com/main/chart-area/untitled/color)**.**

In case User saves the chart as the template, quick trader settings will be saved as well. Details on page [**Chart Group: Templates**](https://docs.agenatrader.com/main/chart-area/untitled/chart-group#Templates)

&#x20;  &#x20;

## &#x20; <img src="/files/o8anbXnlAdplT2eE7sFp" alt="" data-size="line"> Instrument News from Google Finance <a href="#instrument-news-from-google-finance" id="instrument-news-from-google-finance"></a>

This feature provides access to Instrument News from Google Finance website without needing to open a browser.

To access (and close) the **Instrument News from Google Finance** click on the <img src="/files/o8anbXnlAdplT2eE7sFp" alt="" data-size="line">

button on the ActionBar.

Open dialog automatically searches news about the instrument you use. In addition, the user can navigate through the google finance pages without using the browser.

In order to return from the choosen article to the Google news overview, simply press the "Backspace"-button or right click and then choose "return" in context menu.

<figure><img src="https://docs.agenatrader.com/~gitbook/image?url=https%3A%2F%2F2805764894-files.gitbook.io%2F%7E%2Ffiles%2Fv0%2Fb%2Fgitbook-legacy-files%2Fo%2Fassets%252F-MKZSsJBtSP9L4sqIe_q%252F-MPsTj0lgFqDAyLs3LxM%252F-MPsaIBabd2nuw53QtiY%252FGoogleNews.png%3Falt%3Dmedia%26token%3D50510559-f9d5-4770-8e7f-58fadd89a8ca&#x26;width=768&#x26;dpr=4&#x26;quality=100&#x26;sign=79270497&#x26;sv=1" alt=""><figcaption></figcaption></figure>


# Main Menu

## <img src="/files/yzyQ0dsSvbDWCMPajIwd" alt="" data-size="line"> Watch lists

#### Opening of the watch list <a href="#opening-of-the-watch-list" id="opening-of-the-watch-list"></a>

*In order to open a watch list use one of the options:*

1. Select **Watch** by using **Main -> New** or
2. left click the icon <img src="/files/yzyQ0dsSvbDWCMPajIwd" alt="" data-size="line"> in the application toolbar within the main window.

The watch list and the [scanner](https://docs.agenatrader.com/main/chart-area/realtime-scanner) fulfill the same functions in the list chart group.

<figure><img src="https://docs.agenatrader.com/~gitbook/image?url=https%3A%2F%2F2805764894-files.gitbook.io%2F%7E%2Ffiles%2Fv0%2Fb%2Fgitbook-legacy-files%2Fo%2Fassets%252F-MKZSsJBtSP9L4sqIe_q%252F-MQBdfDf-ZTWZl4Nuz7v%252F-MQBq4vKVh-qdbBMsCd2%252Fwatchlist.png%3Falt%3Dmedia%26token%3D5c28b4c1-a92c-42ed-8f51-1dae4e080f55&#x26;width=768&#x26;dpr=4&#x26;quality=100&#x26;sign=8024f50c&#x26;sv=1" alt=""><figcaption></figcaption></figure>

Right click and select the **Add Instruments** option to add new instruments or a new instrument list using the **Reload Instrument List** menu item.

<figure><img src="https://docs.agenatrader.com/~gitbook/image?url=https%3A%2F%2F2805764894-files.gitbook.io%2F%7E%2Ffiles%2Fv0%2Fb%2Fgitbook-legacy-files%2Fo%2Fassets%252F-MKZSsJBtSP9L4sqIe_q%252F-MQBdfDf-ZTWZl4Nuz7v%252F-MQBq9G_8JAkBOjlRwWy%252Fwatchlist_add.png%3Falt%3Dmedia%26token%3Dc909c63c-e839-4ab6-9f09-eb3cdc776008&#x26;width=768&#x26;dpr=4&#x26;quality=100&#x26;sign=4a43f0d5&#x26;sv=1" alt=""><figcaption></figcaption></figure>

You can manually add instrument symbols to the symbol column. A simple left click in the column beneath the last instrument will allow you to type in the symbol name. In addition to this, the instruments/symbols can be rearranged using the intuitive drag & drop functionality.

<figure><img src="https://docs.agenatrader.com/~gitbook/image?url=https%3A%2F%2F2805764894-files.gitbook.io%2F%7E%2Ffiles%2Fv0%2Fb%2Fgitbook-legacy-files%2Fo%2Fassets%252F-MKZSsJBtSP9L4sqIe_q%252F-MQBdfDf-ZTWZl4Nuz7v%252F-MQBqCRbonGBkAJUt3Qi%252Fwatch_symbol.png%3Falt%3Dmedia%26token%3D6e60348d-fdee-4d46-ab9b-8a2606c4571e&#x26;width=768&#x26;dpr=4&#x26;quality=100&#x26;sign=34a2d2de&#x26;sv=1" alt=""><figcaption></figcaption></figure>

Press the **Delete** button on the keyboard to delete the entry.

By righ-clicking on the header of a column you can access the option "Edit Columns" and **add a column to your Watchlist.**

<figure><img src="https://docs.agenatrader.com/~gitbook/image?url=https%3A%2F%2F2805764894-files.gitbook.io%2F%7E%2Ffiles%2Fv0%2Fb%2Fgitbook-legacy-files%2Fo%2Fassets%252F-MKZSsJBtSP9L4sqIe_q%252F-MQBdfDf-ZTWZl4Nuz7v%252F-MQBqFiMVbOHAI-Ntwx5%252FEditColumnsWatch.png%3Falt%3Dmedia%26token%3D24e4eee1-e24a-4caf-99d5-7f3ae5dc0ef8&#x26;width=768&#x26;dpr=4&#x26;quality=100&#x26;sign=fa7cab0c&#x26;sv=1" alt=""><figcaption></figcaption></figure>

In the following screenshot you can choose information, indicators and conditions to be displayed as a column. You can display detailled information for an instrument by adding Information->InstrumentProperty with a double click on it. Now you can set this to a big amount of different information as for example TradingHours, ExpiryDate (Futures), Margin, Point Value, Sectors, etc.

<figure><img src="https://docs.agenatrader.com/~gitbook/image?url=https%3A%2F%2F2805764894-files.gitbook.io%2F%7E%2Ffiles%2Fv0%2Fb%2Fgitbook-legacy-files%2Fo%2Fassets%252F-MKZSsJBtSP9L4sqIe_q%252F-MQBdfDf-ZTWZl4Nuz7v%252F-MQBqJa_ejdfZqKPmGVJ%252FColumns.png%3Falt%3Dmedia%26token%3Dbe80ad00-664a-41d9-980f-6be9c43d4695&#x26;width=768&#x26;dpr=4&#x26;quality=100&#x26;sign=d30d265f&#x26;sv=1" alt=""><figcaption></figcaption></figure>

#### Application Instructions <a href="#application-instructions" id="application-instructions"></a>

*To link the watch list to a* [*single chart group*](https://docs.agenatrader.com/main/chart-area/chart-container/chart-container#single-chart-group)*:*

1. right click within the Watch tab and
2. select the **Open Linked ChartGroup** menu item

Once linked, the Watch tab and Trade tab will be colored green. In this way you can freely link the [scanner](https://docs.agenatrader.com/main/chart-area/realtime-scanner) from the LCG [list chart group](https://docs.agenatrader.com/main/chart-area/chart-container/chart-container#Chart_Container__List_Chart_Group) = watch list to any chart.

## <img src="/files/XO60KRFnDJ1NQPCNGJCi" alt="" data-size="line"> 3rd Level Box

Along with the [Chart Toolbar: Standard chart trading pad](https://docs.agenatrader.com/main/chart-area/untitled/standard-chart-trading-pad), [Order Escort](https://docs.agenatrader.com/main/chart-area/order-escort) and [DOM](https://docs.agenatrader.com/main/main-menu/dom) the 3rd Level Box can also be used as a trading pad. *In order to open the 3rd level box use one of the options:*

1. Select **3rd Level Box** by using **Main -> New** or
2. Left click the symbol <img src="/files/XO60KRFnDJ1NQPCNGJCi" alt="" data-size="line"> in the [chart toolbar](https://docs.agenatrader.com/main/chart-area/untitled) within the main window.

<figure><img src="https://docs.agenatrader.com/~gitbook/image?url=https%3A%2F%2F2805764894-files.gitbook.io%2F%7E%2Ffiles%2Fv0%2Fb%2Fgitbook-legacy-files%2Fo%2Fassets%252F-MKZSsJBtSP9L4sqIe_q%252F-MQBdfDf-ZTWZl4Nuz7v%252F-MQBqTkRUfQ3P-gm8WsQ%252F3rd_level_box.png%3Falt%3Dmedia%26token%3Dd5ea6885-6c67-474a-8ff9-a8c536922e7b&#x26;width=768&#x26;dpr=4&#x26;quality=100&#x26;sign=dbd5e0b7&#x26;sv=1" alt=""><figcaption></figcaption></figure>

The **3rd Level Box** window displays the following information:

| Parameter              | Meaning                                                                                                                                                                                                                                                                                                                                                                                                                                                                                                                                                                                                                                                                                                                                                                                                                                                                                                                                                                                                                                                                                                                                                                                                                                                                                                                                                                                                                                                                                                                                                                                                                                                                                                                                                                                                                                                                  |
| ---------------------- | ------------------------------------------------------------------------------------------------------------------------------------------------------------------------------------------------------------------------------------------------------------------------------------------------------------------------------------------------------------------------------------------------------------------------------------------------------------------------------------------------------------------------------------------------------------------------------------------------------------------------------------------------------------------------------------------------------------------------------------------------------------------------------------------------------------------------------------------------------------------------------------------------------------------------------------------------------------------------------------------------------------------------------------------------------------------------------------------------------------------------------------------------------------------------------------------------------------------------------------------------------------------------------------------------------------------------------------------------------------------------------------------------------------------------------------------------------------------------------------------------------------------------------------------------------------------------------------------------------------------------------------------------------------------------------------------------------------------------------------------------------------------------------------------------------------------------------------------------------------------------ |
| Symbol                 | Name of the instrument for which Times\&Sales / Level2 data should be displayed. Use ![Instr](https://docs.agenatrader.com/~gitbook/image?url=https%3A%2F%2F2805764894-files.gitbook.io%2F%7E%2Ffiles%2Fv0%2Fb%2Fgitbook-legacy-files%2Fo%2Fassets%252F-MKZSsJBtSP9L4sqIe_q%252F-MPiui5T6cCcXZyP-9Tu%252F-MPiuynx25Lqlm3Vh13e%252Finstr.png%3Falt%3Dmedia%26token%3Db8559e41-dbe1-441e-863f-1e33c350a9c5\&width=300\&dpr=4\&quality=100\&sign=5656988a\&sv=1) to open a window for instrument selection.                                                                                                                                                                                                                                                                                                                                                                                                                                                                                                                                                                                                                                                                                                                                                                                                                                                                                                                                                                                                                                                                                                                                                                                                                                                                                                                                                                 |
| Chg:                   | Indicates the percentage change and absolute change of the day.                                                                                                                                                                                                                                                                                                                                                                                                                                                                                                                                                                                                                                                                                                                                                                                                                                                                                                                                                                                                                                                                                                                                                                                                                                                                                                                                                                                                                                                                                                                                                                                                                                                                                                                                                                                                          |
| Price fields           | [![Dot](https://docs.agenatrader.com/~gitbook/image?url=https%3A%2F%2Fagenatrader.com%2Fwiki%2Ftiki-download_file.php%3FfileId%3D22%26display\&width=300\&dpr=4\&quality=100\&sign=5ef5815b\&sv=1) ](https://agenatrader.com/wiki/tiki-download_file.php?fileId=22\&display)Day open value [![Dot](https://docs.agenatrader.com/~gitbook/image?url=https%3A%2F%2Fagenatrader.com%2Fwiki%2Ftiki-download_file.php%3FfileId%3D22%26display\&width=300\&dpr=4\&quality=100\&sign=5ef5815b\&sv=1) ](https://agenatrader.com/wiki/tiki-download_file.php?fileId=22\&display)Day high value [![Dot](https://docs.agenatrader.com/~gitbook/image?url=https%3A%2F%2Fagenatrader.com%2Fwiki%2Ftiki-download_file.php%3FfileId%3D22%26display\&width=300\&dpr=4\&quality=100\&sign=5ef5815b\&sv=1) ](https://agenatrader.com/wiki/tiki-download_file.php?fileId=22\&display)Day low value                                                                                                                                                                                                                                                                                                                                                                                                                                                                                                                                                                                                                                                                                                                                                                                                                                                                                                                                                                                          |
| Real-Time              | [![Dot](https://docs.agenatrader.com/~gitbook/image?url=https%3A%2F%2Fagenatrader.com%2Fwiki%2Ftiki-download_file.php%3FfileId%3D22%26display\&width=300\&dpr=4\&quality=100\&sign=5ef5815b\&sv=1) ](https://agenatrader.com/wiki/tiki-download_file.php?fileId=22\&display)Last: latest submitted price [![Dot](https://docs.agenatrader.com/~gitbook/image?url=https%3A%2F%2Fagenatrader.com%2Fwiki%2Ftiki-download_file.php%3FfileId%3D22%26display\&width=300\&dpr=4\&quality=100\&sign=5ef5815b\&sv=1) ](https://agenatrader.com/wiki/tiki-download_file.php?fileId=22\&display)Bid: current bid price [![Dot](https://docs.agenatrader.com/~gitbook/image?url=https%3A%2F%2Fagenatrader.com%2Fwiki%2Ftiki-download_file.php%3FfileId%3D22%26display\&width=300\&dpr=4\&quality=100\&sign=5ef5815b\&sv=1) ](https://agenatrader.com/wiki/tiki-download_file.php?fileId=22\&display)Ask: current ask price [![Dot](https://docs.agenatrader.com/~gitbook/image?url=https%3A%2F%2Fagenatrader.com%2Fwiki%2Ftiki-download_file.php%3FfileId%3D22%26display\&width=300\&dpr=4\&quality=100\&sign=5ef5815b\&sv=1) ](https://agenatrader.com/wiki/tiki-download_file.php?fileId=22\&display)Spread: current difference between ask and bid [![Dot](https://docs.agenatrader.com/~gitbook/image?url=https%3A%2F%2Fagenatrader.com%2Fwiki%2Ftiki-download_file.php%3FfileId%3D22%26display\&width=300\&dpr=4\&quality=100\&sign=5ef5815b\&sv=1) ](https://agenatrader.com/wiki/tiki-download_file.php?fileId=22\&display)Size: volumes of the last trade [![Dot](https://docs.agenatrader.com/~gitbook/image?url=https%3A%2F%2Fagenatrader.com%2Fwiki%2Ftiki-download_file.php%3FfileId%3D22%26display\&width=300\&dpr=4\&quality=100\&sign=5ef5815b\&sv=1) ](https://agenatrader.com/wiki/tiki-download_file.php?fileId=22\&display)Total: total volume of the current day |
| Order part(red edging) | If the keyboard or mouse clicks are not sufficient for trading, you can also use the 3rd Level Box to handle via these buttons. Learn more about this functionality in the [Chart Toolbar: Standard chart trading pad](https://docs.agenatrader.com/main/chart-area/untitled/standard-chart-trading-pad)                                                                                                                                                                                                                                                                                                                                                                                                                                                                                                                                                                                                                                                                                                                                                                                                                                                                                                                                                                                                                                                                                                                                                                                                                                                                                                                                                                                                                                                                                                                                                                 |
| Bid/Ask list           | [![Dot](https://docs.agenatrader.com/~gitbook/image?url=https%3A%2F%2Fagenatrader.com%2Fwiki%2Ftiki-download_file.php%3FfileId%3D22%26display\&width=300\&dpr=4\&quality=100\&sign=5ef5815b\&sv=1) ](https://agenatrader.com/wiki/tiki-download_file.php?fileId=22\&display)ECN: (Electronic communication network) is the ECN broker [![Dot](https://docs.agenatrader.com/~gitbook/image?url=https%3A%2F%2Fagenatrader.com%2Fwiki%2Ftiki-download_file.php%3FfileId%3D22%26display\&width=300\&dpr=4\&quality=100\&sign=5ef5815b\&sv=1) ](https://agenatrader.com/wiki/tiki-download_file.php?fileId=22\&display)Bid/Ask: bid or ask of an ECN [![Dot](https://docs.agenatrader.com/~gitbook/image?url=https%3A%2F%2Fagenatrader.com%2Fwiki%2Ftiki-download_file.php%3FfileId%3D22%26display\&width=300\&dpr=4\&quality=100\&sign=5ef5815b\&sv=1) ](https://agenatrader.com/wiki/tiki-download_file.php?fileId=22\&display)Size: position size related to the bid/ask prices or to an ECN Different colors indicate different price settings for the market depth. If several ECNs set the same price, then precisely these ECNs will be visible within the same colored area. Press the ![Marker](https://docs.agenatrader.com/~gitbook/image?url=https%3A%2F%2F2805764894-files.gitbook.io%2F%7E%2Ffiles%2Fv0%2Fb%2Fgitbook-legacy-files%2Fo%2Fassets%252F-MKZSsJBtSP9L4sqIe_q%252F-MPDtoZQcIfH15XRa6OO%252F-MPDviEE7cDefSzBjpHh%252Fmarker.png%3Falt%3Dmedia%26token%3Df1de2d74-0a92-4eb0-8265-5863ad02b152\&width=300\&dpr=4\&quality=100\&sign=8968428\&sv=1) button to change the ECN color settings for the bid/ask list.                                                                                                                                                                                                                                        |
| Time\&Sales            | [![Dot](https://docs.agenatrader.com/~gitbook/image?url=https%3A%2F%2Fagenatrader.com%2Fwiki%2Ftiki-download_file.php%3FfileId%3D22%26display\&width=300\&dpr=4\&quality=100\&sign=5ef5815b\&sv=1) ](https://agenatrader.com/wiki/tiki-download_file.php?fileId=22\&display)Price: is the price at which a transaction took place [![Dot](https://docs.agenatrader.com/~gitbook/image?url=https%3A%2F%2Fagenatrader.com%2Fwiki%2Ftiki-download_file.php%3FfileId%3D22%26display\&width=300\&dpr=4\&quality=100\&sign=5ef5815b\&sv=1) ](https://agenatrader.com/wiki/tiki-download_file.php?fileId=22\&display)Size: is the volume executed with the corresponding price [![Dot](https://docs.agenatrader.com/~gitbook/image?url=https%3A%2F%2Fagenatrader.com%2Fwiki%2Ftiki-download_file.php%3FfileId%3D22%26display\&width=300\&dpr=4\&quality=100\&sign=5ef5815b\&sv=1) ](https://agenatrader.com/wiki/tiki-download_file.php?fileId=22\&display)Exchange: stock exchange at which the transaction occurred [![Dot](https://docs.agenatrader.com/~gitbook/image?url=https%3A%2F%2Fagenatrader.com%2Fwiki%2Ftiki-download_file.php%3FfileId%3D22%26display\&width=300\&dpr=4\&quality=100\&sign=5ef5815b\&sv=1) ](https://agenatrader.com/wiki/tiki-download_file.php?fileId=22\&display)Time: time of transaction                                                                                                                                                                                                                                                                                                                                                                                                                                                                                                                                                     |

You can utilize the functionalities of the 3rd Level Box with the keyboard or by combining the keyboard keys and mouse clicks. Define the [keyboard shortcuts](https://docs.agenatrader.com/tools/configuration-escort#Configuration_Escort__Hot_Keys) to make your trading more comfortable.

<figure><img src="https://docs.agenatrader.com/~gitbook/image?url=https%3A%2F%2F2805764894-files.gitbook.io%2F%7E%2Ffiles%2Fv0%2Fb%2Fgitbook-legacy-files%2Fo%2Fassets%252F-MKZSsJBtSP9L4sqIe_q%252F-MQBdfDf-ZTWZl4Nuz7v%252F-MQBqrpaugfUntrr1_Ro%252FHotkeys.PNG%3Falt%3Dmedia%26token%3D250d51e6-45b9-4ce0-a3e7-0cbe81e5a139&#x26;width=768&#x26;dpr=4&#x26;quality=100&#x26;sign=30800b3a&#x26;sv=1" alt=""><figcaption></figcaption></figure>

The combination of keyboard keys and mouse clicks offer the following possibilities:

| Hot keys                           | Order      |
| ---------------------------------- | ---------- |
| Ctrl + mouse click in the bid list | Stop Sell  |
| Alt + mouse click in the bid list  | Limit Buy  |
| Ctrl + mouse click in the ask list | Stop Buy   |
| Alt + mouse click in the ask list  | Limit Sell |

Orders will be placed at the current price level clicked on with the mouse.

The 3rd Level Box can also be activated together with the chart, making the orders visible in the chart as well. You can alternatively make orders visible on all charts by enabling the **Show TradeMarkers on all Charts** option in the General/Chart tabs in the [Global Configuration](https://docs.agenatrader.com/tools/configuration-escort).

## <img src="/files/CFAYHKZPHjvCEcDN0m0i" alt="" data-size="line"> Forex Pad

*In order to open the Forex Pad use one of the options:*

1. Select **Forex Pad** by using **Main -> New** or
2. Left click the symbol <img src="/files/CFAYHKZPHjvCEcDN0m0i" alt="" data-size="line"> in the application toolbar within the main window.

<figure><img src="https://docs.agenatrader.com/~gitbook/image?url=https%3A%2F%2F2805764894-files.gitbook.io%2F%7E%2Ffiles%2Fv0%2Fb%2Fgitbook-legacy-files%2Fo%2Fassets%252F-MKZSsJBtSP9L4sqIe_q%252F-MPDtoZQcIfH15XRa6OO%252F-MPDvxO96eaKQFBC7wuU%252FForexPad.png%3Falt%3Dmedia%26token%3Decfcbaeb-932c-40d6-ae0d-6a7d2f81144b&#x26;width=768&#x26;dpr=4&#x26;quality=100&#x26;sign=96ec72cf&#x26;sv=1" alt=""><figcaption></figcaption></figure>

In order to quickly effect entries into long- or short positions, use buy and sell buttons in the Forex pad to place a variety of instruments (including non-Forex-instruments) next to each other. For each instrument you can see the price (best bid/ask and corresponding volume), the spread and the daily high/low. Double-clicking on buy or sell opens a position with previously activated settings (order size, order type etc.).

*Context menu:*

* Add Instrument: opens a window to add an instrument or an instrument list (including shares lists) from the Instrument Editor.
* Remove Instrument: deletes the currently selected instrument.
* Remove All: empties the ForexPad.

<figure><img src="https://docs.agenatrader.com/~gitbook/image?url=https%3A%2F%2F2805764894-files.gitbook.io%2F%7E%2Ffiles%2Fv0%2Fb%2Fgitbook-legacy-files%2Fo%2Fassets%252F-MKZSsJBtSP9L4sqIe_q%252F-MPDtoZQcIfH15XRa6OO%252F-MPDw04pXnqiXqR1Hcmn%252Fforex_pad2.png%3Falt%3Dmedia%26token%3Dd64f3612-4ce3-4ae5-a21b-8690a05dd310&#x26;width=768&#x26;dpr=4&#x26;quality=100&#x26;sign=69b7be71&#x26;sv=1" alt=""><figcaption></figcaption></figure>

Left clicking in the Forex pairs area applies the exchange symbol to the symbol field of the [order parts](https://docs.agenatrader.com/main/chart-area/untitled/standard-chart-trading-pad). Clicking in the buy/sell area of the currency pairs activates the corresponding order button. To place an order, left click on the buy/sell button at the top of the the order pad (or double-click in the buy/sell area of the currency pairs). If the position has been opened, you will see the volume and opened profit/loss beside the instrument symbol.

<figure><img src="https://docs.agenatrader.com/~gitbook/image?url=https%3A%2F%2F2805764894-files.gitbook.io%2F%7E%2Ffiles%2Fv0%2Fb%2Fgitbook-legacy-files%2Fo%2Fassets%252F-MKZSsJBtSP9L4sqIe_q%252F-MQBrvCspukGt0jmKnE6%252F-MQBsNGzyqyJgE31p6GQ%252FForexPad_eng.png%3Falt%3Dmedia%26token%3D42019fd3-e12a-4ee5-932d-249768652a3e&#x26;width=768&#x26;dpr=4&#x26;quality=100&#x26;sign=ea9fe238&#x26;sv=1" alt=""><figcaption></figcaption></figure>

The default settings for the order size can be changed in tabs [**Stocks/ETFs, Forex and Futures**](https://docs.agenatrader.com/create-your-own-trading-strategy/at-plusplus-manager#at-plus-plus-order-rounding) within the **Global Configuration**.

<figure><img src="https://docs.agenatrader.com/~gitbook/image?url=https%3A%2F%2F2805764894-files.gitbook.io%2F%7E%2Ffiles%2Fv0%2Fb%2Fgitbook-legacy-files%2Fo%2Fassets%252F-MKZSsJBtSP9L4sqIe_q%252F-MPDtoZQcIfH15XRa6OO%252F-MPDw9P_hdRgoir81oLb%252FOrder%2520Rounding.PNG%3Falt%3Dmedia%26token%3D77a91e65-d51d-4d18-bb9c-00c9cca8d541&#x26;width=768&#x26;dpr=4&#x26;quality=100&#x26;sign=b286bb41&#x26;sv=1" alt=""><figcaption></figcaption></figure>

## <img src="/files/DGApkSScieqkTaGa1zCi" alt="" data-size="line"> Portfolio Mixer

The Portfolio Mixer <img src="/files/DGApkSScieqkTaGa1zCi" alt="" data-size="line"> is an analysis tool to display total winnings or losses for a specific time period of a selected instrument list with one or more instruments (securities).

<figure><img src="https://docs.agenatrader.com/~gitbook/image?url=https%3A%2F%2F2805764894-files.gitbook.io%2F%7E%2Ffiles%2Fv0%2Fb%2Fgitbook-legacy-files%2Fo%2Fassets%252F-MKZSsJBtSP9L4sqIe_q%252F-MPDtoZQcIfH15XRa6OO%252F-MPDwJbDbrApXY0kokUQ%252FPortfolio%2520Mixer.jpg%3Falt%3Dmedia%26token%3Dac157ea7-5839-4b43-9e10-5a1d744b69be&#x26;width=768&#x26;dpr=4&#x26;quality=100&#x26;sign=70154a80&#x26;sv=1" alt=""><figcaption></figcaption></figure>

**Settings**

![](https://docs.agenatrader.com/~gitbook/image?url=https%3A%2F%2F2805764894-files.gitbook.io%2F%7E%2Ffiles%2Fv0%2Fb%2Fgitbook-legacy-files%2Fo%2Fassets%252F-MKZSsJBtSP9L4sqIe_q%252F-MQBrvCspukGt0jmKnE6%252F-MQBt7k0BmvZ3Yd6DPx7%252FPortfolioMixer.PNG%3Falt%3Dmedia%26token%3D8e6c24dd-8a92-42c0-89c8-94f48e888038\&width=768\&dpr=4\&quality=100\&sign=f49fd48b\&sv=1)![](https://docs.agenatrader.com/~gitbook/image?url=https%3A%2F%2F2805764894-files.gitbook.io%2F%7E%2Ffiles%2Fv0%2Fb%2Fgitbook-legacy-files%2Fo%2Fassets%252F-MKZSsJBtSP9L4sqIe_q%252F-MPDtoZQcIfH15XRa6OO%252F-MPDwWTiLSsjlriHDhsH%252FportfolioMixerSetttings.png%3Falt%3Dmedia%26token%3D722a9d48-4747-41cb-b42d-12ae7204baac\&width=768\&dpr=4\&quality=100\&sign=460ab378\&sv=1)

| Parameter             | Meaning                                                                                                                                                                                                                                                                                                                                                                                                                                                                                                                |
| --------------------- | ---------------------------------------------------------------------------------------------------------------------------------------------------------------------------------------------------------------------------------------------------------------------------------------------------------------------------------------------------------------------------------------------------------------------------------------------------------------------------------------------------------------------- |
| Entry                 | Starting date, it represents the trade entries of the portfolio.                                                                                                                                                                                                                                                                                                                                                                                                                                                       |
| Exit                  | Exit date, it represents the trade exit of the portfolio (only if "Realtime mode is deactivated).                                                                                                                                                                                                                                                                                                                                                                                                                      |
| Interval              | Interval of the Periodicity (e.g. 1 min, 1 hour, ...) The chart will be displayed in this time frame.                                                                                                                                                                                                                                                                                                                                                                                                                  |
| Periodicity           | Choose between min, hours, days, etc. The chart will be displayed in this time frame.                                                                                                                                                                                                                                                                                                                                                                                                                                  |
| Show Single Equities  | The Equity curve will display each instrument (security) in a single curve. On top of the Equity curve the name of each instrument will be displayed and it's total winnings or losses.                                                                                                                                                                                                                                                                                                                                |
| Show Account Equities | The Equity curve will display only one curve of all the instruments (securities) combined. On top of the Equity curve the name of the total account and it's winnings and losses are displayed.                                                                                                                                                                                                                                                                                                                        |
| Buying Power          | Buying power of the account portfolio                                                                                                                                                                                                                                                                                                                                                                                                                                                                                  |
| Realtime mode         | If the checkbox has been checked the Exit date is the current date and time.                                                                                                                                                                                                                                                                                                                                                                                                                                           |
| Instrument List       | The instrument list which contains the instruments (securities) to be shown in the portfolio mixer. Please note that only instrument lists can be used with the portfolio mixer. It is possible to add instruments simply by typing in the new symbol name on the bottom row of the list. Learn more about how to create instrument lists in the section [**Creating and managing instrument lists**](https://docs.agenatrader.com/tools/instrument-escort#Instrument_Escort__Creating__and_managing_instrument_lists) |
| Chart Template        | Select a chart template for chart representation.                                                                                                                                                                                                                                                                                                                                                                                                                                                                      |

**Instrument List shows the following information:**

<figure><img src="https://docs.agenatrader.com/~gitbook/image?url=https%3A%2F%2F2805764894-files.gitbook.io%2F%7E%2Ffiles%2Fv0%2Fb%2Fgitbook-legacy-files%2Fo%2Fassets%252F-MKZSsJBtSP9L4sqIe_q%252F-MPDtoZQcIfH15XRa6OO%252F-MPDw_6WnVi7cgA7ezrM%252FportfolioMixerInstruments.png%3Falt%3Dmedia%26token%3D9e031e51-58a4-4260-ac2f-0d7cc0d95978&#x26;width=768&#x26;dpr=4&#x26;quality=100&#x26;sign=363ad6b9&#x26;sv=1" alt=""><figcaption></figcaption></figure>

| Column     | Meaning                                                                                          |
| ---------- | ------------------------------------------------------------------------------------------------ |
| Symbol     | Instrument symbol                                                                                |
| Entry      | Entry date (see settings)                                                                        |
| Exit       | Exit date (only if "Realtime mode is deactivated)                                                |
| Percentage | Percentage of the Buying Power invested in this instrument (security).                           |
| B/S        | The user can choose if he wants to buy (long) or sell (short) this instrument (security).        |
| Pause      | Stop the download of real time data for the chart (only if "Realtime mode" checkbox is checked). |

## <img src="/files/xdoX9V2wBdvccaJklfx8" alt="" data-size="line"> DOM window <a href="#dom_window" id="dom_window"></a>

The DOM (Depth of the market) provides full functionality for placing orders in the market. In order to be able to use DOM, you will need level 2 data, which you have to request from your data feed provider.

*In order to open the DOM use one of the options:*

1. Select **DOM** by using **Main -> New** or
2. Left click the symbol <img src="/files/xdoX9V2wBdvccaJklfx8" alt="" data-size="line"> in the [chart toolbar](https://docs.agenatrader.com/main/chart-area/untitled) within the main window.

<figure><img src="https://docs.agenatrader.com/~gitbook/image?url=https%3A%2F%2F2805764894-files.gitbook.io%2F%7E%2Ffiles%2Fv0%2Fb%2Fgitbook-legacy-files%2Fo%2Fassets%252F-MKZSsJBtSP9L4sqIe_q%252F-MPDtoZQcIfH15XRa6OO%252F-MPDwllFeJx0Iu7eHJOV%252FDOM_main_new.png%3Falt%3Dmedia%26token%3D92546fa2-06ae-4834-beab-72b6f6a25ba6&#x26;width=768&#x26;dpr=4&#x26;quality=100&#x26;sign=18be88e5&#x26;sv=1" alt=""><figcaption></figcaption></figure>

The left side of the window displays the following instrument information:

| Parameter | Meaning                                                        |
| --------- | -------------------------------------------------------------- |
| Symbol    | Symbol for the selected instrument                             |
| Spread    | Displays the current spread for the instrument                 |
| Cum. Vol. | Shows the cumulative order size for the particular price level |
| Quantity  | Trading volumes                                                |
| TIF       | Validity of orders                                             |
| Flatten   | Closes the position and cancels all orders                     |
| Reverse   | Reverses the position into the opposite trading direction      |

**Tip!** It is possible to assign a [Hot Key](https://docs.agenatrader.com/tools/configuration-escort#Configuration_Escort__Hot_Keys) to the buttons "Reverse" and "Flatten".

<figure><img src="https://docs.agenatrader.com/~gitbook/image?url=https%3A%2F%2F2805764894-files.gitbook.io%2F%7E%2Ffiles%2Fv0%2Fb%2Fgitbook-legacy-files%2Fo%2Fassets%252F-MKZSsJBtSP9L4sqIe_q%252F-MPDtoZQcIfH15XRa6OO%252F-MPDww6xVNJIGnhjeOBt%252FHotkeys%2520%281%29.PNG%3Falt%3Dmedia%26token%3D69ab75ed-9830-475f-a50a-fe29d26e1be7&#x26;width=768&#x26;dpr=4&#x26;quality=100&#x26;sign=6b0ff46f&#x26;sv=1" alt=""><figcaption></figcaption></figure>

The right side shows the [Times and Sales](https://docs.agenatrader.com/main/main-menu/times-and-sales) list for the selected instrument.

<figure><img src="https://docs.agenatrader.com/~gitbook/image?url=https%3A%2F%2F2805764894-files.gitbook.io%2F%7E%2Ffiles%2Fv0%2Fb%2Fgitbook-legacy-files%2Fo%2Fassets%252F-MKZSsJBtSP9L4sqIe_q%252F-MPDtoZQcIfH15XRa6OO%252F-MPDx-1pvsvFF_PVJlDn%252FDOM_TimesAndSales.png%3Falt%3Dmedia%26token%3D899f80d4-3665-432b-8bc3-034bb4f83295&#x26;width=768&#x26;dpr=4&#x26;quality=100&#x26;sign=90f2997c&#x26;sv=1" alt=""><figcaption></figcaption></figure>

What can you actually see in the order book? The two bars right at the top show the overall volume for buy and sell orders. Even if some orders are not in the visible area, their volumes are still included in the calculation.

The yellow cell displays the last price and the volume (in brackets):

When the box next to "Cum. Vol." is checked, you see the overall volume for the last orders executed at the same price When the box next to "Cum. Vol." is not checked, you see the volume of the last order.

You can see the overall volume for the respective price on the left (for buy orders) and right (for sell orders). Values in brackets represent the cumulative volume for n levels (ticks) - in this case for every 5 ticks. You can change this setting as desired using "Size Summaries for Every Levels". In the example below, the 2-level cumulative volumes are calculated on the sell side in the following way: 581+318+510+973+501=2883.

<figure><img src="https://docs.agenatrader.com/~gitbook/image?url=https%3A%2F%2F2805764894-files.gitbook.io%2F%7E%2Ffiles%2Fv0%2Fb%2Fgitbook-legacy-files%2Fo%2Fassets%252F-MKZSsJBtSP9L4sqIe_q%252F-MQBrvCspukGt0jmKnE6%252F-MQBu-RXeX_FC1zk3R3c%252FDOM-E.jpg%3Falt%3Dmedia%26token%3Da62431be-d30b-40fb-bf1d-85a965f926a9&#x26;width=768&#x26;dpr=4&#x26;quality=100&#x26;sign=47549317&#x26;sv=1" alt=""><figcaption></figcaption></figure>

On the left side, the user may notice Volume Histogram (HIST). It displays the traded volume per price-level for the complete chart.

<figure><img src="https://docs.agenatrader.com/~gitbook/image?url=https%3A%2F%2F2805764894-files.gitbook.io%2F%7E%2Ffiles%2Fv0%2Fb%2Fgitbook-legacy-files%2Fo%2Fassets%252F-MKZSsJBtSP9L4sqIe_q%252F-MQBrvCspukGt0jmKnE6%252F-MQBu7GIOeUE1xOh0WYR%252FHIST.png%3Falt%3Dmedia%26token%3Dc22959ab-37cc-4c49-b99c-68a3952ccbfc&#x26;width=768&#x26;dpr=4&#x26;quality=100&#x26;sign=f40e8aaf&#x26;sv=1" alt=""><figcaption></figcaption></figure>

#### Submission of orders via DOM <a href="#submission_of_orders_via_dom" id="submission_of_orders_via_dom"></a>

The possible order types are summarized below:

| Order            | Cursor location             | Action                             |
| ---------------- | --------------------------- | ---------------------------------- |
| Limit Buy (bid)  | Bid-Area below Market Price | + Left Mouse Button                |
| Limit Buy (ask)  | Ask-Area below Market Price | + Left Mouse Button + Ask Checkbox |
| Limit Sell (ask) | Ask-Area above Market Price | + Left Mouse Button                |
| Limit Sell (bid) | Bid-Area above Market Price | + Left Mouse Button + Bid Checkbox |
| StopLimit Buy    | Bid Area above Market Price | + Left Mouse Button + CTRL         |
| StopLimit Sell   | Ask Area below Market Price | + Left Mouse Button + CTRL         |
| Stop Buy         | Bid-Area above Market Price | + Left Mouse Button                |
| Stop Sell        | Ask Area below Market Price | + Left Mouse Button                |
| Market Buy       | Bid-Area on Market Price    | + Left Mouse Button                |
| Market Sell      | Ask-Area on Market Price    | + Left Mouse Button                |

To submit a **Limit Buy/Sell, Stop Buy/Sell** or **Stop Limit Buy/Sell** order you have 2 different possibilities:

1\. Select the cell that corresponds to the desired price and left click on it.

<figure><img src="https://docs.agenatrader.com/~gitbook/image?url=https%3A%2F%2F2805764894-files.gitbook.io%2F%7E%2Ffiles%2Fv0%2Fb%2Fgitbook-legacy-files%2Fo%2Fassets%252F-MKZSsJBtSP9L4sqIe_q%252F-MPDtoZQcIfH15XRa6OO%252F-MPDxDMoySYvbGXdJPg6%252FDOM_Buy_Sell1.png%3Falt%3Dmedia%26token%3D2d059793-4bb2-4989-bf63-6f4b167d670e&#x26;width=768&#x26;dpr=4&#x26;quality=100&#x26;sign=6555fa9&#x26;sv=1" alt=""><figcaption></figcaption></figure>

2\. To submit a **Stop Limit Buy** или **Stop Limit Sell** order, hold the Ctrl button and click above the market price in the bid area or below the market price in the ask area. The selected cell will be frozen, allowing you to enter the difference in cents/ticks/pips for the limit price and the stop price. The picture below illustrates this:

<figure><img src="https://docs.agenatrader.com/~gitbook/image?url=https%3A%2F%2F2805764894-files.gitbook.io%2F%7E%2Ffiles%2Fv0%2Fb%2Fgitbook-legacy-files%2Fo%2Fassets%252F-MKZSsJBtSP9L4sqIe_q%252F-MPDtoZQcIfH15XRa6OO%252F-MPDxI-ddjuT7wv891Aa%252FDOM_StrgTaste.png%3Falt%3Dmedia%26token%3D3cc7d337-ab8d-4858-9788-9e94df2e455e&#x26;width=768&#x26;dpr=4&#x26;quality=100&#x26;sign=ae68bf4e&#x26;sv=1" alt=""><figcaption></figcaption></figure>

You are able to move orders via DOM by mouse.

<figure><img src="https://docs.agenatrader.com/~gitbook/image?url=https%3A%2F%2F2805764894-files.gitbook.io%2F%7E%2Ffiles%2Fv0%2Fb%2Fgitbook-legacy-files%2Fo%2Fassets%252F-MKZSsJBtSP9L4sqIe_q%252F-MPDtoZQcIfH15XRa6OO%252F-MPDxN8uuP9UJjAkrzmu%252Fpicture654-1.png%3Falt%3Dmedia%26token%3D6f9bb15b-bedc-43a0-9d36-b764fded3055&#x26;width=768&#x26;dpr=4&#x26;quality=100&#x26;sign=d26db75a&#x26;sv=1" alt=""><figcaption></figcaption></figure>

3\. Use the cells in the middle to submit **market buy/sell** orders. This button changes red for a short position, and green for a long position. Subsequently, the opened position and corresponding volumes are displayed in the **Trades tab**. Clicking on the **Flatten** button closes the position and cancels the orders.

![](https://docs.agenatrader.com/~gitbook/image?url=https%3A%2F%2F2805764894-files.gitbook.io%2F%7E%2Ffiles%2Fv0%2Fb%2Fgitbook-legacy-files%2Fo%2Fassets%252F-MKZSsJBtSP9L4sqIe_q%252F-MPDtoZQcIfH15XRa6OO%252F-MPDxRZ8whZVJgeFms_I%252FDOM_market.png%3Falt%3Dmedia%26token%3D4d744d18-4673-43ad-aa4c-cf6cad201f14\&width=768\&dpr=4\&quality=100\&sign=33aa9c2f\&sv=1)

If the price shifts away from the initial price of the opened position, it will still be shown at the top or bottom next to the price column. If several submitted orders turn out to be in the non-visible area, they will be displayed cumulatively at the top or bottom next to the price column.

<figure><img src="https://docs.agenatrader.com/~gitbook/image?url=https%3A%2F%2F2805764894-files.gitbook.io%2F%7E%2Ffiles%2Fv0%2Fb%2Fgitbook-legacy-files%2Fo%2Fassets%252F-MKZSsJBtSP9L4sqIe_q%252F-MQBrvCspukGt0jmKnE6%252F-MQBuxu2K5YzsGVuU14h%252FDOM_kumulliert_eng.png%3Falt%3Dmedia%26token%3D7c6e01c7-1248-4666-9e50-0c2f71933b9b&#x26;width=768&#x26;dpr=4&#x26;quality=100&#x26;sign=343d234f&#x26;sv=1" alt=""><figcaption></figcaption></figure>

The user may access DOM, Time\&Sales and QuickTrader properties via button Properties

<figure><img src="https://docs.agenatrader.com/~gitbook/image?url=https%3A%2F%2F2805764894-files.gitbook.io%2F%7E%2Ffiles%2Fv0%2Fb%2Fgitbook-legacy-files%2Fo%2Fassets%252F-MKZSsJBtSP9L4sqIe_q%252F-MQBrvCspukGt0jmKnE6%252F-MQBv1-YGVPTHwEgQOIw%252FProperties.png%3Falt%3Dmedia%26token%3D9506923e-1da2-4873-8515-7f01508d7bb5&#x26;width=768&#x26;dpr=4&#x26;quality=100&#x26;sign=9ec3119f&#x26;sv=1" alt=""><figcaption></figcaption></figure>

The DOM properties can also be accessed by using the [Hot Key](https://docs.agenatrader.com/tools/configuration-escort#Configuration_Escort__Hot_Keys).

#### **DOM - context menu** <a href="#dom-context-menu" id="dom-context-menu"></a>

With a rightclick in one of the columns of the DOM you will open context menu:

<figure><img src="https://docs.agenatrader.com/~gitbook/image?url=https%3A%2F%2F2805764894-files.gitbook.io%2F%7E%2Ffiles%2Fv0%2Fb%2Fgitbook-legacy-files%2Fo%2Fassets%252F-MKZSsJBtSP9L4sqIe_q%252F-MQBrvCspukGt0jmKnE6%252F-MQBv6SVPIz7kMdrKB8l%252FDOM%2520ContextMenu.png%3Falt%3Dmedia%26token%3Dd4fefe57-c4db-41a1-89e4-b8d43504fa3d&#x26;width=768&#x26;dpr=4&#x26;quality=100&#x26;sign=483b96a3&#x26;sv=1" alt=""><figcaption></figcaption></figure>

* Hold: stops price railing (displayed in the middle)
* Hide Quick Trading Buttons:on the lower end of DOM Trade Buttons can be hidden respectively shown:

<figure><img src="https://docs.agenatrader.com/~gitbook/image?url=https%3A%2F%2F2805764894-files.gitbook.io%2F%7E%2Ffiles%2Fv0%2Fb%2Fgitbook-legacy-files%2Fo%2Fassets%252F-MKZSsJBtSP9L4sqIe_q%252F-MQBrvCspukGt0jmKnE6%252F-MQBvBKrxDVfihtabWoq%252FQuickTradeButtons.png%3Falt%3Dmedia%26token%3D0f9008c1-ffd0-422a-9efb-feddfaca044c&#x26;width=768&#x26;dpr=4&#x26;quality=100&#x26;sign=324f35f&#x26;sv=1" alt=""><figcaption></figcaption></figure>

* Cancel all orders: all orders are canceled
* Flatten: closes a position and delets all orders
* Hide Time\&Sales: activates respectively deactivates Time\&Sales column
* DOM Template: here you can safe, load or remove templates

<figure><img src="https://docs.agenatrader.com/~gitbook/image?url=https%3A%2F%2F2805764894-files.gitbook.io%2F%7E%2Ffiles%2Fv0%2Fb%2Fgitbook-legacy-files%2Fo%2Fassets%252F-MKZSsJBtSP9L4sqIe_q%252F-MQBrvCspukGt0jmKnE6%252F-MQBvl-NTfOhmlRbUzNJ%252FDOMTemplate.png%3Falt%3Dmedia%26token%3D6b2ec91c-8a02-4214-a0fd-6447d972408c&#x26;width=768&#x26;dpr=4&#x26;quality=100&#x26;sign=3469701a&#x26;sv=1" alt=""><figcaption></figcaption></figure>

* DOM Properties:

1. Buy/Sell Relation: Here the color settings for Buy/Sell Relations can be changed
2. DOM Colors: Here the color settings for Ask, Bid, Times\&Sales and so on can be changed
3. Price Levels Count: There you may set the number of price levels.
4. Fonts: Here you can select font settings
5. Orders: Here the color settings for the different orders can be changed
6. Other: Here you can change general settings for cumulative volume, price level count, display of tooltips and so on
7. Price Volume Histogramm: Displays Volume Histogramm in between TradingPad and DOM
8. Sizes: Here you can change size of columns of DOM, order columns and so on
9. Trades: Here you change color settings for your trades and positionen
10. Visibility: Here you can set, if Quick Trading Buttons, Spreads should be shown or not
11. Volume Histogramm: Here you can change color settings for DOM itself

<figure><img src="https://docs.agenatrader.com/~gitbook/image?url=https%3A%2F%2F2805764894-files.gitbook.io%2F%7E%2Ffiles%2Fv0%2Fb%2Fgitbook-legacy-files%2Fo%2Fassets%252F-MKZSsJBtSP9L4sqIe_q%252F-MQBrvCspukGt0jmKnE6%252F-MQBvtwJ7kDH29OupgmW%252FShot1.png%3Falt%3Dmedia%26token%3Db9cd475e-d4b2-4a4d-a048-52a2907783bd&#x26;width=768&#x26;dpr=4&#x26;quality=100&#x26;sign=bf6eb133&#x26;sv=1" alt=""><figcaption></figcaption></figure>

## <img src="/files/MotaZlbLC2TyMIVhIBRW" alt="" data-size="line"> Times and Sales

The **Times & Sales** window displays the price, volume and the last traded time.

*In order to open the Times and sales window, which is detached from* [*DOM*](https://docs.agenatrader.com/main/main-menu/dom) *and* [*3rd Level Box*](https://docs.agenatrader.com/main/main-menu/3rd-level-box) *use one of the options:*

1. Select **Times & Sales** by using **Main -> new** or
2. Left click the symbol <img src="/files/MotaZlbLC2TyMIVhIBRW" alt="" data-size="line"> in the application toolbar within the main window.

The left side of the window shows the following instrument information:

<figure><img src="https://docs.agenatrader.com/~gitbook/image?url=https%3A%2F%2F2805764894-files.gitbook.io%2F%7E%2Ffiles%2Fv0%2Fb%2Fgitbook-legacy-files%2Fo%2Fassets%252F-MKZSsJBtSP9L4sqIe_q%252F-MQBrvCspukGt0jmKnE6%252F-MQBwA8oFgF4QW6TXSLo%252FTime%2520and%2520Sales1.PNG%3Falt%3Dmedia%26token%3Dec5ba3c6-e454-42f4-ab6c-2226333a0202&#x26;width=768&#x26;dpr=4&#x26;quality=100&#x26;sign=973dde1f&#x26;sv=1" alt=""><figcaption></figcaption></figure>

**Color properties:**

| Parameter            | Meaning                                                    |
| -------------------- | ---------------------------------------------------------- |
| Price Alignment      | tba                                                        |
| Size Alignment       | tba                                                        |
| Above Ask Back Color | Trades above the ask price (text background color)         |
| Above Ask Fore Color | Trades above the ask price (text color)                    |
| At Ask Back Color    | Trades at ask price (text background color)                |
| At Ask Fore Color    | Trades at ask price (text color)                           |
| At Bid Back Color    | Trades at bid price (text background color)                |
| At Bid Fore Color    | Trades at bid price (text color)                           |
| Background Color     | Background color                                           |
| Below Bid Back Color | Trades below bid price (text background color)             |
| Below Bid Fore Color | Trades below bid price (text color)                        |
| Daily High Color     | Daily High price (text color)                              |
| Daily Low Color      | Daily Low price (text color)                               |
| In Spread Back Color | Trades within the spread price (text background color)     |
| In Spread Fore Color | Trades within the spread price (text color)                |
| Quantity Alerts      | Allow to set alarm filters for specified trade size.       |
| Quantity Filters     | Allow to set trade size which be excluded from Time\&Sales |
| Fonts                | Font settings                                              |

#### Stock EOD screener <a href="#stock_eod_screener" id="stock_eod_screener"></a>

(available as well in the Discovery version)

The stock EOD screener makes it possible to scan for around 7000 US stocks according to the fundamental and technical criteria.

**You can use the EOD screener for the following:**

* Scanning and saving the results (the lists will appear in the [**Instrument Editor**](https://docs.agenatrader.com/tools/instrument-escort) in the **Screener Presets**);

<figure><img src="https://docs.agenatrader.com/~gitbook/image?url=https%3A%2F%2F2805764894-files.gitbook.io%2F%7E%2Ffiles%2Fv0%2Fb%2Fgitbook-legacy-files%2Fo%2Fassets%252F-MKZSsJBtSP9L4sqIe_q%252F-MQBrvCspukGt0jmKnE6%252F-MQBwG-KZA4zQbJjSRae%252Fstock_eod_screener_custom.png%3Falt%3Dmedia%26token%3Db4b14d72-7d12-4547-9cc1-a50f0e115384&#x26;width=768&#x26;dpr=4&#x26;quality=100&#x26;sign=ae7eca8d&#x26;sv=1" alt=""><figcaption></figcaption></figure>

* Using the scanned lists in a [list chart group](https://docs.agenatrader.com/main/chart-area/chart-container/chart-container#Chart_Container__List_Chart_Group) or [tab chart group](https://docs.agenatrader.com/main/chart-area/chart-container/chart-container#Chart_Container__Tab_Chart_Group);
* Daily reloading of the list chart group or tab chart group. This is necessary because the dynamic **Stocks EOD Scanner** lists are not uploaded automatically in the list chart group or the tab chart group (however, within the [Instrument Editor](https://docs.agenatrader.com/tools/instrument-escort) they are always updated):
  * [Reload the list chart group](https://docs.agenatrader.com/tools/instrument-escort#Instrument_Escort__Creating__and_managing_instrument_lists)
  * [Reload the tab chart group](https://docs.agenatrader.com/main/chart-area/chart-container/chart-container#Chart_Container__Tab_Chart_Group).

*The stock EOD screener consists of three sections:*

<figure><img src="https://docs.agenatrader.com/~gitbook/image?url=https%3A%2F%2F2805764894-files.gitbook.io%2F%7E%2Ffiles%2Fv0%2Fb%2Fgitbook-legacy-files%2Fo%2Fassets%252F-MKZSsJBtSP9L4sqIe_q%252F-MQBrvCspukGt0jmKnE6%252F-MQBwM9TWVZc2hhH-sEx%252FEOD.png%3Falt%3Dmedia%26token%3D948d3ff7-4daf-46ce-99a0-9e29d50b0405&#x26;width=768&#x26;dpr=4&#x26;quality=100&#x26;sign=c5821de&#x26;sv=1" alt=""><figcaption></figcaption></figure>

The upper section offers the following possibilities:

| Setting                            | Meaning                                                                                                                                                                                                                                                                                                                                                                                                                                                                                                                                                                                                                                                                                                                                                                 | Icon/Picture                                                                                                                                                                                                                                                                                                                                                                                                 |
| ---------------------------------- | ----------------------------------------------------------------------------------------------------------------------------------------------------------------------------------------------------------------------------------------------------------------------------------------------------------------------------------------------------------------------------------------------------------------------------------------------------------------------------------------------------------------------------------------------------------------------------------------------------------------------------------------------------------------------------------------------------------------------------------------------------------------------- | ------------------------------------------------------------------------------------------------------------------------------------------------------------------------------------------------------------------------------------------------------------------------------------------------------------------------------------------------------------------------------------------------------------ |
| Add, save or remove a scanner list | To save a new configuration as a list, enter the desired name into the text field and click the "+" button. Once saved, the list will appear in the drop-down box. To remove the selected list, left click on the "-" button. To completely reset the scanner and begin the new configuration, left click on “none”                                                                                                                                                                                                                                                                                                                                                                                                                                                     | ![StockEodScreenDeleteAdd](https://docs.agenatrader.com/~gitbook/image?url=https%3A%2F%2F2805764894-files.gitbook.io%2F%7E%2Ffiles%2Fv0%2Fb%2Fgitbook-legacy-files%2Fo%2Fassets%252F-MKZSsJBtSP9L4sqIe_q%252F-MQBrvCspukGt0jmKnE6%252F-MQBwQl84hOHscl881J4%252FstockEodScreenDeleteAdd.png%3Falt%3Dmedia%26token%3D625d5061-04ce-4bf7-9f66-30b1d0051d8e\&width=300\&dpr=4\&quality=100\&sign=a1ba6448\&sv=1) |
| Signal filter                      | Shows filter options that can be combined with the common filter criteria                                                                                                                                                                                                                                                                                                                                                                                                                                                                                                                                                                                                                                                                                               | ![StockEodScreener2](https://docs.agenatrader.com/~gitbook/image?url=https%3A%2F%2F2805764894-files.gitbook.io%2F%7E%2Ffiles%2Fv0%2Fb%2Fgitbook-legacy-files%2Fo%2Fassets%252F-MKZSsJBtSP9L4sqIe_q%252F-MQBrvCspukGt0jmKnE6%252F-MQBwVF3OKGZK-OBalSb%252FstockEodScreener2.png%3Falt%3Dmedia%26token%3Dce43c7e0-9219-44d1-9baa-cdf2cf034ba2\&width=300\&dpr=4\&quality=100\&sign=1c570bd2\&sv=1)             |
| Symbols filter                     | Shows filter options that will allow scanning for particular criteria within the instrument list. You can also combine various instrument lists with each other, or instrument lists with individual symbols. For example, if you wish to scan for the lists S\&P1, S\&P2 and the symbol RIMM, then delimit these three elements with a comma as shown on the picture: ![StockEodScreener4](https://docs.agenatrader.com/~gitbook/image?url=https%3A%2F%2F2805764894-files.gitbook.io%2F%7E%2Ffiles%2Fv0%2Fb%2Fgitbook-legacy-files%2Fo%2Fassets%252F-MKZSsJBtSP9L4sqIe_q%252F-MQBrvCspukGt0jmKnE6%252F-MQBwapYSkPO3lFCGXpt%252FstockEodScreener4.png%3Falt%3Dmedia%26token%3Dbda02a4c-e864-4023-b85a-efa721f110ae\&width=300\&dpr=4\&quality=100\&sign=d473c21d\&sv=1) | ![StockEodScreener3](https://docs.agenatrader.com/~gitbook/image?url=https%3A%2F%2F2805764894-files.gitbook.io%2F%7E%2Ffiles%2Fv0%2Fb%2Fgitbook-legacy-files%2Fo%2Fassets%252F-MKZSsJBtSP9L4sqIe_q%252F-MQBrvCspukGt0jmKnE6%252F-MQBwYvHtmqHAQlAMOW8%252FstockEodScreener3.png%3Falt%3Dmedia%26token%3Dcd22b121-7eae-4f6e-86d6-aae659239a4d\&width=300\&dpr=4\&quality=100\&sign=a746d366\&sv=1)             |
| MS Excel Export                    | To save the scanner content into a CSV file click the MS Excel icon                                                                                                                                                                                                                                                                                                                                                                                                                                                                                                                                                                                                                                                                                                     | <img src="/files/1xLDunjVfTk2OCRkI1ec" alt="" data-size="line">                                                                                                                                                                                                                                                                                                                                              |
| Load Data                          | Reloads the current configuration                                                                                                                                                                                                                                                                                                                                                                                                                                                                                                                                                                                                                                                                                                                                       | ![Load Data Button](https://docs.agenatrader.com/~gitbook/image?url=https%3A%2F%2F2805764894-files.gitbook.io%2F%7E%2Ffiles%2Fv0%2Fb%2Fgitbook-legacy-files%2Fo%2Fassets%252F-MKZSsJBtSP9L4sqIe_q%252F-MQBrvCspukGt0jmKnE6%252F-MQBwj50LYlbGt9j-ZIa%252FLoad%2520Data%2520button.PNG%3Falt%3Dmedia%26token%3D4473fd4a-9fc0-4f52-9eb6-d66cc91c17e2\&width=300\&dpr=4\&quality=100\&sign=a050595a\&sv=1)       |
| Reset                              | Deletes the current configuration without changing the list                                                                                                                                                                                                                                                                                                                                                                                                                                                                                                                                                                                                                                                                                                             | ![Reset Button](https://docs.agenatrader.com/~gitbook/image?url=https%3A%2F%2F2805764894-files.gitbook.io%2F%7E%2Ffiles%2Fv0%2Fb%2Fgitbook-legacy-files%2Fo%2Fassets%252F-MKZSsJBtSP9L4sqIe_q%252F-MQBrvCspukGt0jmKnE6%252F-MQBwmA9SP3mVkPS6ZNS%252FReset%2520Button.PNG%3Falt%3Dmedia%26token%3Debf545e2-1c9b-4276-8177-9ff0386fe034\&width=300\&dpr=4\&quality=100\&sign=4cbc3cb7\&sv=1)                   |
| Filter                             | Allows to show or hide the filter criteria                                                                                                                                                                                                                                                                                                                                                                                                                                                                                                                                                                                                                                                                                                                              | ![Reset Button](https://docs.agenatrader.com/~gitbook/image?url=https%3A%2F%2F2805764894-files.gitbook.io%2F%7E%2Ffiles%2Fv0%2Fb%2Fgitbook-legacy-files%2Fo%2Fassets%252F-MKZSsJBtSP9L4sqIe_q%252F-MQBrvCspukGt0jmKnE6%252F-MQBxjQY7kYxTVBwb97C%252Ffilter%2520button.png%3Falt%3Dmedia%26token%3Dfb8bb6d2-ab61-4256-b3e2-c4e2524f4fec\&width=300\&dpr=4\&quality=100\&sign=faf7fa68\&sv=1)                  |
| Columns                            | Allows to define which columns should be displayed within the table                                                                                                                                                                                                                                                                                                                                                                                                                                                                                                                                                                                                                                                                                                     | ![Columns Button](https://docs.agenatrader.com/~gitbook/image?url=https%3A%2F%2F2805764894-files.gitbook.io%2F%7E%2Ffiles%2Fv0%2Fb%2Fgitbook-legacy-files%2Fo%2Fassets%252F-MKZSsJBtSP9L4sqIe_q%252F-MQBrvCspukGt0jmKnE6%252F-MQBxodV0Te0KXrgaJM5%252FColumns%2520button.PNG%3Falt%3Dmedia%26token%3D713ffb5a-f45e-44d9-8348-271e7c5ddd82\&width=300\&dpr=4\&quality=100\&sign=f8ecb2b6\&sv=1)               |

## <img src="/files/AWNKOdZwQ5k6K4gjJnpc" alt="" data-size="line"> Trading Journal

This function is only available with the AgenaTrader Andromeda or higher versions of the trading platform.

AgenaTrader records each trade and keeps an automated trading journal. This enables you to clearly understand and evaluate trading behavior.

#### Workflow <a href="#workflow" id="workflow"></a>

* You can open your Trading Journal via Main -> New -> Trading Journal or by clicking the corresponding icon <img src="/files/AWNKOdZwQ5k6K4gjJnpc" alt="" data-size="line">  in the tool bar.
* Choose the criteria, you want to filter: You can activate one ore more entries, exits accounts, instrument types, time frames and direction (long / short). In case you do not choose anything in "Direction"-box, both long and short trades will be displayed.
* Specify, whether you want to filter for entry- or exit-time and define exact date and time for start and end point.
* Click "Show Journal".

<figure><img src="https://docs.agenatrader.com/~gitbook/image?url=https%3A%2F%2F2805764894-files.gitbook.io%2F%7E%2Ffiles%2Fv0%2Fb%2Fgitbook-legacy-files%2Fo%2Fassets%252F-MKZSsJBtSP9L4sqIe_q%252F-MQC-woGmyPtYRVxRKz9%252F-MQC0-un87NLhwpXew0w%252FFilterEN.png%3Falt%3Dmedia%26token%3D1ead44d6-608b-4f61-9999-f519d975d5ff&#x26;width=768&#x26;dpr=4&#x26;quality=100&#x26;sign=c6fe1124&#x26;sv=1" alt=""><figcaption></figcaption></figure>

#### Settings Menu <a href="#settings-menu" id="settings-menu"></a>

**FAMILIAR FUNCTIONS:**

* Entry
* Exit
* Accounts
* InstrumentType
* Direction
* TimeFrame
* Date From/To

**NEW:**

* Button: Show Journal

Click this button to load the trade journal with the affected settings.

* TRADE RATING (global)

You can evaluate your trades in the JournalTab using the Entry/Exit/TradeManagement Rating, from which the TotalRating for each trade is calculated. Here, the average of all TotalRatings is shown as the overall Rating of your trading. The more stars you achieve, the better you have stuck to your trading rules and the more positively you have rated your trades.

* Balance Change

Is the total profit/loss generated by all trades loaded in the journal.

| Available Columns        | Explanation                                                                                                                                                                                                                                                                                                                                                                                                     |
| ------------------------ | --------------------------------------------------------------------------------------------------------------------------------------------------------------------------------------------------------------------------------------------------------------------------------------------------------------------------------------------------------------------------------------------------------------- |
| Account                  | the account in which the trade was executed.                                                                                                                                                                                                                                                                                                                                                                    |
| Exchange                 | Stock Exchange                                                                                                                                                                                                                                                                                                                                                                                                  |
| Type                     | the instrument type (currency, stocks etc.).                                                                                                                                                                                                                                                                                                                                                                    |
| Instrument name          | name of the instrument.                                                                                                                                                                                                                                                                                                                                                                                         |
| Symbol                   | symbol of the instrument on the exchange.                                                                                                                                                                                                                                                                                                                                                                       |
| Direction                | long or short trade.                                                                                                                                                                                                                                                                                                                                                                                            |
| Timeframe                | trade timeframe                                                                                                                                                                                                                                                                                                                                                                                                 |
| Entry Time               | date and time of the trade opening.                                                                                                                                                                                                                                                                                                                                                                             |
| Entry reason             | the entry strategy.                                                                                                                                                                                                                                                                                                                                                                                             |
| Entry price              | price of the entry order.                                                                                                                                                                                                                                                                                                                                                                                       |
| Average Price            | trade average price                                                                                                                                                                                                                                                                                                                                                                                             |
| Volume Open              | Open position size                                                                                                                                                                                                                                                                                                                                                                                              |
| Exit time                | date and time of exit.                                                                                                                                                                                                                                                                                                                                                                                          |
| Exit price               | price at execution.                                                                                                                                                                                                                                                                                                                                                                                             |
| Exit reason              | reason for the exit from the trade.                                                                                                                                                                                                                                                                                                                                                                             |
| Initial Stop Price       | If you have started a trade with the AT++ automatism, the price at which you have placed your initial stop is displayed. For discretionary trades, the initial stop can usually no longer be read and the display remains at 0.00. With the initial stop price, the RiskMultiples are measured in the PerformanceGraph, whereby 1 risk is defined as the distance between the entry and the initial stop price. |
| Volume Closed            | Closed position size                                                                                                                                                                                                                                                                                                                                                                                            |
| Exit Currency            | exit trade currency                                                                                                                                                                                                                                                                                                                                                                                             |
| P\&L                     | profit or loss.                                                                                                                                                                                                                                                                                                                                                                                                 |
| P\&L %                   | The profit/loss as a percentage value of the current account balance at the respective time of the trade exit.                                                                                                                                                                                                                                                                                                  |
| Max. Profit During Trade | This calculates the maximum profit that you could have extracted from the trade. The price development during the trade is analyzed and the maximum profit that could have been reached if you had exited at the high point is outputted. Note: partial exits are not taken into account; the maximum profit is calculated with the initial trade size.                                                         |
| Max. Loss During Trade   | Calculation analogous to “max. profit during trade”, here pertaining to the maximum loss during the trade.                                                                                                                                                                                                                                                                                                      |
| Strategy Tag             | You can categorize trades with tags and then have the total P\&L per strategy tag calculated in the later evaluation in the SummaryTag. In doing so, you can summarize several different signals of a strategy under one tag, giving you an overview of figures from the whole strategy.                                                                                                                        |
| Fees                     | incurred commissions.                                                                                                                                                                                                                                                                                                                                                                                           |
| Swap                     | amount you have to pay for financing overnight-short-positions or leveraged positions                                                                                                                                                                                                                                                                                                                           |
| Commentary               | allows you to see the previously entered comments or add a new comment (a double-click will open an editor, where you can also insert images).                                                                                                                                                                                                                                                                  |
| Entry Rating             | Rate your entry into the trade. You can select a text preset or create your own text ratings in the settings window. Each text rating has a specific number of stars assigned to it; 5 stars is the highest. You can change the number of stars per text preset in the settings tab.                                                                                                                            |
| Exit Rating              | Rate your exit from the trade; the principle is the same as the Entry Rating.                                                                                                                                                                                                                                                                                                                                   |
| Trade Management Rating  | Rate your trade management during the trade; the principle is the same as the Entry Rating.                                                                                                                                                                                                                                                                                                                     |
| Total Rating             | Here you see the automatically calculated overall rating for your trade. Based on how you have rated your entry, exit and the trade management, the total score is determined here. This score cannot be changed directly, but instead only by changing the Entry/Exit/Trade Management Ratings. The average of all Total Ratings is displayed at the very top of the Trading Journal as a star rating.         |
| Snapshot                 | The “Open” button opens a screenshot that is automatically created upon closing of the trade. You can set the chart template for the screenshot under Global Configuration->Chart-> Snapshot Template. By right-clicking on the “Open” button, you can also delete a screenshot again if you wish.                                                                                                              |

<figure><img src="https://docs.agenatrader.com/~gitbook/image?url=https%3A%2F%2F2805764894-files.gitbook.io%2F%7E%2Ffiles%2Fv0%2Fb%2Fgitbook-legacy-files%2Fo%2Fassets%252F-MKZSsJBtSP9L4sqIe_q%252F-MQC-woGmyPtYRVxRKz9%252F-MQC08Uzhn4kKpdXHtqF%252FTraderJournal.png%3Falt%3Dmedia%26token%3Db05e2aba-9044-4b88-8790-86a47cff690d&#x26;width=768&#x26;dpr=4&#x26;quality=100&#x26;sign=23e80a21&#x26;sv=1" alt=""><figcaption></figcaption></figure>

With a double mouse click on splitter bar you may open chart where selected trades was running:

<figure><img src="https://docs.agenatrader.com/~gitbook/image?url=https%3A%2F%2F2805764894-files.gitbook.io%2F%7E%2Ffiles%2Fv0%2Fb%2Fgitbook-legacy-files%2Fo%2Fassets%252F-MKZSsJBtSP9L4sqIe_q%252F-MQC-woGmyPtYRVxRKz9%252F-MQC0E0kEoop4bfabqnb%252FTrading%2520Journal.png%3Falt%3Dmedia%26token%3D48ea6722-9ab2-49ce-96c6-a0c60e31aef3&#x26;width=768&#x26;dpr=4&#x26;quality=100&#x26;sign=afed76c3&#x26;sv=1" alt=""><figcaption></figcaption></figure>

#### Performance graph Tab <a href="#performance-graph-tab" id="performance-graph-tab"></a>

| Available Columns | Explanation                                                                                                                                                                                                                                                                                        |
| ----------------- | -------------------------------------------------------------------------------------------------------------------------------------------------------------------------------------------------------------------------------------------------------------------------------------------------- |
| Amount            | Shows your performance per trade in absolute numbers (in the currency that you have selected in the Global Configuration -> General)                                                                                                                                                               |
| Percent           | Shows your performance per trade as a percentage value relative to the current account balance in the respective account in which the trade was carried out. The current account balance is always the account balance that was available on your account at the time of the closing of the trade. |
| Risk Multiple     | Here, your performance per trade is outputted as a risk multiple. For an explanation of risk multiples, please read more under “Initial Stop Price”. In this graph, the generated risk multiples are displayed.                                                                                    |
| Use Daily Chart   | When you activate “Use Daily Chart”, all your intraday trading activities on a daily basis are summarized. This means that per day, for the display, all trades that were closed on this day are accumulated.                                                                                      |

<figure><img src="https://docs.agenatrader.com/~gitbook/image?url=https%3A%2F%2F2805764894-files.gitbook.io%2F%7E%2Ffiles%2Fv0%2Fb%2Fgitbook-legacy-files%2Fo%2Fassets%252F-MKZSsJBtSP9L4sqIe_q%252F-MQC-woGmyPtYRVxRKz9%252F-MQC0KLk3d7h-tngix1W%252FTradeJournal%252B.png%3Falt%3Dmedia%26token%3De54cefd7-ab0c-4cf5-b232-ca4e18609ab8&#x26;width=768&#x26;dpr=4&#x26;quality=100&#x26;sign=4a6b76f6&#x26;sv=1" alt=""><figcaption></figcaption></figure>

#### **Indicators (TradingJournal+ Feature):** <a href="#indicators-tradingjournal-feature" id="indicators-tradingjournal-feature"></a>

In the new TradingJournal, you can load any indicator to your equity curve, from which you can draw new conclusions, e.g. whether your equity curve is currently below the average or above it. This provides you with valuable new insights about your trading performance and its development.

<figure><img src="https://docs.agenatrader.com/~gitbook/image?url=https%3A%2F%2F2805764894-files.gitbook.io%2F%7E%2Ffiles%2Fv0%2Fb%2Fgitbook-legacy-files%2Fo%2Fassets%252F-MKZSsJBtSP9L4sqIe_q%252F-MQC-woGmyPtYRVxRKz9%252F-MQC0QxxpVhJFXz-a60G%252FTradeJournal%252B1.png%3Falt%3Dmedia%26token%3D0270303c-ab2b-4145-b4f1-065fee66fe9d&#x26;width=768&#x26;dpr=4&#x26;quality=100&#x26;sign=37b70f6b&#x26;sv=1" alt=""><figcaption></figcaption></figure>

#### **Drawing objects (TradingJournal+ Feature):** <a href="#drawing-objects-tradingjournal-feature" id="drawing-objects-tradingjournal-feature"></a>

Just like in a normal chart, you can also use all possible drawing objects in the Performance Graph.

<figure><img src="https://docs.agenatrader.com/~gitbook/image?url=https%3A%2F%2F2805764894-files.gitbook.io%2F%7E%2Ffiles%2Fv0%2Fb%2Fgitbook-legacy-files%2Fo%2Fassets%252F-MKZSsJBtSP9L4sqIe_q%252F-MQC-woGmyPtYRVxRKz9%252F-MQC0VhZi8XBih2plK7s%252FTradeJournal%252B2.png%3Falt%3Dmedia%26token%3D57f86cb4-c78b-434a-b031-061de33eab1c&#x26;width=768&#x26;dpr=4&#x26;quality=100&#x26;sign=dca4d3f5&#x26;sv=1" alt=""><figcaption></figcaption></figure>

#### **Benchmark (TradingJournal+ Feature):** <a href="#benchmark-tradingjournal-feature" id="benchmark-tradingjournal-feature"></a>

You can only activate the Benchmark function if you are using “Percent” as a display method and additionally activate “Use daily chart”. The Benchmark dropdown is then enabled, and you can choose from one of the biggest, most informative indices worldwide, which is then placed in the chart as a comparative marker. You can now rate how good your own performance is in comparison to the selected index. For the index as well as for your own trading result, the percentage changes are shown per day and can therefore be compared. If your percent equity curve is above the index, you have beaten the market. If you click and hold the left mouse button in the chart, you can view the value of your equity curve as well as the percent value of the Benchmark at any time in the DataBox, enabling you to also carry out more detailed evaluations.

<figure><img src="https://docs.agenatrader.com/~gitbook/image?url=https%3A%2F%2F2805764894-files.gitbook.io%2F%7E%2Ffiles%2Fv0%2Fb%2Fgitbook-legacy-files%2Fo%2Fassets%252F-MKZSsJBtSP9L4sqIe_q%252F-MQC-woGmyPtYRVxRKz9%252F-MQC0akujHxLL3Y0Nvys%252FTradeJournal%252B3.png%3Falt%3Dmedia%26token%3D29a6089f-9210-4208-a9fc-0b94d95173c0&#x26;width=768&#x26;dpr=4&#x26;quality=100&#x26;sign=7656a9c6&#x26;sv=1" alt=""><figcaption></figcaption></figure>

#### Summary Tab (TradingJournal+ Feature): <a href="#summary-tab-tradingjournal-feature" id="summary-tab-tradingjournal-feature"></a>

| Available Columns | Explanation                                                                                                                                                                                                                                                                                                                                                                                                                                                                                                                                      |
| ----------------- | ------------------------------------------------------------------------------------------------------------------------------------------------------------------------------------------------------------------------------------------------------------------------------------------------------------------------------------------------------------------------------------------------------------------------------------------------------------------------------------------------------------------------------------------------ |
| Key Metrics       | The core element of the TradingJournal is the rating of the trading figures – here you can examine all figures that have been calculated for all trades that you have loaded in the JournalTab. The calculation of the figures was taken from the backtest module; for a description of the individual values, please read more in the description of the backtest module. [Backtest](https://docs.agenatrader.com/main/main-menu/backtest)                                                                                                      |
| Best Performers   | Here, the 10 best and 10 worst instruments are listed, calculated for the net profit & loss per instrument.                                                                                                                                                                                                                                                                                                                                                                                                                                      |
| P\&L Trade Graph  | This displays graphs that depict your profit & loss per day, per week, per month and per trade.                                                                                                                                                                                                                                                                                                                                                                                                                                                  |
| P\&L Time Graph   | This displays graphs that depict your profit & loss for every weekday and in periods of 2 hours at a time. Each of your trades is assigned to the weekday and the 2-hour interval in which it was closed. In the x-axis, you can see by the number in brackets how many trades have been assigned to the weekday/time span. These graphs make it very easy to closely analyze whether there are weekdays or time intervals in your trading that turn out particularly positively/negatively.                                                     |
| Win/Loss Graph    | In this graph, you see the depiction of your ratio of profit-to-loss trades and overall profit to overall loss.                                                                                                                                                                                                                                                                                                                                                                                                                                  |
| Long/Short Graph  | In this graph, you see the depiction of how many long and short trades you have carried out.                                                                                                                                                                                                                                                                                                                                                                                                                                                     |
| Strategy Ranking  | In the Strategy Ranking, you can right-click to select whether strategy tags should be used or not. If you activate “Use tags”, the P\&L for all trades to which you have assigned the respective tag is shown cumulatively. In the second column, you also see the number of trades that were assigned to this tag. If you deactivate “Use tags”, the cumulative P\&L and the number of trades for each entry signal traded at least once is displayed. All trades that were started without an AT++ strategy are displayed as “Discretionary”. |

#### Trade Collection Tab (TradingJournal+ Feature) <a href="#trade-collection-tab-tradingjournal-feature" id="trade-collection-tab-tradingjournal-feature"></a>

The TradeCollection is a “photo album” of your trades: a screenshot of all closed trades is automatically created, and then appears in the TradeCollection. In addition, all important information for every trade is displayed next to the screenshot. If you have already written comments on a trade in the JournalTab or in the TradesTab, these are synchronized and similarly displayed here in the comment field for every trade. The TotalRating, which you can assign yourself for every trade in the JournalTab, is also displayed here, so that you can see at a glance how you yourself have rated a trade. The TradeCollection gives you the opportunity to study and understand your trades after the fact in order to recognize errors and learn from them, which is one of the most important processes for a trader – whether beginner or pro.

<figure><img src="https://docs.agenatrader.com/~gitbook/image?url=https%3A%2F%2F2805764894-files.gitbook.io%2F%7E%2Ffiles%2Fv0%2Fb%2Fgitbook-legacy-files%2Fo%2Fassets%252F-MKZSsJBtSP9L4sqIe_q%252F-MQC-woGmyPtYRVxRKz9%252F-MQC0gEO3Z4peR7GPh-I%252FTradeJournal%252B5.png%3Falt%3Dmedia%26token%3D981a9eff-9e96-43e0-8f99-5c799d39cda0&#x26;width=768&#x26;dpr=4&#x26;quality=100&#x26;sign=8c9455ee&#x26;sv=1" alt=""><figcaption></figcaption></figure>

#### Settings Tab <a href="#settings-tab" id="settings-tab"></a>

In this Tab you can set how many stars a specific rating should receive, in addition you can create your own rating-texts which you then can use for your trade-ratings in the JournalTab.

<figure><img src="https://docs.agenatrader.com/~gitbook/image?url=https%3A%2F%2F2805764894-files.gitbook.io%2F%7E%2Ffiles%2Fv0%2Fb%2Fgitbook-legacy-files%2Fo%2Fassets%252F-MKZSsJBtSP9L4sqIe_q%252F-MQC-woGmyPtYRVxRKz9%252F-MQC0lHaM5KCsEFPsuee%252FTradeJournal%252B6.png%3Falt%3Dmedia%26token%3D1ddafe17-8cc4-4d69-97ac-85d994068ed4&#x26;width=768&#x26;dpr=4&#x26;quality=100&#x26;sign=43226ea4&#x26;sv=1" alt=""><figcaption></figcaption></figure>

## <img src="/files/RAoYmvIROhCbu0szOVlb" alt="" data-size="line"> Backtest

#### General Information <a href="#general_information" id="general_information"></a>

The Backtest has been implemented as a key feature for analyzing the performance of a strategy on a historical basis. It is possible to backtest a strategy for a single instrument (security) or instrument list (portfolio).

**Running a** backtest **will require:**

* Historical data from a [datafeed](https://docs.agenatrader.com/main/broker-and-datafeed-connections)
* [AgenaScript](https://docs.agenatrader.com/faq/more-help#agenascript) or [strategy](https://docs.agenatrader.com/main/chart-area/untitled/strategies)
* Imported strategy

With AgenaTrader Discovery and higher: AgenaTrader++ (plusplus) strategy.

In order to open the backtest window select **Backtest** by using **Main -> New**.

<figure><img src="https://docs.agenatrader.com/~gitbook/image?url=https%3A%2F%2F2805764894-files.gitbook.io%2F%7E%2Ffiles%2Fv0%2Fb%2Fgitbook-legacy-files%2Fo%2Fassets%252F-MKZSsJBtSP9L4sqIe_q%252F-MQC159mMEMz-FyE1WhM%252F-MQC1DjTlg-MTmr1VuY3%252FBacktest.png%3Falt%3Dmedia%26token%3D3d4e9d44-a958-4d8e-a2f3-4a4fd4862569&#x26;width=768&#x26;dpr=4&#x26;quality=100&#x26;sign=64dc7d9&#x26;sv=1" alt=""><figcaption></figcaption></figure>

**Workflow:**&#x20;

● Choose your Analyzer Session in SetupEscort \
● Define your Entry-, Stop- and Target-parameter in SetupEscort \
● Choose Main / New -> Backtest ● Choose your strategy in “General Options” (e.g.: AT++) \
● Choose a data source, e.g. “Datafeed” or “File with ticks” (you need to download and/or select from file) \
● Define a timeframe ● Select an InstrumentList (optional: you can additionally choose one specific instrument by simply clicking on it) \
● Set start and end times (date and time) \
● Go to the tabs and click on “Settings” \
● Choose your entry signal in “Backtest Parameters” and check if stops and targets match your settings in SetupEscort. Yet you have the chance to chance those settings here. Confirm by clicking “Save Setup”. \
● Go to “Parameters” and choose your Analyzer Session \
● Define other settings like amount of bars, buying power and so on. \
● Confirm by clicking “Save Setup”. Please note: If you have changed your setup in “Backtest Parameters”, you overwrite your settings in SetupEscort when clicking “Save Setup”. \
● Start your backtest by clicking “Run”. Now you can choose if you want to backtest your strategy on a selected instrument or on the whole list. \
● In the area below your InstrumentList you can watch the progress of calculation or stop it.

<figure><img src="https://docs.agenatrader.com/~gitbook/image?url=https%3A%2F%2F2805764894-files.gitbook.io%2F%7E%2Ffiles%2Fv0%2Fb%2Fgitbook-legacy-files%2Fo%2Fassets%252F-MKZSsJBtSP9L4sqIe_q%252F-MQC159mMEMz-FyE1WhM%252F-MQC1O3q8LSlWrO3KOXi%252FBacktest.jpg%3Falt%3Dmedia%26token%3D8c3923a3-e369-477b-8b17-df15f89c7c33&#x26;width=768&#x26;dpr=4&#x26;quality=100&#x26;sign=a1b79ef4&#x26;sv=1" alt=""><figcaption></figcaption></figure>

#### General Options <a href="#general_options" id="general_options"></a>

The **Input Tab** allows the following settings:

| Parameter        | Meaning                                                                                                                                                                                                                 |
| ---------------- | ----------------------------------------------------------------------------------------------------------------------------------------------------------------------------------------------------------------------- |
| Start Date\&Time | Choose date and time at which the backtesting should start.                                                                                                                                                             |
| End Date\&Time   | Choose date and time at which the backtesting should end.                                                                                                                                                               |
| Instrument Lists | Choose an instrument list.                                                                                                                                                                                              |
| Time-Frame       | Time interval for data representation on a chart e.g. 1Min, 1hour, 1Day.                                                                                                                                                |
| Strategy         | Choose a strategy (e.g. self programmed or AT++). An AT++ strategy must be created with the [Setup Builder](https://docs.agenatrader.com/create-your-own-trading-strategy/setup-escort) and chosen in the Settings tab. |
| Run              | Here you can choose between a selected (single) instrument or an instrument list (portfolio); this starts the backtest.                                                                                                 |
| Open             | Allows to open a backtest result saved in the past.                                                                                                                                                                     |
| Data Source      | Define if a datafeed or a file is used to calculate the backtest. Possible files: with bars or with ticks. The file should not contain a header.                                                                        |

<figure><img src="https://docs.agenatrader.com/~gitbook/image?url=https%3A%2F%2F2805764894-files.gitbook.io%2F%7E%2Ffiles%2Fv0%2Fb%2Fgitbook-legacy-files%2Fo%2Fassets%252F-MKZSsJBtSP9L4sqIe_q%252F-MQC159mMEMz-FyE1WhM%252F-MQC1c32UmwOZUjhWN6M%252FgeneralOptionsBacktest.png%3Falt%3Dmedia%26token%3D5218b00d-93d0-43fc-8a4b-079166cab6b5&#x26;width=768&#x26;dpr=4&#x26;quality=100&#x26;sign=f43ccaf9&#x26;sv=1" alt=""><figcaption></figcaption></figure>

**Result tab** offers the following possibilities:

| Parameter   | Meaning                                 |
| ----------- | --------------------------------------- |
| View Type   | Choose between Amount, Percent or Ticks |
| Save Result | Saves the backtest result               |

#### Settings tab <a href="#settings_tab" id="settings_tab"></a>

This tab shows two types of strategies: **1. Self programmed or imported strategies**

The parameters of the strategy can be edited.

Additional parameters:

* Buying Power
* Cash Value
* Commission
* Slippage

<figure><img src="https://docs.agenatrader.com/~gitbook/image?url=https%3A%2F%2F2805764894-files.gitbook.io%2F%7E%2Ffiles%2Fv0%2Fb%2Fgitbook-legacy-files%2Fo%2Fassets%252F-MKZSsJBtSP9L4sqIe_q%252F-MQC159mMEMz-FyE1WhM%252F-MQC1gzlKYXGn-yvIoeb%252Fbacktest_settings.png%3Falt%3Dmedia%26token%3D175f309d-a520-4b7b-a1f5-a8c2976bad0f&#x26;width=768&#x26;dpr=4&#x26;quality=100&#x26;sign=779216ea&#x26;sv=1" alt=""><figcaption></figcaption></figure>

**2. AgenaTrader++ Strategies** The AT++ parameters are mainly the same as the above, with just a few slight differences:

* The Backtest Parameters category contains the parameters from the **Setup Builder**
* The Parameters category allows you to select an **Analyzer Column session from the Setup Builder**
* It is possible to save the manually edited settings with the **Save Setup** button
  * Saving the setup will overwrite the Setup Builder.

<figure><img src="https://docs.agenatrader.com/~gitbook/image?url=https%3A%2F%2F2805764894-files.gitbook.io%2F%7E%2Ffiles%2Fv0%2Fb%2Fgitbook-legacy-files%2Fo%2Fassets%252F-MKZSsJBtSP9L4sqIe_q%252F-MQC159mMEMz-FyE1WhM%252F-MQC1keBl0LBfgenfENO%252FsettingsBacktest.png%3Falt%3Dmedia%26token%3Da27917c1-1903-4126-b948-d8b754e6e262&#x26;width=768&#x26;dpr=4&#x26;quality=100&#x26;sign=84531648&#x26;sv=1" alt=""><figcaption></figcaption></figure>

The following functions are available under the category "Trading":

| Function                        | Description                                                                                                                                                                                                                                                                                                                                                                                                                                                                                                                                                                                                                                                                                                                                                                                                                                                                                                                                                                                                                                                                                                                                                                                                                                                                                                                                                                                                                                                                                                               |
| ------------------------------- | ------------------------------------------------------------------------------------------------------------------------------------------------------------------------------------------------------------------------------------------------------------------------------------------------------------------------------------------------------------------------------------------------------------------------------------------------------------------------------------------------------------------------------------------------------------------------------------------------------------------------------------------------------------------------------------------------------------------------------------------------------------------------------------------------------------------------------------------------------------------------------------------------------------------------------------------------------------------------------------------------------------------------------------------------------------------------------------------------------------------------------------------------------------------------------------------------------------------------------------------------------------------------------------------------------------------------------------------------------------------------------------------------------------------------------------------------------------------------------------------------------------------------- |
| Enable Trading Breaks           | Trading breaks set in the **Market Place Escort** are either taken into consideration or not. If this parameter is set to „true“, then the backtest only calculates its results within the trading times set in AgenaTrader. Pre- or post-market movements are not taken into account.                                                                                                                                                                                                                                                                                                                                                                                                                                                                                                                                                                                                                                                                                                                                                                                                                                                                                                                                                                                                                                                                                                                                                                                                                                    |
| Last Opened Trade Handling Mode | If the last trade cannot be completed during the backtest, then you can select whether this trade should be closed anyway (Option: Close) or stay open (LeaveOpen). With „LeaveOpen“, the last trade is not included in the Profit\&Loss calculation.                                                                                                                                                                                                                                                                                                                                                                                                                                                                                                                                                                                                                                                                                                                                                                                                                                                                                                                                                                                                                                                                                                                                                                                                                                                                     |
| Orders Handling Mode            | Standard or Advanced. Further functions for **Advanced**: Orders settings [![Dot](https://docs.agenatrader.com/~gitbook/image?url=https%3A%2F%2Fagenatrader.com%2Fwiki%2Ftiki-download_file.php%3FfileId%3D22%26display\&width=300\&dpr=4\&quality=100\&sign=5ef5815b\&sv=1) ](https://agenatrader.com/wiki/tiki-download_file.php?fileId=22\&display)*Calculate Entry Market Orders On Close*: Options „true“ or „false“. [![Dot](https://docs.agenatrader.com/~gitbook/image?url=https%3A%2F%2Fagenatrader.com%2Fwiki%2Ftiki-download_file.php%3FfileId%3D22%26display\&width=300\&dpr=4\&quality=100\&sign=5ef5815b\&sv=1) ](https://agenatrader.com/wiki/tiki-download_file.php?fileId=22\&display)*Calculate Exit Market Orders On Close*: Options „true“ or „false“. The standard setting is based on the Backtest Standard Mode. Here, market orders are always calculated with the next open of the candle. This function can be changed in Advanced, as a result of which the close of the candle is also used. [![Dot](https://docs.agenatrader.com/~gitbook/image?url=https%3A%2F%2Fagenatrader.com%2Fwiki%2Ftiki-download_file.php%3FfileId%3D22%26display\&width=300\&dpr=4\&quality=100\&sign=5ef5815b\&sv=1) ](https://agenatrader.com/wiki/tiki-download_file.php?fileId=22\&display)*Decision Mode*: - Best Case: unclear orders are calculated with the best possible result. - Worst Case: unclear orders are calculated with the worst result that could occur. - Ignore: unclear orders are ignored. |

#### Data Source <a href="#data_source" id="data_source"></a>

<figure><img src="https://docs.agenatrader.com/~gitbook/image?url=https%3A%2F%2F2805764894-files.gitbook.io%2F%7E%2Ffiles%2Fv0%2Fb%2Fgitbook-legacy-files%2Fo%2Fassets%252F-MKZSsJBtSP9L4sqIe_q%252F-MQC159mMEMz-FyE1WhM%252F-MQC1v5Dn9blqLlar4ca%252Fbacktesting_data_source.png%3Falt%3Dmedia%26token%3D5f70f49b-254f-4167-bfdb-634a529d2da7&#x26;width=768&#x26;dpr=4&#x26;quality=100&#x26;sign=4474c7c&#x26;sv=1" alt=""><figcaption></figcaption></figure>

**Possible options are:** - Datаfeed (e.g. YFeed etc. or a datafeed from a broker) - File with Bars - File with Ticks

File format and data format for data from a file:

**File with Bars**: .csv and .txt

<figure><img src="https://docs.agenatrader.com/~gitbook/image?url=https%3A%2F%2F2805764894-files.gitbook.io%2F%7E%2Ffiles%2Fv0%2Fb%2Fgitbook-legacy-files%2Fo%2Fassets%252F-MKZSsJBtSP9L4sqIe_q%252F-MQC159mMEMz-FyE1WhM%252F-MQC1yl4j9tVzTZ3RQyZ%252Fbacktesting_data_source_code1.png%3Falt%3Dmedia%26token%3Ddcef98c8-1d6f-4790-8c0d-9a11dd0e7894&#x26;width=768&#x26;dpr=4&#x26;quality=100&#x26;sign=3eba4be9&#x26;sv=1" alt=""><figcaption></figcaption></figure>

**File with Ticks**: .csv and .txt

<figure><img src="https://docs.agenatrader.com/~gitbook/image?url=https%3A%2F%2F2805764894-files.gitbook.io%2F%7E%2Ffiles%2Fv0%2Fb%2Fgitbook-legacy-files%2Fo%2Fassets%252F-MKZSsJBtSP9L4sqIe_q%252F-MQC159mMEMz-FyE1WhM%252F-MQC21DoU2pNLx3D7UQO%252Fbacktesting_data_source_code2.png%3Falt%3Dmedia%26token%3Da47678ef-c9bd-47c3-ae7c-8c0aeaaef03d&#x26;width=768&#x26;dpr=4&#x26;quality=100&#x26;sign=c7702b5&#x26;sv=1" alt=""><figcaption></figcaption></figure>

#### Charts tab <a href="#charts_tab" id="charts_tab"></a>

The **Charts tab** is divided into the **equity curve** and the **chart history**. The equity curve contains information either about one instrument (security) or an entire instrument list (portfolio), while the chart history is always for one instrument only.

<figure><img src="https://docs.agenatrader.com/~gitbook/image?url=https%3A%2F%2F2805764894-files.gitbook.io%2F%7E%2Ffiles%2Fv0%2Fb%2Fgitbook-legacy-files%2Fo%2Fassets%252F-MKZSsJBtSP9L4sqIe_q%252F-MQC159mMEMz-FyE1WhM%252F-MQC24y-BYmeC4Cwniqa%252FBacktest%281%29.jpg%3Falt%3Dmedia%26token%3D28fef4d2-b3eb-48f7-8ae8-7d6dbfd10017&#x26;width=768&#x26;dpr=4&#x26;quality=100&#x26;sign=1a208647&#x26;sv=1" alt=""><figcaption></figcaption></figure>

The functions **Show**, **Equity** and **X Axis** are only available after a backtest has been generated.

**Equity curve representation**

* If the option **Show All** is active, the equity curve shows all trades of the backtesting result.
* If the option **Show Chart** is active, the equity curve shows all trades within the charting history area (zoom).

Both options have also an impact on other tabs too:&#x20;

<figure><img src="https://docs.agenatrader.com/~gitbook/image?url=https%3A%2F%2F2805764894-files.gitbook.io%2F%7E%2Ffiles%2Fv0%2Fb%2Fgitbook-legacy-files%2Fo%2Fassets%252F-MKZSsJBtSP9L4sqIe_q%252F-MQC159mMEMz-FyE1WhM%252F-MQC28QVkUvl3yrPp_TB%252Fbacktest_charts2.png%3Falt%3Dmedia%26token%3D99389223-196d-4e3c-8d17-1192745d32b3&#x26;width=300&#x26;dpr=4&#x26;quality=100&#x26;sign=6644cf27&#x26;sv=1" alt=""><figcaption></figcaption></figure>

In the same manner:

* If the option **Show All** is active, then results of the tabs Summary, Trades, Orders, Executions, Periods and Trading Info are calculated for all trades.
* If the option **Show Chart** is active, then results of the tabs Summary, Trades, Orders, Executions, Periods and Trading Info are only calculated for those trades within the charting history area (zoom).

<figure><img src="https://docs.agenatrader.com/~gitbook/image?url=https%3A%2F%2F2805764894-files.gitbook.io%2F%7E%2Ffiles%2Fv0%2Fb%2Fgitbook-legacy-files%2Fo%2Fassets%252F-MKZSsJBtSP9L4sqIe_q%252F-MQC159mMEMz-FyE1WhM%252F-MQC2CGlxasIvjRf2HKB%252Fbacktest_charts3.png%3Falt%3Dmedia%26token%3D87c9b9f9-a53a-4975-9c48-ac4ac620dcaf&#x26;width=768&#x26;dpr=4&#x26;quality=100&#x26;sign=575139c7&#x26;sv=1" alt=""><figcaption></figcaption></figure>

* **Equity Single**: displays only the selected instrument
* **Equity All**: displays all instruments of the instrument list (portfolio) and draws a curve for each instrument.
* **Equity Account**: displays all instruments of the instrument list (portfolio) in one curve.

**Please Note! The options** Show All or Show Chart have **no impact** if the Equity options are set to **All** or **Account**. The above mentioned other tabs will calculate there results on all trades only and not for a specific area of the chart history window.

The **X Axis** options allow the user to display the equity curve either with Date & Profil/Loss or Trades & Profit/Loss.

**Navigation** There are two zoom options for analyzing the results:

1. mouse wheel
2. click and hold right mouse button and select an area in the chart history or equity curve.

As mentioned above, the **Show All** or **Show Chart** options have an impact on the displayed of the equity curve and the results in the other tabs. If the option **Show Chart** is active, then zooming within the chart history will also zoom within the equity curve. If the option **Show All** is active, then the chart history zoom has no impact on the equity curve. Zooming within the equity curve, on the other hand, always has an impact on the chart history.

**Context menu**

*There are several options in the context menu:*

* Copy
* Save Image As...
* Page Setup... (for printing)
* Print...
* Show Point Values
* Set Scale to Default

<figure><img src="https://docs.agenatrader.com/~gitbook/image?url=https%3A%2F%2F2805764894-files.gitbook.io%2F%7E%2Ffiles%2Fv0%2Fb%2Fgitbook-legacy-files%2Fo%2Fassets%252F-MKZSsJBtSP9L4sqIe_q%252F-MQC159mMEMz-FyE1WhM%252F-MQC2MC196716CyO-Lol%252Fbacktest_charts_context.png%3Falt%3Dmedia%26token%3Df71e11bb-d493-4f46-8373-460cecd43b23&#x26;width=768&#x26;dpr=4&#x26;quality=100&#x26;sign=ce1052fa&#x26;sv=1" alt=""><figcaption></figcaption></figure>

*Context menu Graph:*

* Cumulative Profit
* Daily Net Profit
* Entry Efficiency
* Exit Efficiency
* MAE
* MFE
* Monthly Net Profit
* Weekly Net Profit
* Total Efficiency
* Trade Profit/Loss

<figure><img src="https://docs.agenatrader.com/~gitbook/image?url=https%3A%2F%2F2805764894-files.gitbook.io%2F%7E%2Ffiles%2Fv0%2Fb%2Fgitbook-legacy-files%2Fo%2Fassets%252F-MKZSsJBtSP9L4sqIe_q%252F-MQC159mMEMz-FyE1WhM%252F-MQC2QZuVmYmI7cy-zee%252Fbacktest_charts_graph.png%3Falt%3Dmedia%26token%3D8095397d-a50e-4f81-9fe4-1d5b538b5244&#x26;width=768&#x26;dpr=4&#x26;quality=100&#x26;sign=51fb14eb&#x26;sv=1" alt=""><figcaption></figcaption></figure>

*Context menu Trades:*

* All
* Long
* Short

<figure><img src="https://docs.agenatrader.com/~gitbook/image?url=https%3A%2F%2F2805764894-files.gitbook.io%2F%7E%2Ffiles%2Fv0%2Fb%2Fgitbook-legacy-files%2Fo%2Fassets%252F-MKZSsJBtSP9L4sqIe_q%252F-MQC159mMEMz-FyE1WhM%252F-MQC2TqK1Mt-0sbAZo6f%252Fbacktest_charts_trades.png%3Falt%3Dmedia%26token%3D4a8b1c08-29c0-43ae-bbec-30e7552bbf57&#x26;width=768&#x26;dpr=4&#x26;quality=100&#x26;sign=9eebce9&#x26;sv=1" alt=""><figcaption></figcaption></figure>

*Context menu Winning/Losing:*

* All
* Winning
* Losing

<figure><img src="https://docs.agenatrader.com/~gitbook/image?url=https%3A%2F%2F2805764894-files.gitbook.io%2F%7E%2Ffiles%2Fv0%2Fb%2Fgitbook-legacy-files%2Fo%2Fassets%252F-MKZSsJBtSP9L4sqIe_q%252F-MQC159mMEMz-FyE1WhM%252F-MQC2Xjxd4bNT5MQxBCT%252Fbacktest_charts_winning_losing.png%3Falt%3Dmedia%26token%3Df0eccbf4-21ab-49cf-9076-763e1bb95dc3&#x26;width=768&#x26;dpr=4&#x26;quality=100&#x26;sign=5dee1d9d&#x26;sv=1" alt=""><figcaption></figcaption></figure>

#### Summary tab <a href="#summary_tab" id="summary_tab"></a>

As the name implies, the **Summary tab** contains a summary of trading results.

<figure><img src="https://docs.agenatrader.com/~gitbook/image?url=https%3A%2F%2F2805764894-files.gitbook.io%2F%7E%2Ffiles%2Fv0%2Fb%2Fgitbook-legacy-files%2Fo%2Fassets%252F-MKZSsJBtSP9L4sqIe_q%252F-MQC159mMEMz-FyE1WhM%252F-MQC2bM6cssusGu_AcZr%252Fbacktest_summary.png%3Falt%3Dmedia%26token%3D07c988ce-bf56-4b73-a2ca-6a6b2ca493e1&#x26;width=768&#x26;dpr=4&#x26;quality=100&#x26;sign=f990f136&#x26;sv=1" alt=""><figcaption></figcaption></figure>

**Indicator explanations** The Indicator results are divided into three columns: all long and short trades together, long trades only and short trades only.

| Parameter                                 | Meaning                                                                                                                                                                                                                                           |
| ----------------------------------------- | ------------------------------------------------------------------------------------------------------------------------------------------------------------------------------------------------------------------------------------------------- |
| Total Net Profit                          | Total net profit (gross profit minus gross loss)                                                                                                                                                                                                  |
| Gross Profit                              | Profit generated by all your trades within the specified date & time period                                                                                                                                                                       |
| Gross Loss                                | Loss generated by all your trades within the specified date & time period                                                                                                                                                                         |
| Profit Factor                             | Gross profit divided by gross loss (e.g. 1 = profit and loss is the same)                                                                                                                                                                         |
| Cumulative Profit                         | Cumulative profit of previous periods                                                                                                                                                                                                             |
| Maximum Drawdown                          | Maximum loss in one trading sequence                                                                                                                                                                                                              |
| Commission                                | Commission generated for the broker                                                                                                                                                                                                               |
| Total Number of Trades                    | Monetary number of all trades                                                                                                                                                                                                                     |
| Winning Trades                            | Monetary number of all winnings trades                                                                                                                                                                                                            |
| Losing Trades                             | Monetary number of all losing trades                                                                                                                                                                                                              |
| Average Trade                             | Average profit or loss per trades                                                                                                                                                                                                                 |
| Average Winning Trade                     | Average profit or winning trades                                                                                                                                                                                                                  |
| Average Losing Trade                      | Average loss of losing trades                                                                                                                                                                                                                     |
| Ration (Win/loss)                         | Ratio of wins to losses                                                                                                                                                                                                                           |
| Maximum Consequence Winners               | Number or consecutively winning trades                                                                                                                                                                                                            |
| Maximum Consequence Losers                | Number or consecutively losing trades                                                                                                                                                                                                             |
| Largest Winning Trade                     | Highest profit of a trade                                                                                                                                                                                                                         |
| Largest Losing Trade                      | Highest loss of a trade                                                                                                                                                                                                                           |
| Number of Trades per Day                  | Total number of trades per day                                                                                                                                                                                                                    |
| Average Time in Market (Min)              | Average time your trades are in the market (in minutes)                                                                                                                                                                                           |
| Average Bars in Trade                     | Average number of bars of the trades in the market                                                                                                                                                                                                |
| Profit per Month                          | Monthly profit generated by all your trades                                                                                                                                                                                                       |
| Average MAE(maximum adverse excursion)    | Average value on maximum run-down your strategy experiences against the initial entry point. It is a calculation on how effective the strategy can predict price movements. A low number indicates a very effective strategy.                     |
| Average MFE (maximum favorable excursion) | Average value on maximum run-up your strategy experiences in favor of the initial entry point. It is a calculation on how effective the strategy can predict price movements. A high number indicates a very effective strategy.                  |
| Average ETD                               | Average value on how effective the exit condition is at capturing the desired price movement. It displays the difference between the best price possible (MFE) and the actual exit price. A low number indicates a very effective exit condition. |

#### Trades tab <a href="#trades_tab" id="trades_tab"></a>

The **Trades tab** contains all trades from the backtesting summary. Right clicking on the column names opens the context menu, which allows you to add or remove columns using the **Choose columns** window. Right clicking on the trades list allows you to export the list as MS Excel document.

<figure><img src="https://docs.agenatrader.com/~gitbook/image?url=https%3A%2F%2F2805764894-files.gitbook.io%2F%7E%2Ffiles%2Fv0%2Fb%2Fgitbook-legacy-files%2Fo%2Fassets%252F-MKZSsJBtSP9L4sqIe_q%252F-MQC159mMEMz-FyE1WhM%252F-MQC2g9xHbTXXmjskK1r%252FBacktestKumPnL.png%3Falt%3Dmedia%26token%3D72047c32-c405-4791-bd5b-beab0122ee17&#x26;width=768&#x26;dpr=4&#x26;quality=100&#x26;sign=c8a2be23&#x26;sv=1" alt=""><figcaption></figcaption></figure>

**Tip:** PnL shows profit and loss of the actual trade. The cumulative PnL (“Com. PnL”) shows total profit and loss of all trades so far. As you can see in the screenshot, top down - starting with the first PnL - the following PnL is subtracted respectively added on. Each new result you will find in “Com. PnL”-column, every following PnL will be added on or subtracted in a zigzag-mode down to the latest result of cumulated PnL. Please take into account that most minimal deviations might occur as the cumulated PnL is rounded to two decimal figures whereas prices sometimes are calculated to three or more decimal figures.

#### Orders tab <a href="#orders_tab" id="orders_tab"></a>

The **Orders tab** contains all orders from the backtesting summary. Right clicking on the column names opens the context menu, which allows you to add or remove columns using the **Choose columns** window. Right clicking on the trades list allows you to export the list as MS Excel document.

<figure><img src="https://docs.agenatrader.com/~gitbook/image?url=https%3A%2F%2F2805764894-files.gitbook.io%2F%7E%2Ffiles%2Fv0%2Fb%2Fgitbook-legacy-files%2Fo%2Fassets%252F-MKZSsJBtSP9L4sqIe_q%252F-MQC159mMEMz-FyE1WhM%252F-MQC2l3ZSvivFlPJOeD_%252Fbacktest_orders.png%3Falt%3Dmedia%26token%3D0c299a02-b227-4198-8279-c5c9c8edd754&#x26;width=768&#x26;dpr=4&#x26;quality=100&#x26;sign=e4ac3655&#x26;sv=1" alt=""><figcaption></figcaption></figure>

**Order execution description**

The Backtest simulates a real-time behavior in two different modes: **Mode No. 1** - Tick based (works in the same way as the simulation account). If the **current tick** touches an open order this tick price will be used as **fill price**. **Mode No. 2** - Candle based (simulates the tick based mode).

Each candle will be split in four pieces:

* growing candle: Open; High; Low; Close.
* falling candle: Open; Low; High; Close.

If e.g. the **High price** touches an open order this price will be used as **fill price**. The same is valid if an open order touches the Open, Low or Close price.

**Difference between Market, Stop and StopLimit order:** Market and Stop orders will be filled with the same candle. StopLimit orders will be filled with the next candle. **Example.** Assuming TimeFrame = 1 Day the StopLimit order will be filled on the next day, while the Stop order will be filled on the same day.

#### Executions tab <a href="#executions_tab" id="executions_tab"></a>

The **Executions tab** contains all order executions of the backtesting summary. Right clicking on the column names opens the context menu, which allows you to add or remove columns using the **Choose columns** window. Right clicking on the trades list allows you to export the list as MS Excel document.

<figure><img src="https://docs.agenatrader.com/~gitbook/image?url=https%3A%2F%2F2805764894-files.gitbook.io%2F%7E%2Ffiles%2Fv0%2Fb%2Fgitbook-legacy-files%2Fo%2Fassets%252F-MKZSsJBtSP9L4sqIe_q%252F-MQC159mMEMz-FyE1WhM%252F-MQC2po4gAVh6AxHMM1n%252Fbacktest_executions.png%3Falt%3Dmedia%26token%3D3d4833ba-1c96-43ee-8f4b-8c98bbb3bfde&#x26;width=768&#x26;dpr=4&#x26;quality=100&#x26;sign=b7f85077&#x26;sv=1" alt=""><figcaption></figcaption></figure>

#### Periods tab <a href="#periods_tab" id="periods_tab"></a>

The **Periods tab** contains a summary of the backtesting results based on various calendar settings. Right clicking on the column names opens the context menu, which allows you to add or remove columns using the **Choose columns** window. Right clicking on the list allows you to export the list as MS Excel document and choose the period type.

Possible period types are:

* Annual
* Monthly
* Weekly
* Day of Week
* Daily
* Hour of Day

![](https://docs.agenatrader.com/~gitbook/image?url=https%3A%2F%2F2805764894-files.gitbook.io%2F%7E%2Ffiles%2Fv0%2Fb%2Fgitbook-legacy-files%2Fo%2Fassets%252F-MKZSsJBtSP9L4sqIe_q%252F-MQC159mMEMz-FyE1WhM%252F-MQC2uw28CLFFXA974Vr%252Fbacktest_periods.png%3Falt%3Dmedia%26token%3D35ce2cef-d1a5-4fb1-b1e9-3038e3041265\&width=768\&dpr=4\&quality=100\&sign=dd0a7e74\&sv=1)![](https://docs.agenatrader.com/~gitbook/image?url=https%3A%2F%2F2805764894-files.gitbook.io%2F%7E%2Ffiles%2Fv0%2Fb%2Fgitbook-legacy-files%2Fo%2Fassets%252F-MKZSsJBtSP9L4sqIe_q%252F-MQC159mMEMz-FyE1WhM%252F-MQC2zU1MS7VCRzKny5K%252Fbacktest_periods1.png%3Falt%3Dmedia%26token%3D8f5b6148-31d7-4978-978b-d614c29ef50d\&width=768\&dpr=4\&quality=100\&sign=27e7ef2c\&sv=1)

#### Trading Info tab <a href="#trading_info_tab" id="trading_info_tab"></a>

The **Trading Info tab** contains all information about the trade in a trading tree. It includes Partial Trades, Orders and Executions. Right clicking on the column names opens the context menu, which allows you to add or remove columns using the **Choose columns** window.

<figure><img src="https://docs.agenatrader.com/~gitbook/image?url=https%3A%2F%2F2805764894-files.gitbook.io%2F%7E%2Ffiles%2Fv0%2Fb%2Fgitbook-legacy-files%2Fo%2Fassets%252F-MKZSsJBtSP9L4sqIe_q%252F-MQC159mMEMz-FyE1WhM%252F-MQC33-D89Ip-KWZOWa8%252Fbacktest_trading_info.png%3Falt%3Dmedia%26token%3D25ae7cdf-a217-49fe-acb5-7577c09cf028&#x26;width=768&#x26;dpr=4&#x26;quality=100&#x26;sign=73726b92&#x26;sv=1" alt=""><figcaption></figcaption></figure>

#### Essential information <a href="#essential_information" id="essential_information"></a>

To backtest a trading signal it is necessary to set the correct history length required by the signal or condition. To do this the setting "Required bars count" must be defined. In general, the default setting of 20 bars is enough for most signals. If a signal or condition with the Signal Builder or via programming was created that requires more history (bars) the setting must be adjusted accordingly. Be aware that for the defined history (bars count) setting no signals/conditions can be calculated. Only the bars after that will show signals.

**Information for Dow Theory signals:** Signals created with Dow Theory indicators like the P123 require a long history to calculate the signals. At least 500 bars or more must be set. Note, that your datafeed or file must deliver enough history since the e.g. first 500 bars will not show any signals. Only the following bars will show them.

#### Further development from Standard to Advanced <a href="#further_development_from_standard_to_advanced" id="further_development_from_standard_to_advanced"></a>

In collaboration with the University of Aachen (Institute for Mathematics), the Backtest function of AgenaTrader has been further developed and the Advanced Mode has been created. The research paper by Dr. Stanislaus Maier-Paape and Dr. Andreas Platen indicates that a strategy in the Backtest only delivers results for historical data and cannot be a basis for live trade, since the future results can deviate substantially therefrom. Nevertheless, the function Backtest, which is offered by all leading software manufacturers, still plays an essential role in the quality of the software. A well-functioning backtest algorithm is necessary in order to develop a well-functioning trading system. The more accurately the results are calculated in the backtest, the more reliable the trading system is when it comes to live trading.

Furthermore, the research also demonstrates that despite very progressively developed algorithms and tests in the market, in some cases, the calculations are not outputted correctly. In one of these cases, one speaks of situations that cannot be clearly defined, for short SNU (situation which is not unique). In order to make it possible to also react to SNUs, the function "Decision Mode" was developed, which gives the user of the software the chance to make a decision. The following three settings can be made:

* Worst case: the SNU is evaluated based on the worst possible result.
* Best case: the SNU is evaluated based on the best possible result.
* Ignore: the entry signal or the whole trade is ignored.

SNUs only occur in connection with stop, limit and stop limit orders. Market orders can always be clearly defined.

## <img src="/files/mjXURFQefTJ4qA8g34yh" alt="" data-size="line"> Correlation Matrix

With the correlation matrix, you can compare the performance of individual instruments and even whole instrument lists in real-time (!) in any time based timeframe. The correlation matrix can be filled with all possible instruments; you can also compare instruments from various asset classes.

#### Opening the Correlation Matrix <a href="#opening_the_correlation_matrix" id="opening_the_correlation_matrix"></a>

Select Main -> New -> Correlation Matrix <img src="/files/mjXURFQefTJ4qA8g34yh" alt="" data-size="line">.

In the next window, you can select the following settings for the matrix:

| Name                     | Meaning                                                                                                                                                                             |
| ------------------------ | ----------------------------------------------------------------------------------------------------------------------------------------------------------------------------------- |
| Instrument list          | Here, select the instruments for which the correlation matrix should be created. For the selected list, the correlation between each contained value is calculated.                 |
| Periodicity / Interval   | Controls the timeframe on the basis of which the correlation between the instruments should be calculated                                                                           |
| Correlation period       | The number of periods in the respective timeframe that will be used for calculating the correlation. By default, the correlation is calculated based on the last 100 daily candles. |
| Bars Count / Time period | Number of bars to be loaded in the linked chart. Next to the correlation matrix you see a chart which will assume these settings.                                                   |
| Template                 | Chart template for the linked chart next to the matrix.                                                                                                                             |

<figure><img src="https://docs.agenatrader.com/~gitbook/image?url=https%3A%2F%2F2805764894-files.gitbook.io%2F%7E%2Ffiles%2Fv0%2Fb%2Fgitbook-legacy-files%2Fo%2Fassets%252F-MKZSsJBtSP9L4sqIe_q%252F-MQC3KIuq6PPoVEIxZQn%252F-MQC3Or7-leSXUDBcGWD%252FCorrelationMatrix_Settings.png%3Falt%3Dmedia%26token%3Da128ed5f-2c55-4b5a-a243-19d754aeeeaf&#x26;width=768&#x26;dpr=4&#x26;quality=100&#x26;sign=d11a8348&#x26;sv=1" alt=""><figcaption></figcaption></figure>

#### Matrix – View <a href="#matrix_view" id="matrix_view"></a>

By default, the correlation is displayed in the matrix view, which is a two-dimensional table with each symbol of the selected instrument list on the x-axis and y-axis respectively. The matrix is to be read in such a way that the intersection of a row with a column outputs the respective correlation coefficient of the two values to each other. The correlation coefficient is 100 when the same symbol is selected in the row and column. Using the plus icon in the top left corner of the matrix, you can add individual values to the matrix, for which the correlation coefficient will then be calculated for the entire instrument list again. When you click on an individual correlation coefficient, the corresponding value is loaded in the chart to the right of the matrix. In the process, the instrument from the selected column is loaded to the chart as the primary data series; the instrument from the selected row as the secondary data series and as a line chart. For this, the price axis is changed to percentage values, in order to make the two data series comparable. The first data point of the secondary data series begins at 0%; after this, the percentage changes per period are displayed in comparison to the primary data series. Addtionally if you click on a field in the matrix the InstrumentCorrelation indicator is loaded to the chart, find more details about the indicator below.

<figure><img src="https://docs.agenatrader.com/~gitbook/image?url=https%3A%2F%2F2805764894-files.gitbook.io%2F%7E%2Ffiles%2Fv0%2Fb%2Fgitbook-legacy-files%2Fo%2Fassets%252F-MKZSsJBtSP9L4sqIe_q%252F-MQC3KIuq6PPoVEIxZQn%252F-MQC3U8ZHRn1q_RByWML%252FCorrelationMatrix.png%3Falt%3Dmedia%26token%3D42ba3b67-2342-45ae-b543-0e8fc47a98fb&#x26;width=768&#x26;dpr=4&#x26;quality=100&#x26;sign=91e04a82&#x26;sv=1" alt=""><figcaption></figcaption></figure>

#### The Instrument Correlation Indicator <a href="#the_instrument_correlation_indicator" id="the_instrument_correlation_indicator"></a>

When you hover over a correlation coefficient with the mouse in the matrix, a pop-up appears showing a graphic display of the temporal development of the correlation coefficient. For the display, the “InstrumentsCorrelation” indicator is used, which is also loaded into the chart to the right of the matrix by default. This indicator calculates the historical correlation coefficient for every historical period and depicts it graphically. With this indicator, you can very easily monitor how the correlation has changed over time, i.e. whether the correlation between two values remains constant or is subject to strong fluctuations.

<figure><img src="https://docs.agenatrader.com/~gitbook/image?url=https%3A%2F%2F2805764894-files.gitbook.io%2F%7E%2Ffiles%2Fv0%2Fb%2Fgitbook-legacy-files%2Fo%2Fassets%252F-MKZSsJBtSP9L4sqIe_q%252F-MQC3KIuq6PPoVEIxZQn%252F-MQC3Yp3aJ0pBjMUvCiI%252FCorrelationMatrixIndicator.png%3Falt%3Dmedia%26token%3D18ca6650-e782-4878-b59d-6b947d552714&#x26;width=768&#x26;dpr=4&#x26;quality=100&#x26;sign=fa24038d&#x26;sv=1" alt=""><figcaption></figcaption></figure>

#### Settings <a href="#settings" id="settings"></a>

| Name          | Bedeutung                                                                                                                                                                                                                                                                                   |
| ------------- | ------------------------------------------------------------------------------------------------------------------------------------------------------------------------------------------------------------------------------------------------------------------------------------------- |
| “List” button | Using the “List” button in the top right, you can switch to the list view, where every instrument pair is now shown in the list and the corresponding correlation is displayed. The list is sorted in descending order; the highest correlation coefficients are shown as the first values. |
| Timeframe     | Using “Timeframe”, you can change the timeframe based on which the correlation should be calculated.                                                                                                                                                                                        |
| Periods       | Periods controls the number of historical periods that serve as a foundation for the correlation calculation.                                                                                                                                                                               |

<figure><img src="https://docs.agenatrader.com/~gitbook/image?url=https%3A%2F%2F2805764894-files.gitbook.io%2F%7E%2Ffiles%2Fv0%2Fb%2Fgitbook-legacy-files%2Fo%2Fassets%252F-MKZSsJBtSP9L4sqIe_q%252F-MQC3KIuq6PPoVEIxZQn%252F-MQC3d8yZcP481DUXcRS%252FCorrelationMatrixlast.png%3Falt%3Dmedia%26token%3Deedc4681-6288-4672-9c64-61d712502d23&#x26;width=768&#x26;dpr=4&#x26;quality=100&#x26;sign=63a95c27&#x26;sv=1" alt=""><figcaption></figcaption></figure>

By right-clicking in the matrix or the list, you can call up the correlation-specific display settings. You can set the values from which the cells should begin to be colored, and also the colors that should be used for a value of +100 and -100. The default color (= white) is used for values under the defined limit. Values located within the limit will be color-graded: the closer the value lies to +/- 100, the closer the background color will be to one of the two selected colors for the extreme values.

By default, a green background coloration begins at a value of +60, and values below -60 receive red background coloration.

**Important!** Correlation Matrix works only with time base charts. Please do not use chart templates with NonTimeBased Charts for the Correlation Matrix

#### The Correlation Coefficient <a href="#the_correlation_coefficient" id="the_correlation_coefficient"></a>

The correlation coefficient value measures the degree of the linear correlation between two values and can accept values between +1 and -1. In the correlation matrix, the values are multiplied by 100, which is why the coefficient in AgenaTrader oscillates between +100 and -100. For a value of +100, there is a completely positive correlation between the observed values, and the price development is completely identical, therefore if instrument A increases, price B increases too, whereby just using the correlation coefficient alone, one cannot extrapolate the ratio of the extent of the increase. For a value of -100, there is a completely inverse dependency – whenever instrument A increases, price B falls. You can find more detailed information on correlation coefficients under the following link:

<https://de.finance.yahoo.com/nachrichten/korrelation-133420148.html><br>

## <img src="/files/PAfko3qU4dSx04QVzRfC" alt="" data-size="line"> Style

You have the flexibility to tailor the look and feel of AgenaTrader with the following settings::

<figure><img src="https://docs.agenatrader.com/~gitbook/image?url=https%3A%2F%2F2805764894-files.gitbook.io%2F%7E%2Ffiles%2Fv0%2Fb%2Fgitbook-legacy-files%2Fo%2Fassets%252F-MKZSsJBtSP9L4sqIe_q%252F-MQC3l0dmZCpivZIGAO3%252F-MQC4coJ5FxS17tsjxMl%252FStyle.png%3Falt%3Dmedia%26token%3D2ec5ade2-b1ac-48d4-a8f0-f9489de87617&#x26;width=768&#x26;dpr=4&#x26;quality=100&#x26;sign=3529d373&#x26;sv=1" alt=""><figcaption></figcaption></figure>

## <img src="/files/fJp9K5ZlUAvBYYnov4OF" alt="" data-size="line">Backup

AgenaTrader offers you the possibility of creating a backup of the entire system. Should you ever lose data due to unforeseen circumstances, then the last data backup can be implemented to restore lost data.

In order to create a backup file select **Main->Backup/Restore->Backup**<img src="/files/fJp9K5ZlUAvBYYnov4OF" alt="" data-size="line">.

<figure><img src="https://docs.agenatrader.com/~gitbook/image?url=https%3A%2F%2F2805764894-files.gitbook.io%2F%7E%2Ffiles%2Fv0%2Fb%2Fgitbook-legacy-files%2Fo%2Fassets%252F-MKZSsJBtSP9L4sqIe_q%252F-MQC3l0dmZCpivZIGAO3%252F-MQC4hXOnFEtAS-aR2zO%252FBackup%2520advanced%2520way.PNG%3Falt%3Dmedia%26token%3Dbf59ebdb-9191-46b0-8a60-966e2490433d&#x26;width=768&#x26;dpr=4&#x26;quality=100&#x26;sign=1e63b9ec&#x26;sv=1" alt=""><figcaption></figcaption></figure>

{% hint style="info" %}
**Note:**

You need to disconnect data feed and broker, before doing the backup, as otherwise there might occur problems. When clicking on "Backup" you will be warned by a popup message:
{% endhint %}

<figure><img src="https://docs.agenatrader.com/~gitbook/image?url=https%3A%2F%2F2805764894-files.gitbook.io%2F%7E%2Ffiles%2Fv0%2Fb%2Fgitbook-legacy-files%2Fo%2Fassets%252F-MKZSsJBtSP9L4sqIe_q%252F-MQC3l0dmZCpivZIGAO3%252F-MQC4lhInsaz_TiyZOkP%252FBackup_EN.png%3Falt%3Dmedia%26token%3Dd5c3f021-bf30-421c-b131-9bbbf472cb6e&#x26;width=768&#x26;dpr=4&#x26;quality=100&#x26;sign=d859f06d&#x26;sv=1" alt=""><figcaption></figcaption></figure>

#### **Backup Timetable** <a href="#backup-timetable" id="backup-timetable"></a>

* Select a series type, such as, for example, weekly, daily …
* Select the weekday.
* Select the precise time.
* Specify how much memory should be available for backups on your hard drive.
  * Once the maximum size has been reached, the oldest backup is automatically deleted.
  * You should specify at least enough memory that up to min. 4 backups are possible. This is recommended so that several restore points can be created, and so that a restoration to an earlier functioning version is guaranteed. The more backups, the more certain the restoration of functioning data.
* Information about the necessary memory is calculated according to which data has been activated for the backup.

<figure><img src="https://docs.agenatrader.com/~gitbook/image?url=https%3A%2F%2F2805764894-files.gitbook.io%2F%7E%2Ffiles%2Fv0%2Fb%2Fgitbook-legacy-files%2Fo%2Fassets%252F-MKZSsJBtSP9L4sqIe_q%252F-MQC3l0dmZCpivZIGAO3%252F-MQC4pgiAB4UjY_YFFbf%252FBackup_2.jpg%3Falt%3Dmedia%26token%3Dd2bfb821-3c32-4513-a476-ecdaa0d3ca37&#x26;width=768&#x26;dpr=4&#x26;quality=100&#x26;sign=90521f35&#x26;sv=1" alt=""><figcaption></figcaption></figure>

#### **Simple mode** <a href="#simple-mode" id="simple-mode"></a>

* Options
  * AgenaTrader executable: when active, the installation file is added to each backup, so that you can restore not only files, but also the respective version, and this reduces version conflicts and cannot be deactivated.
  * AgenaTrader environment: with this, all user data, such as workspace, trading journal, Add-Ons, conditions and co. are backed up.
  * AgenaTrader data: here, logs, histories, replay data and snapshots are backed up.

<figure><img src="https://docs.agenatrader.com/~gitbook/image?url=https%3A%2F%2F2805764894-files.gitbook.io%2F%7E%2Ffiles%2Fv0%2Fb%2Fgitbook-legacy-files%2Fo%2Fassets%252F-MKZSsJBtSP9L4sqIe_q%252F-MQC3l0dmZCpivZIGAO3%252F-MQC4tiHXMHv618ypvsE%252FBackup%2520simple.PNG%3Falt%3Dmedia%26token%3D51d2542e-bb9e-497c-8a84-ccf7b3cb0f94&#x26;width=768&#x26;dpr=4&#x26;quality=100&#x26;sign=c266fefa&#x26;sv=1" alt=""><figcaption></figcaption></figure>

#### **Advanced mode** <a href="#advanced-mode" id="advanced-mode"></a>

* Specify the storage location on your storage medium. (Hard drive, SSD, USB …)
  * There must be enough memory and sufficient write permission in the storage location.
* Options
  * Here you can choose down to the last detail which user data should be backed up. There are two main directories, the user directory and the data directory. The first can be compared to the “AgenaTrader environment”, and the second to the “AgenaTrader data” from the simple mode.
  * Activating or deactivating the respective checkbox decides which data should be backed up.
  * The AgenaTrader installation file is also always backed up along with this here.

With the button “Apply”, changes are saved. The “Backup” button immediately creates a new backup, and “Close” closes the window without creating a backup or saving data.

As soon as the “Backup” button has been clicked, the backup starts, and it can be stopped again using the button “Cancel”.

Each created backup can subsequently be found under the function “Restore”.

<figure><img src="https://docs.agenatrader.com/~gitbook/image?url=https%3A%2F%2F2805764894-files.gitbook.io%2F%7E%2Ffiles%2Fv0%2Fb%2Fgitbook-legacy-files%2Fo%2Fassets%252F-MKZSsJBtSP9L4sqIe_q%252F-MQC3l0dmZCpivZIGAO3%252F-MQC4xsqgBynHgY6PRIf%252FBackup%2520advanced.PNG%3Falt%3Dmedia%26token%3D5c67b6ee-685b-478c-a914-bfb56e7b3bde&#x26;width=768&#x26;dpr=4&#x26;quality=100&#x26;sign=66598ae9&#x26;sv=1" alt=""><figcaption></figcaption></figure>

### **Backup on Virtual Machine** <a href="#backup-on-virtual-machine" id="backup-on-virtual-machine"></a>

#### **Windows** <a href="#windows" id="windows"></a>

The user can run AgenaTrader on VM machine (in our case Virtual Box) and store the backup on his local machine. *In order to do that please follow these steps*:

* Create the Backup folder on user local PC. In this folder, Backup will be stored.
* Open Virtual Box and click on settings

<figure><img src="https://docs.agenatrader.com/~gitbook/image?url=https%3A%2F%2F2805764894-files.gitbook.io%2F%7E%2Ffiles%2Fv0%2Fb%2Fgitbook-legacy-files%2Fo%2Fassets%252F-MKZSsJBtSP9L4sqIe_q%252F-MQC3l0dmZCpivZIGAO3%252F-MQC51suY6f4l1HsIYh-%252FOracle.jpg%3Falt%3Dmedia%26token%3Db1542856-0889-4b0f-a891-710b93d03b42&#x26;width=768&#x26;dpr=4&#x26;quality=100&#x26;sign=f2cfc925&#x26;sv=1" alt=""><figcaption></figcaption></figure>

* Go to **Shared Folder** section and click on **Add Shared Folder** button

<figure><img src="https://docs.agenatrader.com/~gitbook/image?url=https%3A%2F%2F2805764894-files.gitbook.io%2F%7E%2Ffiles%2Fv0%2Fb%2Fgitbook-legacy-files%2Fo%2Fassets%252F-MKZSsJBtSP9L4sqIe_q%252F-MQC3l0dmZCpivZIGAO3%252F-MQC568-4bDhj4HYEHWy%252FShared.jpg%3Falt%3Dmedia%26token%3Dc230c8bf-01e8-4263-bcc9-2d013b8c21a7&#x26;width=768&#x26;dpr=4&#x26;quality=100&#x26;sign=9c186d29&#x26;sv=1" alt=""><figcaption></figcaption></figure>

* In open dialog select **Folder Path->Other** and through the Browse Folder window add the Backup folder.

<figure><img src="https://docs.agenatrader.com/~gitbook/image?url=https%3A%2F%2F2805764894-files.gitbook.io%2F%7E%2Ffiles%2Fv0%2Fb%2Fgitbook-legacy-files%2Fo%2Fassets%252F-MKZSsJBtSP9L4sqIe_q%252F-MQC3l0dmZCpivZIGAO3%252F-MQC5AYMYUQWQvF8JJ0X%252FBackup.jpg%3Falt%3Dmedia%26token%3D5acbc129-85b0-4fbc-8feb-547d473d8d84&#x26;width=768&#x26;dpr=4&#x26;quality=100&#x26;sign=e9b8dab9&#x26;sv=1" alt=""><figcaption></figcaption></figure>

* Start virtual machine. Go to folder Network -> VBOXSVR -> User Backup folder and copy path. It should looks like: **\\\VBOXSVR\Backup**

<figure><img src="https://docs.agenatrader.com/~gitbook/image?url=https%3A%2F%2F2805764894-files.gitbook.io%2F%7E%2Ffiles%2Fv0%2Fb%2Fgitbook-legacy-files%2Fo%2Fassets%252F-MKZSsJBtSP9L4sqIe_q%252F-MQC3l0dmZCpivZIGAO3%252F-MQC5EfA2Ql_VfyjJfCE%252Fpath.jpg%3Falt%3Dmedia%26token%3Decb54b67-0dad-45f3-8303-a4067ea0466c&#x26;width=768&#x26;dpr=4&#x26;quality=100&#x26;sign=93134b68&#x26;sv=1" alt=""><figcaption></figcaption></figure>

* Run AgenaTrader. In Backup section paste backup folder path and click **Backup** button.

<figure><img src="https://docs.agenatrader.com/~gitbook/image?url=https%3A%2F%2F2805764894-files.gitbook.io%2F%7E%2Ffiles%2Fv0%2Fb%2Fgitbook-legacy-files%2Fo%2Fassets%252F-MKZSsJBtSP9L4sqIe_q%252F-MQC3l0dmZCpivZIGAO3%252F-MQC5JXyRXQi_j8MwxV7%252FAT%2520backup.jpg%3Falt%3Dmedia%26token%3D7f1d6417-0cff-4c8b-8a65-78cd9412f962&#x26;width=768&#x26;dpr=4&#x26;quality=100&#x26;sign=e9b6d8a&#x26;sv=1" alt=""><figcaption></figcaption></figure>

Now you VM backups will be stored on your local PC.

#### **Mac OS** <a href="#mac-os" id="mac-os"></a>

If you use Parallels you should do the same steps as for Windows. Please find details about sharing folder in Parallels [**here**](http://download.parallels.com/desktop/v11/docs/it_IT/Parallels%20Desktop%20User's%20Guide/32922.htm)

In other case User should zip User and Data directory. By default they are located: User Directory: **C:\Users\\"PC\_Name"\Documents\AgenaTrader** Data Directory: **C:\Users\\"PC\_Name"\AppData\Local\AgenaTrader**

You may store these zip files wherever you want, but keep in mind that there has to be enough memory usage.

To restore the backup user should close AgenaTrader, extract the backup files from the archive and replace files in user and data directory.

## <img src="/files/SKH2bqgggL02KHI6dVFX" alt="" data-size="line"> **Restore** <a href="#restore" id="restore"></a>

In this window, all previously created backups are displayed. With a click on the desired point of recovery, AgenaTrader will automatically be set back to the version and files of the specified date.

The storage location of the backups will automatically be synchronized with the backup dialogue window.

<figure><img src="https://docs.agenatrader.com/~gitbook/image?url=https%3A%2F%2F2805764894-files.gitbook.io%2F%7E%2Ffiles%2Fv0%2Fb%2Fgitbook-legacy-files%2Fo%2Fassets%252F-MKZSsJBtSP9L4sqIe_q%252F-MQC3l0dmZCpivZIGAO3%252F-MQC5PH6yQs_aXpEX9Hq%252FRestore_4.jpg%3Falt%3Dmedia%26token%3D078f2b20-61d8-4a8a-8b92-5e2f017fda9b&#x26;width=768&#x26;dpr=4&#x26;quality=100&#x26;sign=4293885e&#x26;sv=1" alt=""><figcaption></figcaption></figure>

The location of the user data backup folder can be defined manually. It can, for example, be saved in: "... /Documents/AgenaTrader".

<figure><img src="https://docs.agenatrader.com/~gitbook/image?url=https%3A%2F%2F2805764894-files.gitbook.io%2F%7E%2Ffiles%2Fv0%2Fb%2Fgitbook-legacy-files%2Fo%2Fassets%252F-MKZSsJBtSP9L4sqIe_q%252F-MQC3l0dmZCpivZIGAO3%252F-MQC5SXqxpNaTvCYSloZ%252Fmain_backup1.png%3Falt%3Dmedia%26token%3D5f2f5fc3-e1ff-4cd7-bba1-bbe915785e90&#x26;width=768&#x26;dpr=4&#x26;quality=100&#x26;sign=2c862454&#x26;sv=1" alt=""><figcaption></figcaption></figure>

With the default setup, the backup folder is saved in the AgenaTrader user directory (.../Documents/AgenaTrader/).

<figure><img src="https://docs.agenatrader.com/~gitbook/image?url=https%3A%2F%2F2805764894-files.gitbook.io%2F%7E%2Ffiles%2Fv0%2Fb%2Fgitbook-legacy-files%2Fo%2Fassets%252F-MKZSsJBtSP9L4sqIe_q%252F-MQC3l0dmZCpivZIGAO3%252F-MQC5ZIoC1I9ISH75u97%252Fmain_backup2.png%3Falt%3Dmedia%26token%3D98d8da52-2377-4e28-a933-526f295d9319&#x26;width=768&#x26;dpr=4&#x26;quality=100&#x26;sign=8904c201&#x26;sv=1" alt=""><figcaption></figcaption></figure>

If you need to restore any data, copy the required data from the backup folder into the AgenaTrader user directory folder (.../Documents/AgenaTrader/).

#### **Setback to default values** <a href="#setback-to-default-values" id="setback-to-default-values"></a>

If for any reason you don not want or need your customized settings anymore or if you unwittingly made settings, you don´t want, yet do not find back to previous settings, you can easily set back your AgenaTrader to default values.

When clicking "Main - Backup/Restore - Setback to default values", you are asked if you are sure that you want to reset all your settings. After confirming this, AgenaTrader is set back to default values.

**Please note that all of your settings are deleted!**

![](https://docs.agenatrader.com/~gitbook/image?url=https%3A%2F%2F2805764894-files.gitbook.io%2F%7E%2Ffiles%2Fv0%2Fb%2Fgitbook-legacy-files%2Fo%2Fassets%252F-MKZSsJBtSP9L4sqIe_q%252F-MQC3l0dmZCpivZIGAO3%252F-MQC5cxL0xDLSsBBzl3k%252FEN_Setback.png%3Falt%3Dmedia%26token%3D6a70f05f-ca3c-42c2-ae0e-206287b9797c\&width=768\&dpr=4\&quality=100\&sign=1c66c821\&sv=1)![](https://docs.agenatrader.com/~gitbook/image?url=https%3A%2F%2F2805764894-files.gitbook.io%2F%7E%2Ffiles%2Fv0%2Fb%2Fgitbook-legacy-files%2Fo%2Fassets%252F-MKZSsJBtSP9L4sqIe_q%252F-MQC3l0dmZCpivZIGAO3%252F-MQC5g5oojDppWYphVsR%252FEN_Confirm.png%3Falt%3Dmedia%26token%3Ddac41a94-0774-4347-aae7-d66fd75a5227\&width=768\&dpr=4\&quality=100\&sign=224e0d1b\&sv=1)

## Clock and Time Zones <a href="#clock-and-time-zones" id="clock-and-time-zones"></a>

On an application toolbar there is time section, where current time is displayed.

<figure><img src="/files/tbAyoNx18BgxlxbtmNFW" alt=""><figcaption></figcaption></figure>

Left mouse click on a Clock will open **Time zones** window .

With right mouse click user may add, edit or remove time zones:

![](https://docs.agenatrader.com/~gitbook/image?url=https%3A%2F%2F2805764894-files.gitbook.io%2F%7E%2Ffiles%2Fv0%2Fb%2Fgitbook-legacy-files%2Fo%2Fassets%252F-MKZSsJBtSP9L4sqIe_q%252F-MQwaBAfMfkSUH6IVZlQ%252F-MQwek7zlOAsxe2sGExk%252Ftime%2520zones.png%3Falt%3Dmedia%26token%3D55fa8832-a01f-4316-b102-f5ce927c34b8\&width=768\&dpr=4\&quality=100\&sign=8d6f3cda\&sv=1)

## <img src="/files/Gty1VPNNZnPkeSdw2ynm" alt="" data-size="line"> Exit

Selecting the **Exit** menu item from the **Main** menu will close the AgenaTrader platform.

Before closing the program you will be asked whether you wish to save the current workspace or not.

<figure><img src="https://docs.agenatrader.com/~gitbook/image?url=https%3A%2F%2F2805764894-files.gitbook.io%2F%7E%2Ffiles%2Fv0%2Fb%2Fgitbook-legacy-files%2Fo%2Fassets%252F-MKZSsJBtSP9L4sqIe_q%252F-MQC3l0dmZCpivZIGAO3%252F-MQC5lfzhjKUzWbLUjlo%252FExit.png%3Falt%3Dmedia%26token%3Dc510d176-82cd-407c-b0c1-b2e74c312a66&#x26;width=768&#x26;dpr=4&#x26;quality=100&#x26;sign=95ccdfcf&#x26;sv=1" alt=""><figcaption></figcaption></figure>


# Preferences

*In order to open the **Global Configuration** window use one of the options:*

1. Select **Global Configuration**  using the **Tools** menu or
2. left click the symbol <img src="/files/6EFSFw6G4eJY7IrSeiuI" alt="" data-size="line"> in the applications toolbar within the main window.

<figure><img src="/files/q5oveJKmvxKr2RiY4TGp" alt=""><figcaption></figcaption></figure>

Within the Preferences you can adjust different settings, like:

* General application settings
* Chart settings
* Environment settings
* Scanner settings
* Visual settings
* Order settings
* Action Bar settings
* Alert settings
* Hotkeys
* Directories

## Environment <a href="#general" id="general"></a>

### General <a href="#general" id="general"></a>

The **Environment -> General category** is used to set general application options:

<figure><img src="/files/IXxudgVp6bCngVdLvJQe" alt=""><figcaption></figcaption></figure>

| Left-hand side                               | Meaning                                                                                                                                                                                                                                                                                                                                                                                                                                                                                                                                                                                                                                                                                                                   |
| -------------------------------------------- | ------------------------------------------------------------------------------------------------------------------------------------------------------------------------------------------------------------------------------------------------------------------------------------------------------------------------------------------------------------------------------------------------------------------------------------------------------------------------------------------------------------------------------------------------------------------------------------------------------------------------------------------------------------------------------------------------------------------------- |
| Profit / Loss Display Currency               | <p>Defines the currency used to convert the Profit/Loss for the: <br>Position bar <br>Position manager <br>Trades manager <br>Journal etc. <br><strong>Warning!</strong> When you change the Profit/Loss currency AgenaTrader ask to disconnect all active datafeed/broker connections <img src="https://docs.agenatrader.com/~gitbook/image?url=https%3A%2F%2F2805764894-files.gitbook.io%2F%7E%2Ffiles%2Fv0%2Fb%2Fgitbook-legacy-files%2Fo%2Fassets%252F-MKZSsJBtSP9L4sqIe_q%252F-MQCFungwxhiajGNAIdb%252F-MQCGNot1Uq58KLtQ9El%252Fdialog_currency.jpg%3Falt%3Dmedia%26token%3D610e22d2-be4e-4de5-8eef-55c38467cf9a&#x26;width=300&#x26;dpr=4&#x26;quality=100&#x26;sign=4c5a4fba&#x26;sv=1" alt="Dialog Currency"></p> |
| Show profit / loss as                        | <p>The following options are available:</p><p><strong>Amount:</strong> sets the absolute amount of profit / loss for a position <br><strong>Percent:</strong> sets the percentage of realized profit based on the entry price <br><strong>Ticks</strong>: sets the number of ticks based on the entry price</p>                                                                                                                                                                                                                                                                                                                                                                                                           |
| Start Strategies Automatically               | Enables or disables strategies running at the time of closing AgenaTrader to start up again once the trading platform is reopened. ![ConfigEscort Common1](https://docs.agenatrader.com/~gitbook/image?url=https%3A%2F%2F2805764894-files.gitbook.io%2F%7E%2Ffiles%2Fv0%2Fb%2Fgitbook-legacy-files%2Fo%2Fassets%252F-MKZSsJBtSP9L4sqIe_q%252F-MQCFungwxhiajGNAIdb%252F-MQCGRITUgqrXmsf8Aed%252FconfigEscort_common1.png%3Falt%3Dmedia%26token%3Def61454a-a878-4896-abbd-cc736e993f55\&width=300\&dpr=4\&quality=100\&sign=2fefa620\&sv=1)                                                                                                                                                                                 |
| Start Datafeed Automatically                 | Enables or disables all data feeds that were active at the time of closing AgenaTrader to reload/connect again once the trading platform is reopened. ![ConfigEscort Common2](https://docs.agenatrader.com/~gitbook/image?url=https%3A%2F%2F2805764894-files.gitbook.io%2F%7E%2Ffiles%2Fv0%2Fb%2Fgitbook-legacy-files%2Fo%2Fassets%252F-MKZSsJBtSP9L4sqIe_q%252F-MQCFungwxhiajGNAIdb%252F-MQCGUytRRByWky6UO7y%252FconfigEscort_common2.png%3Falt%3Dmedia%26token%3D71d1f83c-7557-4b9c-996b-7ba77133306f\&width=300\&dpr=4\&quality=100\&sign=b3cb9716\&sv=1)                                                                                                                                                              |
| Start Brokers Automatically                  | Enables or disables all connections to brokers that were active at the time of closing AgenaTrader to reload/connect again once the trading platform is reopened.                                                                                                                                                                                                                                                                                                                                                                                                                                                                                                                                                         |
| Default Web Page                             | Website that will appear when the integrated browser is opened.                                                                                                                                                                                                                                                                                                                                                                                                                                                                                                                                                                                                                                                           |
| Wait Until BackUp Datafeed Connect           | Specified time (in seconds) after which the secondary data feed will be connected if the primary data feed fails.                                                                                                                                                                                                                                                                                                                                                                                                                                                                                                                                                                                                         |
| Default E-mail Address                       | Set the email address at which you wish to receive emails from AgenaTrader.                                                                                                                                                                                                                                                                                                                                                                                                                                                                                                                                                                                                                                               |
| Show Release Notes Again at Next Start       | When activated, the Release Note will be shown each time AgenaTrader is started.                                                                                                                                                                                                                                                                                                                                                                                                                                                                                                                                                                                                                                          |
| Open Dialogs on MousePointer                 | Opens Dialogs (e.g. detached windows) on the point at which the mouse indicator is located.                                                                                                                                                                                                                                                                                                                                                                                                                                                                                                                                                                                                                               |
| Keep Message Popups in Front                 | If activated, the alert window will be shown as modal and must be confirmed. If deactivated, the alert window does not need confirmation and will move into the background if ignored.                                                                                                                                                                                                                                                                                                                                                                                                                                                                                                                                    |
| Auto Adjust Tick Sizes                       | When selected, the tick size of the instrument is determined based on the initial 20 bars, facilitating CFD trading with Interactive Brokers.                                                                                                                                                                                                                                                                                                                                                                                                                                                                                                                                                                             |
| Synthetic become Market on touch             | When this function is activated, the synthetic order will be executed as a market order.                                                                                                                                                                                                                                                                                                                                                                                                                                                                                                                                                                                                                                  |
| Use Visual Studio                            | If active then the Visual Studio program will be opened instead of the internal Script (programming environment). To use this function installed [Visual Studio Community 2017](https://docs.microsoft.com/en-us/visualstudio/releasenotes/vs2017-relnotes) required                                                                                                                                                                                                                                                                                                                                                                                                                                                      |
| Smooth charts                                | When activated, all graphical noise on the charts will be eliminated. This requires graphic card memory and a standard display frequency.                                                                                                                                                                                                                                                                                                                                                                                                                                                                                                                                                                                 |
| Autoupdate built-in static instruments lists | When activated, all static instrument lists are updated via a server whenever any modifications are made to the list.                                                                                                                                                                                                                                                                                                                                                                                                                                                                                                                                                                                                     |
| Use digit grouping                           | If activated all values like order size and more are grouped like 1.000 intead of 1000. The function is activated by default.                                                                                                                                                                                                                                                                                                                                                                                                                                                                                                                                                                                             |

## TV-Streams <a href="#tv-streams" id="tv-streams"></a>

This section allows users to manage TV streams by adding or removing them.

To add new stream channel please use following steps:

* Enter stream name in **Web-Stream** field
* Insert stream Url into **Streaming-url** field
* Click **Add** button

<figure><img src="/files/OIu8Bfi9lK3wFjSrHJTV" alt=""><figcaption></figcaption></figure>

To delete a stream channel, select the appropriate stream from the list and click the **Remove** button.

## Login <a href="#login" id="login"></a>

Enables you to set a password to secure AgenaTrader. You can lock AgenaTrader using the CTR + BREAK (CTR + PAUSE) key combination.

<figure><img src="/files/jSwiyIIqYe6ikzDTdQvE" alt=""><figcaption></figcaption></figure>

## Options <a href="#financial-calendar" id="financial-calendar"></a>

The **Options** section in AgenaTrader contains fundamental settings for options trading, allowing users to adjust key parameters used in the Black-Scholes pricing model. These settings influence how options are evaluated within the platform.

<figure><img src="/files/CSvvASv7CHf9nfFIDPZn" alt=""><figcaption></figcaption></figure>

### Black-Scholes Model Settings <a href="#black-scholes-model-settings" id="black-scholes-model-settings"></a>

**Risk-Free Rate**

* Represents the theoretical return on an investment with zero risk.
* Default value: `0.05000` (5%).
* Affects the pricing of options, with higher values generally increasing call option prices and decreasing put option prices.

**Dividend Yield**

* Defines the expected annual dividend yield of the underlying asset.
* Default value: `0.00000` (no dividend assumed).
* Impacts option valuation, as dividends reduce the value of call options and increase the value of put options.

**Days in Year**

* Specifies the number of days considered in a year for option calculations.
* Default value: `365` days (full calendar year).
* Can be adjusted to `252` to align with the number of trading days in a typical year.

**Practical Considerations**

* Ensure the **Risk-Free Rate** reflects current market interest rates for accurate option pricing.
* Adjust **Dividend Yield** based on expected dividends if trading dividend-paying stocks.
* Modify **Days in Year** to match preferred trading conventions or analysis models.

## Scanner <a href="#financial-calendar" id="financial-calendar"></a>

The **Scanner** section in AgenaTrader provides customizable settings for scanning market instruments and identifying trading opportunities based on user-defined preferences.

<figure><img src="/files/QXkvV37nsgwanU5b1Z4x" alt=""><figcaption></figcaption></figure>

### Default Scanner Preferences <a href="#default-scanner-preferences" id="default-scanner-preferences"></a>

**Up-Tick and Down-Tick Colors**

* Allows users to set foreground colors for up-tick and down-tick values.
* Separate color settings are available for both light and dark backgrounds.

**Refresh Rate**

* Specifies the time interval (in milliseconds) for refreshing scanner data.
* Default value: `500` milliseconds.

**Auto-Refresh Dynamic Instrument Lists Rate**

* Defines how often the dynamic instrument lists are refreshed.
* Default value: `60` minutes.

**Highlight Cell (Up-Tick/Down-Tick)**

* Enables color highlighting for cells based on price movement.
* Users can set custom colors for up-ticks and down-ticks.

**Highlight Changed Values Timeout**

* Determines the duration (in milliseconds) for which changed values remain highlighted.
* Default value: `200` milliseconds.

**Show Scanner Grid Borders**

* Option to display grid borders within the scanner.
* Users can select a preferred border color.

**Background Color for New Columns**

* Allows customization of background colors for new columns in both dark and light mode.
* Default values are black for dark mode and yellow for light mode.

### **Practical Considerations**

* Adjust refresh rates based on the required level of real-time updates.
* Customize tick colors to enhance visibility and usability.
* Use highlighting features to quickly identify changes in market data.

## Chart <a href="#financial-calendar" id="financial-calendar"></a>

The **Chart** section in AgenaTrader allows you to customize various chart settings to enhance your trading experience and improve chart visualization.

<figure><img src="/files/9wwEpH2C2xlSQLG4w0Oc" alt=""><figcaption></figcaption></figure>

**Max Visible Bars Count**

* Set the maximum number of bars you want to see on the chart.
* You can define a different number per chart, but this setting acts as a global limit. If a chart-specific number is higher, the global setting takes precedence and restricts candle loading. If it's lower, the chart will display fewer candles
* Default value: `1000`.

**Right Margin on Chart %**

* Adjust the distance between the last period and the right border of your chart pane.
* Default value: `30%`.

**Upper/Lower Margin on Chart %**

* Define the amount of free space between the upper/lower borders of the chart.
* Default value: `35%`.

**Snapshot Template**

* Choose a template to be used for trade snapshots.
* The selected template determines how your snapshot looks and what data it includes.

**Chart Display Options**

* **Show Indicator Information:** Display loaded indicators when you hover over the chart:

  <figure><img src="https://docs.agenatrader.com/~gitbook/image?url=https%3A%2F%2F2805764894-files.gitbook.io%2F%7E%2Ffiles%2Fv0%2Fb%2Fgitbook-x-prod.appspot.com%2Fo%2Fspaces%252F-MKZSsJBtSP9L4sqIe_q-887967055%252Fuploads%252FC4fnMgTBQ903ReRDlqDk%252Fimage.png%3Falt%3Dmedia%26token%3Db1babffc-9991-4d21-bdb4-62dc8680e309&#x26;width=768&#x26;dpr=4&#x26;quality=100&#x26;sign=ad5ed421&#x26;sv=2" alt=""><figcaption></figcaption></figure>
* **Use TraderBar Boxes:**
  * If this is enabled: the entry line will be displayed as a box:

    <figure><img src="https://docs.agenatrader.com/~gitbook/image?url=https%3A%2F%2F2805764894-files.gitbook.io%2F%7E%2Ffiles%2Fv0%2Fb%2Fgitbook-x-prod.appspot.com%2Fo%2Fspaces%252F-MKZSsJBtSP9L4sqIe_q-887967055%252Fuploads%252FyY6gkJKGh72rOE7srpXH%252Fimage.png%3Falt%3Dmedia%26token%3Da87224ca-6775-4578-93af-3c24e97b55f4&#x26;width=768&#x26;dpr=4&#x26;quality=100&#x26;sign=2eb1d666&#x26;sv=2" alt=""><figcaption></figcaption></figure>
  * If this is disabled: the entry line will be displayed as a line

    <figure><img src="https://docs.agenatrader.com/~gitbook/image?url=https%3A%2F%2F2805764894-files.gitbook.io%2F%7E%2Ffiles%2Fv0%2Fb%2Fgitbook-x-prod.appspot.com%2Fo%2Fspaces%252F-MKZSsJBtSP9L4sqIe_q-887967055%252Fuploads%252FhMYERwqbHLpmCtOSnvkF%252Fimage.png%3Falt%3Dmedia%26token%3D9c9e5d7d-1c4c-42cd-969e-0f0f4cc98079&#x26;width=768&#x26;dpr=4&#x26;quality=100&#x26;sign=ad3854b0&#x26;sv=2" alt=""><figcaption></figcaption></figure>
* **Manipulate Confirmed Order Bars:** Allow adjustments to confirmed order bars:

  <figure><img src="https://docs.agenatrader.com/~gitbook/image?url=https%3A%2F%2F2805764894-files.gitbook.io%2F%7E%2Ffiles%2Fv0%2Fb%2Fgitbook-x-prod.appspot.com%2Fo%2Fspaces%252F-MKZSsJBtSP9L4sqIe_q-887967055%252Fuploads%252FmrzlIMlclxGFNmZlYbss%252Fimage.png%3Falt%3Dmedia%26token%3D7bec1ab1-c48c-4ded-bb41-c693558198eb&#x26;width=768&#x26;dpr=4&#x26;quality=100&#x26;sign=ea3456ab&#x26;sv=2" alt=""><figcaption></figcaption></figure>
* **Autoscale Chart Trader Bars:** Automatically scale the chart to keep all order bars visible.
  * Let's assume that you run a trade using the day chart and then switch to the 5-minute chart. This may lead to orders on the 5-minute chart being too far away from each other, so that in order to display all orders the chart must be extremely compacted. So, check this box if you want all order bars to be shown inside the chart (autoscale). If order bars may also be located outside the chart, do not select this option.
* **Autoscale Chart Trade Markers:** Ensure all trade markers fit within the chart.
* **Link ChartGroups to Static Instrument Lists:** Sync changes between chart groups and static instrument lists.
* **Print White Chart Background:** Print charts with a white background.
* **Remember Price Scale:** Keep your zoom settings consistent across instruments.
* **Show Info Indicator:** View instrument details directly on the chart.
  * If the info indicator is supposed to be displayed only for specific charts, disable this global settings and add the indicator manually to those charts
* **Show Spread Lines on QuickTrader:** Display spread lines in the QuickTrader panel.
* **Autoscale Price Panel:** Automatically adjust the price panel based on price movement.
* **Broker/Datafeed Indicator:** See the current broker/datafeed connection status.
* **Realtime Updates for Non-Time-Based Charts:** Get real-time updates for charts based on non-time intervals.
* **Move Chart Without CTRL Key:** Move charts freely without holding the CTRL key.
* **Show OrderBar Editor Tooltip:** Display tooltips when editing order bars.
* **Align OrderBar to Left Side of Chart:** Position the order bar on the left side.
* **Show Calculation-Type of Data:** Know whether data is received directly from the data feed or processed by AgenaTrader.
* **Show Trade Visualization of Previous Contracts:** View past trades on the chart.

### Tab Chart Group <a href="#tab-chart-group" id="tab-chart-group"></a>

* **Auto Synchronization:** Sync indicators across your tab chart groups.
  * **Synchronize TimeFrame:** Sync time frames across your tab chart groups.
* **Load Chart on Tab-Click:** Automatically load the chart when you click a tab.
* **ChartGallery Global Scrolling:** Enable synchronized scrolling across multiple chart windows.

### Secondary Data Series Starting Point <a href="#secondary-data-series-starting-point" id="secondary-data-series-starting-point"></a>

* **First Requested:** Start the secondary data series from when it was first requested.
* **First Visible:** Start the secondary data series from the first visible point on the left side of the chart.

### Position Bar Colors <a href="#position-bar-colors" id="position-bar-colors"></a>

* **Profit Color:** Choose the color for profit bars.
* **Loss Color:** Select the color for loss bars.
* **Background Color:** Set the background color of the chart trader bar.

### **Practical Considerations**

* Adjust chart margins to maximize visibility and usability.
* Use snapshot templates to maintain a consistent trade documentation process.
* Configure position bar colors to enhance visual clarity during your analysis.

## Financial Calendar <a href="#financial-calendar" id="financial-calendar"></a>

Financial Calendar allows to set default instruments in which alerts of the financial calendar are displayed.

<figure><img src="/files/UdjmBh0fFf6zfVJVj43w" alt=""><figcaption></figcaption></figure>

| Name               | Meaning                                                   |
| ------------------ | --------------------------------------------------------- |
| Source currency    | Source for events are announced in the financial calendar |
| Destination charts | Instrument for which created alerts are displayed         |

## History <a href="#configuration_escort__market_place_escort" id="configuration_escort__market_place_escort"></a>

The **History** section in AgenaTrader allows you to configure historical data settings to optimize your trading experience. It provides tools to manage trading hours, breaks, and specific market conditions for better historical analysis and backtesting.

### Market Place Escort <a href="#configuration_escort__market_place_escort" id="configuration_escort__market_place_escort"></a>

The **Market Place Escort** allows you to set various properties for different trading exchanges, including trading hours, trading pauses, and reversal times. These settings help ensure accurate market representation in your charts.

### Trading hours <a href="#trading_hours" id="trading_hours"></a>

<figure><img src="/files/7q2rSOLiiZ2DjDVtldDm" alt=""><figcaption></figcaption></figure>

* Trading hours define the official time periods during which trading takes place on exchanges.
* The times correspond to the local time set on your computer.
* AgenaTrader automatically assigns an exchange to instruments, ensuring prices align with official trading hours.
* The "Exclude Weekend" option lets you remove weekend data from charts, disabling the start and end time settings when activated.
* Over-the-counter (OTC) trading hours, such as pre- and post-market hours, can also be configured to include extended trading times.
* To toggle OTC hours on your chart, use the designated button ![](https://docs.agenatrader.com/~gitbook/image?url=https%3A%2F%2F2805764894-files.gitbook.io%2F%7E%2Ffiles%2Fv0%2Fb%2Fgitbook-x-prod.appspot.com%2Fo%2Fspaces%252F-MKZSsJBtSP9L4sqIe_q-887967055%252Fuploads%252F57PD2epjjBfQodCYt7NA%252Fimage.png%3Falt%3Dmedia%26token%3Dd0f5d6d4-549a-4129-8de8-e392c2f2b0e0\&width=34\&dpr=4\&quality=100\&sign=b40f7de3\&sv=2) in the chart toolbar.

<figure><img src="https://docs.agenatrader.com/~gitbook/image?url=https%3A%2F%2F2805764894-files.gitbook.io%2F%7E%2Ffiles%2Fv0%2Fb%2Fgitbook-legacy-files%2Fo%2Fassets%252F-MKZSsJBtSP9L4sqIe_q%252F-MQCFungwxhiajGNAIdb%252F-MQCHgqMCysjvqWlr8UU%252FPostMarket.jpg%3Falt%3Dmedia%26token%3Da84d5452-f587-48f0-b336-f6e4a86bb0c7&#x26;width=768&#x26;dpr=4&#x26;quality=100&#x26;sign=f099551f&#x26;sv=1" alt=""><figcaption></figcaption></figure>

{% hint style="info" %}
**Important:** Differences in closing prices may occur based on the selected timeframe. For example, a 15-minute chart may close at 22:00, while a 1-minute chart will close at 22:05. Directly received timeframes from data feeds cannot always align precisely with session end times.
{% endhint %}

### Trading pauses <a href="#trading_pauses" id="trading_pauses"></a>

* Define specific periods during which trading activity is paused to match exchange schedules.
* Trading pauses can occur during trade openings, midday breaks, or near the trading end.
* If you wish to avoid trading during uncertain periods, select the "Flat" checkbox in the Marketplace Escort to automatically close trades and orders during these times.
* AgenaTrader++ will not generate new signals during trading pauses, but manual trading remains possible.
* If you want trades to close automatically before a pause and prevent new signals, define two seamless trading pauses.
* Customize the background color for trading breaks using the "Chart Color" settings to visualize pauses in the chart and Analyzer-Escort columns.

<figure><img src="/files/Ra5LQmpFRf18nrA173xf" alt=""><figcaption></figcaption></figure>

<figure><img src="https://docs.agenatrader.com/~gitbook/image?url=https%3A%2F%2F2805764894-files.gitbook.io%2F%7E%2Ffiles%2Fv0%2Fb%2Fgitbook-legacy-files%2Fo%2Fassets%252F-MKZSsJBtSP9L4sqIe_q%252F-MQCFungwxhiajGNAIdb%252F-MQCHujPuZ6KL8aOwx1Q%252Ftrading-breaks1.png%3Falt%3Dmedia%26token%3D10c4217d-02ef-4a7d-82bc-becb391cc30e&#x26;width=768&#x26;dpr=4&#x26;quality=100&#x26;sign=501984e4&#x26;sv=1" alt=""><figcaption></figcaption></figure>

### Reversal times <a href="#reversal_times" id="reversal_times"></a>

* Reversal times are statistically significant time ranges where instruments may change direction due to volume shifts.
* Common reversal times include lunch breaks, afternoon session openings, and end-of-day positioning.
* Enter known reversal times in the Marketplace Escort under the Reversal Times tab.
* Use the "Chart Color" button to customize chart colors for reversal times and recognize them easily.
* To display reversal times, add the "Trading Times Background" indicator to the chart.

{% hint style="info" %}
**Note:** Market trends do not always follow predictable patterns. While reversal times may provide useful insights, they do not guarantee successful trades.
{% endhint %}

<figure><img src="https://docs.agenatrader.com/~gitbook/image?url=https%3A%2F%2F2805764894-files.gitbook.io%2F%7E%2Ffiles%2Fv0%2Fb%2Fgitbook-legacy-files%2Fo%2Fassets%252F-MKZSsJBtSP9L4sqIe_q%252F-MQCFungwxhiajGNAIdb%252F-MQCI64GxjB3ocolVSXb%252Freversal-times.png%3Falt%3Dmedia%26token%3D889c698f-3e51-4b05-bd04-038896dc6d62&#x26;width=768&#x26;dpr=4&#x26;quality=100&#x26;sign=f5a1d739&#x26;sv=1" alt=""><figcaption></figcaption></figure>

<figure><img src="/files/YaaWlIuAHjOesRUbFJEt" alt=""><figcaption></figcaption></figure>

### Automatic import <a href="#automatic_import" id="automatic_import"></a>

If you connect to a new data feed / broker in the [account connection manager](https://docs.agenatrader.com/main/broker-and-datafeed-connections/multi-account-settings), the [Instrument import popup](https://docs.agenatrader.com/tools/instrument-escort#Instrument_Escort__Import_and_export_of_instruments) will be displayed. Depending on which markets are selected in the instrument import popup, the relevant trading hours and exchanges will be loaded via a server. After selecting and importing all exchanges, the [Marketplace Escort](https://agenatrader.com/wiki/tiki-index.php?page=Configuration+Escort%3A+Market+Place+Escort) will display a dialog window in which you can set the exchange trading hours.

Please verify these trading hours and keep in mind that the US stock exchanges have different summer/winter phases which may result in display deviations.

{% hint style="warning" %}
**ATTENTION!** When using the internal simulation account, the correct input of trading hours is absolutely essential due to enormous deviations in spread that may exist in the pre-/post-market trading hours. This may lead to your orders being filled even if the price is far away from your order.
{% endhint %}

### History Limitations <a href="#history-limitations" id="history-limitations"></a>

When downloading data for later replay. AgenaTrader will also use the additional amount of data displayed on these settings from the time immediately before you starting point.

<figure><img src="/files/nGMcQ7CCYJpIPGN8lCS5" alt=""><figcaption></figcaption></figure>

| Left-hand side                      | Meaning                                                                                                                                                                                                                                                                                                                                                                                                                                                                                                                                                                                                                                                                                                                                                                                                                                                                                                                                                                                                            |
| ----------------------------------- | ------------------------------------------------------------------------------------------------------------------------------------------------------------------------------------------------------------------------------------------------------------------------------------------------------------------------------------------------------------------------------------------------------------------------------------------------------------------------------------------------------------------------------------------------------------------------------------------------------------------------------------------------------------------------------------------------------------------------------------------------------------------------------------------------------------------------------------------------------------------------------------------------------------------------------------------------------------------------------------------------------------------ |
| Historical Days                     | Allows you to define time properties for the replay mode history in: [![Dot](https://docs.agenatrader.com/~gitbook/image?url=https%3A%2F%2Fagenatrader.com%2Fwiki%2Ftiki-download_file.php%3FfileId%3D22%26display\&width=300\&dpr=4\&quality=100\&sign=5ef5815b\&sv=1) ](https://agenatrader.com/wiki/tiki-download_file.php?fileId=22\&display)seconds [![Dot](https://docs.agenatrader.com/~gitbook/image?url=https%3A%2F%2Fagenatrader.com%2Fwiki%2Ftiki-download_file.php%3FfileId%3D22%26display\&width=300\&dpr=4\&quality=100\&sign=5ef5815b\&sv=1) ](https://agenatrader.com/wiki/tiki-download_file.php?fileId=22\&display)minutes [![Dot](https://docs.agenatrader.com/~gitbook/image?url=https%3A%2F%2Fagenatrader.com%2Fwiki%2Ftiki-download_file.php%3FfileId%3D22%26display\&width=300\&dpr=4\&quality=100\&sign=5ef5815b\&sv=1) ](https://agenatrader.com/wiki/tiki-download_file.php?fileId=22\&display)hours **WARNING!** large history time frames can cause performance issues in replay mode. |
| Chart/Scanner History Settings      | **Snapshot History (Candles)**:Sets the history size (number of candles) for the chart snapshots. Regardless how many bars were loaded in chart, number of bars in snapshot will be defined here. **Maximum Days to load NTB Charts** : Maximum amount of days (history) for non-time-based charts (Range, Ticks, Volume, Renko) **Maximum Bars to Load in Time Period**: Maximum amount of bars for selected timeframe **Max. Hours back OrderStream**: Maximum number of hours for which the historical order stream ticket data is read. Please find details on page [**OrderStream**](https://docs.agenatrader.com/main/chart-area/orderstream)                                                                                                                                                                                                                                                                                                                                                                |
| Historical Transaction-History/Bars | **Bars to Load in TimeBased Charts:** Maximum amount of bars for timebased charts which display trades, positions, orders. **Bars to Load NTB Charts:** Maximum amount of bars for non-time-based charts which display trades, positions, orders. These charts available in tabs: *Trades Manager, Order Manage, Execution and Trading Journal*                                                                                                                                                                                                                                                                                                                                                                                                                                                                                                                                                                                                                                                                    |
| Enable AutoReload Histories         | Set an exact time when your datafeed will be reconnected and reload all history.                                                                                                                                                                                                                                                                                                                                                                                                                                                                                                                                                                                                                                                                                                                                                                                                                                                                                                                                   |

## Trading <a href="#discretionary-trading" id="discretionary-trading"></a>

The Discretionary Trading category allows you to enter general settings related to order size.

<figure><img src="/files/ApHCDgsb1uKbo1MrJkQA" alt=""><figcaption></figcaption></figure>

| Option                                   | Description                                                                                                                                                                                                                                                                                                                                |
| ---------------------------------------- | ------------------------------------------------------------------------------------------------------------------------------------------------------------------------------------------------------------------------------------------------------------------------------------------------------------------------------------------ |
| Default Order Size                       | Sets the suggested order size for strategies outside of AgenaTrader++. Due to the fact that some brokers demand a minimum order size, this setting can sometimes be ignored (if the entered amount is smaller than the minimum order size). In this case AgenaTrader will offer you the required minimum order size when placing an order. |
| Place Syntetic Order on Margin Violation | If the Account-Cash values get exceeded because of a margin violation AgenaTrader will place syntetic order                                                                                                                                                                                                                                |

For the **Futures,** you may adjust some additional settings. Check the **Show Rollover Alert** checkbox if you wish to be shown the futures calendar window (see below) upon starting up AgenaTrader - it will appear if one of the major futures is n days before its rollover. The dialog window will open where the cursor is positioned.

*In the **Futures calendar** window you will see the day of the month on which the rollover will take place:*

* If the rollover date lies within the time range between the predefined days and the contract expiration date, then the corresponding cell will be highlighted in red.
* If the expiration date lies in the past, then the corresponding cell will be highlighted in light red.
* If the futures has already been rolled over to the next contract, then the corresponding cell will be highlighted in green.

By clicking on the symbol you will call up the detail window for the instrument within the **Instrument Editor**. Here you may make the necessary changes. More information about the rollover can be found in the section: [Futures contract rollover](https://docs.agenatrader.com/tools/instrument-escort#Instrument_Escort__Futures_contract_rollover).

<figure><img src="https://docs.agenatrader.com/~gitbook/image?url=https%3A%2F%2F2805764894-files.gitbook.io%2F%7E%2Ffiles%2Fv0%2Fb%2Fgitbook-legacy-files%2Fo%2Fassets%252F-MKZSsJBtSP9L4sqIe_q%252F-MQCFungwxhiajGNAIdb%252F-MQCIavPfK7F1LBZjkuX%252Ffuture.png%3Falt%3Dmedia%26token%3D7d906918-edde-43a0-a016-20d360018d71&#x26;width=768&#x26;dpr=4&#x26;quality=100&#x26;sign=fc40f3c0&#x26;sv=1" alt=""><figcaption></figcaption></figure>

## AT (Plus Plus) Manager <a href="#at-plus-plus-manager" id="at-plus-plus-manager"></a>

In this section, you can configure **semi-automated setups**, **trade management elements**, the **integrated risk and money management** with **automatic order size calculation**, the **signal scanner**, and various other functions.

<figure><img src="/files/nJ2XACRiOUhlOtxdpbg4" alt=""><figcaption></figcaption></figure>

## ActionBar <a href="#actionbar" id="actionbar"></a>

{% hint style="warning" %}
**ATTENTION! For more detail please visit** [**ActionBar** ](#actionbar)**page**
{% endhint %}

Inside the **ActionBar tab** you can select settings for the panel on the right side of the chart

<figure><img src="/files/1ndW4wPdGXDojCfvjVoX" alt=""><figcaption></figcaption></figure>

| Option                        | Meaning                                                                                                                                                                    |
| ----------------------------- | -------------------------------------------------------------------------------------------------------------------------------------------------------------------------- |
| Fixed Action Bars             | Permanently displays the action bar next to the chart. However, you always have the possibility to keep the action bar visible by clicking on the "pins" icon (see below). |
| Open on Click in Price Scale  | Displays the action bar only when you click on the price scale panel.                                                                                                      |
| Open on Mouse Move            | Displays the action bar only when you hover the mouse over the price panel.                                                                                                |
| Show Periodicities Slider Bar | Shows/hides the time slider.                                                                                                                                               |
| Show Trading Pads             | Shows/hides the Chart Trading Pad and the DOM, which are located at the top of the Actionbar.                                                                              |

**Arrow Keys** allow you to sort the entry escorts, intervals, instrument lists and the predefined indicators. Click on the object to be moved and relocate it by pressing the arrow keys.

The ActionBar is located to the right-hand side of the chart for quick access to various actions (favorites).

<figure><img src="/files/SWnnY3xT3rZ79JVFLMdC" alt=""><figcaption></figcaption></figure>

| Component         | Meaning                                                                                                                                                                                                                                                                    | Icon                                                                |
| ----------------- | -------------------------------------------------------------------------------------------------------------------------------------------------------------------------------------------------------------------------------------------------------------------------- | ------------------------------------------------------------------- |
| Full Chart        | Maximizes the selected chart or resizes it according to the chart container settings                                                                                                                                                                                       | ![](/files/GGML34MhKNe9MZoRxrh4)                                    |
| Pin               | Pins / unpins the Action bar. Only activated, when "Fixed ActionBars" is deactivated and either "Open on Click in Price Scale" or "Open on Mouse Move" is activated, so user can fix ActionBar impromptu                                                                   | <img src="/files/3b27Rmc8oUYkgIMyyE2P" alt="" data-size="original"> |
| Trading Pad       | Hides or shows the standard chart trading pad/DOM/3rd level box depending upon what has been selected in the chart menu                                                                                                                                                    | <img src="/files/5ZbuPIZFRJ9UAp2ADLF7" alt="" data-size="original"> |
| Show Quick Trader | Opens the Quick Trader                                                                                                                                                                                                                                                     | <img src="/files/aWqO3I1aMB2XKqzVk6W5" alt="" data-size="original"> |
| Chart Trading Pad | Opens the Trading Pad (Standart or AT++)                                                                                                                                                                                                                                   | <img src="/files/CJGYpmkLiwa8u1EusUoQ" alt="" data-size="original"> |
| DOM               | opens the DOM                                                                                                                                                                                                                                                              | <img src="/files/5p0FtfJnZqK67BKnapdL" alt="" data-size="original"> |
| Time frames       | Sets the time frame for a current chart                                                                                                                                                                                                                                    | <img src="/files/VLyrSWULDunBJYSbjHlv" alt="" data-size="original"> |
| Instrument Lists  | Displays the selected instrument lists. If an instrument is already in a list, the text of the equivalent instrument list button will be displayed in red                                                                                                                  | <img src="/files/90KoSB5MJDUHqhuAezCb" alt="" data-size="original"> |
| Entry Escort      | Allows you to select previously defined setups within the Setup Builder. A pair of B(Buy) and S(Sell) buttons refers to one entry strategy. When you use the EntryEscort, AgenaTrader++ will automatically be activated                                                    | <img src="/files/z23xr27Rk4EQPx3zVsZO" alt="" data-size="original"> |
| Indicators        | Displays buttons for indicators that are not permanently visible on the chart. When you hover the cursor above an indicator button it will be shown on the chart. Clicking the button will make the indicator visible on the chart until you unselect it by clicking again | ![](/files/WgnVTp1nF4qDK9K7rlQJ)                                    |

Right click on the blank space to access the **Action bar** settings:

<figure><img src="/files/wtLDYGsMLYP6NW7no9gq" alt=""><figcaption></figcaption></figure>

## Alerts <a href="#configuration_escort__alerts" id="configuration_escort__alerts"></a>

### General <a href="#general-1" id="general-1"></a>

This category describes all user-defined alerts in Agena Trader.

<figure><img src="/files/YGlA98p9pQfuapuR0ctA" alt=""><figcaption></figcaption></figure>

| Right-hand side                                                                                                                                                                               | Meaning                                                                                                                                                                                                                                                                                                                                                                                                                 |
| --------------------------------------------------------------------------------------------------------------------------------------------------------------------------------------------- | ----------------------------------------------------------------------------------------------------------------------------------------------------------------------------------------------------------------------------------------------------------------------------------------------------------------------------------------------------------------------------------------------------------------------- |
| [**Price Alert:**](https://docs.agenatrader.com/tools/tools#Price_Alerts) Send E-mails Show Message Box Enable sound Mobile                                                                   | **Price Alert settings**: Enables or disables the option to receive an e-mail for each triggered price alert. Opens a popup when the price alert is triggered. Enables sound for the alert. Enables Mobile notifications.                                                                                                                                                                                               |
| [**Time Alert:**](https://docs.agenatrader.com/tools/tools#Time_Alerts) Send E-mails Show Message Box Enable sound Mobile                                                                     | **Time Alert settings**: Enables or disables the option to receive an e-mail for each triggered time alert. Opens a popup when the time alert is triggered. Enables sound for the alert. Enables Mobile notifications.                                                                                                                                                                                                  |
| [**Indicator Alert:**](https://docs.agenatrader.com/tools/tools#Indicator_Alerts) Send E-mails Show Message Box Enable sound Mobile                                                           | **Indicator Alert settings**: Enables or disables the option to receive an e-mail for each triggered indicator alert. Opens a popup when the indicator alert is triggered. Enables sound for the alert. Enables Mobile notifications                                                                                                                                                                                    |
| [**Connect/Disconnect Alert:**](https://docs.agenatrader.com/tools/tools#IfDone_OCO_Connections_between_alerts) Send E-mails Show Message Box Enable sound Mobile E-mails Aggregation Timeout | **Connection Alert settings**: Enables or disables the option to receive an e-mail for each triggered connection alert. Opens a popup when the connection alert is triggered. Enables sound for the alert. Enables Mobile notifications. The time during datafeed/broker disconnect emails will be aggregated. For e.g. user choose 00:05:00 time range. It means he will get aggregated disconnect emails every 5 min. |
| Send Mobile Notif. On Order Execution                                                                                                                                                         | Enable mobile notifications for order executions                                                                                                                                                                                                                                                                                                                                                                        |
| Advanced Alert Style                                                                                                                                                                          | Is this function selected, then all triggered alert will be displayed altogether inside the message box. if this function is not activated then the standard settings will be applied and each alert will be shown separately.                                                                                                                                                                                          |

### Sound <a href="#sound" id="sound"></a>

This function allows you to assign different sounds to a particular order type:

<figure><img src="/files/NnAnSsNTTtqDgif1V6kK" alt=""><figcaption></figcaption></figure>

| Market Order Filled    | After the execution of a Market order, selected sound will be played (the checkbox must be checked)   |
| ---------------------- | ----------------------------------------------------------------------------------------------------- |
| Limit Order Filled     | After the execution of a Limit order, selected sound will be played (the checkbox must be checked)    |
| Stop Order Filled      | After the execution of a Stop order, selected sound will be played (the checkbox must be checked)     |
| StopLimit Order Filled | After the execution of a StopLimt order, selected sound will be played (the checkbox must be checked) |
| Disconnected           | After you disconnect broker or datafeed, selected sound will be played (the checkbox must be checked) |

### Email Settings <a href="#email_settings" id="email_settings"></a>

The **Email Settings** allows to set a mailserver. This server will be used to send emails with AgenaTrader information e.g. TimeAlerts, PriceAlerts etc.

The following information can be set in the SMTP tab:

| Default E-mail Address | This E-Mail address is used to send E-Mails from AgenaTrader. Needed for all E-Mail sending features e.g. Send E-Mail for Signals in Setup Builder. (<max@mustermann.com>) |
| ---------------------- | -------------------------------------------------------------------------------------------------------------------------------------------------------------------------- |
| Server address         | e.g. agenatrader.com                                                                                                                                                       |
| SMTP Port              | Default ports are 25, 587, 465                                                                                                                                             |
| Use SSL                | Use secure socket layer for coding and encoding your emails                                                                                                                |
| SMTP Login             | Login data e.g. <user@agenatrader.com>                                                                                                                                     |
| SMTP Password          | Login password                                                                                                                                                             |
| SMTP Password Again    | Login password confirmation                                                                                                                                                |
| From Address           | Address from which the email should be sent                                                                                                                                |
| Test Address           | Allows to check this functionality and send a test E-mail after all necessary data have been inserted.                                                                     |

<figure><img src="/files/QM9xJDW8tKZhtPSMdimG" alt=""><figcaption></figcaption></figure>

**Please note!** Some E-Mail service providers such as Gmail prevent third-party providers from sending E-Mails via SMTP. In this case user must enable this functionality manually by using account settings of the corresponding E-Mail service provider [here](http://support.google.com/accounts/answer/6010255?hl=en). Please go to [Less secure apps](https://www.google.com/settings/security/lesssecureapps) section and **turn on** access for less secure apps.

<figure><img src="https://docs.agenatrader.com/~gitbook/image?url=https%3A%2F%2F2805764894-files.gitbook.io%2F%7E%2Ffiles%2Fv0%2Fb%2Fgitbook-legacy-files%2Fo%2Fassets%252F-MKZSsJBtSP9L4sqIe_q%252F-MQCFungwxhiajGNAIdb%252F-MQCKoPjH3FqzRfOVfFM%252FGmail%2520secure.PNG%3Falt%3Dmedia%26token%3D188fc32f-778d-46aa-9cee-cd8e2a91b554&#x26;width=768&#x26;dpr=4&#x26;quality=100&#x26;sign=1f8f7ede&#x26;sv=1" alt=""><figcaption></figcaption></figure>

**Correct settings for Gmail:**

<figure><img src="/files/oGjFDct01bnBSuybMDwL" alt=""><figcaption></figcaption></figure>

**Server address:** smtp.gmail.com **SMTP Port:** 587 **Use SSL/TLS:** on

### Notifier  <a href="#notifier_en" id="notifier_en"></a>

Notifier settings allow you to activate Mobile Notifier for your device:

<figure><img src="https://docs.agenatrader.com/~gitbook/image?url=https%3A%2F%2F2805764894-files.gitbook.io%2F%7E%2Ffiles%2Fv0%2Fb%2Fgitbook-legacy-files%2Fo%2Fassets%252F-MKZSsJBtSP9L4sqIe_q%252F-MQCFungwxhiajGNAIdb%252F-MQCL7KPemuH6We7aHAk%252FNotifier.png%3Falt%3Dmedia%26token%3Db132b910-e440-42b5-be52-0856e5d53961&#x26;width=768&#x26;dpr=4&#x26;quality=100&#x26;sign=6e35c764&#x26;sv=1" alt=""><figcaption></figcaption></figure>

In order to activate Android device please activate **Android** checkbox and insert your device token in **Android Device ID** fiel&#x64;**.**

In order to activate iPhone please select **iOs (iPhone, iPad)** checkbox and insert your device token in **iOS Device ID** fiel&#x64;**.**

### AgenaTrader notifier APP

You, the trader, are supported by a comprehensive, functionally diverse trading platform - yes, this is everything your trader heart desires. However, when it comes to the essential functions, then everything must be visible at a glance. Now, we are providing you with a COMPLETELY NEW feature precisely for this purpose, the AgenaTrader Notifier Mobile APP. You can now find trading signals, order executions and more in a clear mobile layout in an APP for Android smartphones and available in the Google Play Store.

[Link to the Google Play Store](https://play.google.com/store/apps/details?id=com.agena.trader.notifier)

#### The pager of the future <a href="#the_pager_of_the_future" id="the_pager_of_the_future"></a>

A trading or chart analysis platform without status notifications! Can you still imagine such a thing? Never being informed when a market in your watch list has reached a price level that interests you? Never being informed when one of your trading signals appears, when your orders are executed or when the connection to the data feed and the broker is interrupted?

This would mean permanently lingering in front of your trading PC. Constantly checking the signals or price levels of your trading symbols and much more. At the end of the day, your eyes are tired and your head is spinning with the effort.

How great that this advanced trading software automates and spares you this work! It makes your work easier with notifications using sound, popup windows or directly via email in your inbox, announcing events exactly as they happen.

AgenaTrader, a professional trading platform for traders with high demands for their trading software, supports all these features and then some. But now you can also get excited about the first mobile APP from the AgenaTrader software team. The AgenaTrader Notifier Mobile APP keeps you up to date on your trading and your signals via smartphone.

You want to go for a walk, play golf, or go swimming after all manual settings have been made in AgenaTrader and your orders are active with the broker? No problem, since you receive your updates and all important status notifications directly on your phone. No more inconvenient email configurations and messages mixed in with your other emails. Starting right now you can find everything from one single AgenaTrader source!

![](https://docs.agenatrader.com/~gitbook/image?url=https%3A%2F%2F2805764894-files.gitbook.io%2F%7E%2Ffiles%2Fv0%2Fb%2Fgitbook-legacy-files%2Fo%2Fassets%252F-MKZSsJBtSP9L4sqIe_q%252F-MQwaBAfMfkSUH6IVZlQ%252F-MQwdnxzvTw_ezvC9QTu%252Fall.png%3Falt%3Dmedia%26token%3Daea26a3a-f182-4508-969f-247a2b3602da\&width=768\&dpr=4\&quality=100\&sign=3ecb864\&sv=1)

#### Range of functions of the AgenaTrader Notifier Mobile APP <a href="#range_of_functions_of_the_agenatrader_notifier_mobile_app" id="range_of_functions_of_the_agenatrader_notifier_mobile_app"></a>

The APP offers the following status notifications:

* Trading signals
* Order executions
* Alerts
* Connection status for broker and data feed

#### Trading signals <a href="#trading_signals" id="trading_signals"></a>

Whether it's scripted or drag & drop conditions from the Signal Builder. When the multi-timeframe and multi-data series scanner discovers one of your signals, starting right now, it is no longer just shown in the scanner, notified via sound or popup or messaged to you by email; it is also displayed in our AgenaTrader Android Smartphone APP.

![](https://docs.agenatrader.com/~gitbook/image?url=https%3A%2F%2F2805764894-files.gitbook.io%2F%7E%2Ffiles%2Fv0%2Fb%2Fgitbook-legacy-files%2Fo%2Fassets%252F-MKZSsJBtSP9L4sqIe_q%252F-MQwaBAfMfkSUH6IVZlQ%252F-MQwds-g-xky5OrnJD-V%252Fsignals.png%3Falt%3Dmedia%26token%3D02b31204-cc97-438b-aaef-e12c2de4b968\&width=768\&dpr=4\&quality=100\&sign=10274039\&sv=1)

#### Order executions <a href="#order_executions" id="order_executions"></a>

Let's assume your orders are placed in the market. Entry order with a stop loss and two targets. Now you are tensely awaiting the execution of the first order with the entry, and following this, the hopefully positive progression of your trade. As you do so, you are sitting at your PC, stressed out.

Now instead of this, imagine you are sitting comfortably in a hammock or in the deckchair in your garden, balcony or any other cozy spot as you do so, and this information is served to you on a silver platter. That's right - as a notification in the AgenaTrader Notifier Mobile APP. You are informed when the entry is carried out, and then again when targets or stops are reached.

![](https://docs.agenatrader.com/~gitbook/image?url=https%3A%2F%2F2805764894-files.gitbook.io%2F%7E%2Ffiles%2Fv0%2Fb%2Fgitbook-legacy-files%2Fo%2Fassets%252F-MKZSsJBtSP9L4sqIe_q%252F-MQwaBAfMfkSUH6IVZlQ%252F-MQwdw3NTDEymhI2egJr%252Fexecutions.png%3Falt%3Dmedia%26token%3Df14d89f0-dac6-4a97-ba89-174dd05d0d36\&width=768\&dpr=4\&quality=100\&sign=70b62a00\&sv=1)

#### Alerts <a href="#alerts" id="alerts"></a>

Price, time or indicator alerts; you receive all three neatly listed in the AgenaTrader Notifier Mobile APP. Make your decisions via smartphone, and only invest time in front of your trading PC when you deem it necessary. No need to waste any more time on routine checks on your trading PC.

![](https://docs.agenatrader.com/~gitbook/image?url=https%3A%2F%2F2805764894-files.gitbook.io%2F%7E%2Ffiles%2Fv0%2Fb%2Fgitbook-legacy-files%2Fo%2Fassets%252F-MKZSsJBtSP9L4sqIe_q%252F-MQwaBAfMfkSUH6IVZlQ%252F-MQwe-GGPZ8WvNbWgSoJ%252Falerts.png%3Falt%3Dmedia%26token%3Da2658976-c39d-4b19-b5cd-4673ea3a54dd\&width=768\&dpr=4\&quality=100\&sign=44a3795c\&sv=1)

#### Connection status <a href="#connection_status" id="connection_status"></a>

Last but no less relevant, we now additionally notify you if the connection to the broker or the data feed is lost. This means that you stay informed of your internet connection quality and can act quickly if the connection bar changes from green to red. This allows you to keep a clear head, freeing you of thoughts such as: "Hopefully the connection is still good and my trading setups are being carried out correctly."

![](https://docs.agenatrader.com/~gitbook/image?url=https%3A%2F%2F2805764894-files.gitbook.io%2F%7E%2Ffiles%2Fv0%2Fb%2Fgitbook-legacy-files%2Fo%2Fassets%252F-MKZSsJBtSP9L4sqIe_q%252F-MQwaBAfMfkSUH6IVZlQ%252F-MQwe3_UIbg7DgXlCNE5%252Fconnection.png%3Falt%3Dmedia%26token%3D52bf0619-b5db-46e9-9f45-973d8e8a6204\&width=768\&dpr=4\&quality=100\&sign=a62c10d4\&sv=1)

#### Download via the Google Play Store <a href="#download_via_the_google_play_store" id="download_via_the_google_play_store"></a>

Open the Google Play Store and enter "AgenaTrader Notifier" into the search bar. Select the APP, click on "install" and accept the license conditions. After the download and installation, the APP can be started.

[Link to the Google Play Store](https://play.google.com/store/apps/details?id=com.agena.trader.notifier)

![](https://docs.agenatrader.com/~gitbook/image?url=https%3A%2F%2F2805764894-files.gitbook.io%2F%7E%2Ffiles%2Fv0%2Fb%2Fgitbook-legacy-files%2Fo%2Fassets%252F-MKZSsJBtSP9L4sqIe_q%252F-MQwaBAfMfkSUH6IVZlQ%252F-MQwe9bZWZ_V_xD8g8Mm%252Fdownload.png%3Falt%3Dmedia%26token%3Dd368779c-c44e-4337-be20-91f19bb54491\&width=768\&dpr=4\&quality=100\&sign=6ae956ea\&sv=1)

#### How to connect the APP to AgenaTrader <a href="#how_to_connect_the_app_to_agenatrader" id="how_to_connect_the_app_to_agenatrader"></a>

Open the "Send Device Token" function using the 'triple-dot symbol...' in the upper right edge of the screen. The first field shows the token. This is a key consisting of numbers, symbols and letters. If you do not want to copy this out, then enter your email address (e.g.: <jsmith@example.com>) in the second field and click on "Send"

![](https://docs.agenatrader.com/~gitbook/image?url=https%3A%2F%2F2805764894-files.gitbook.io%2F%7E%2Ffiles%2Fv0%2Fb%2Fgitbook-legacy-files%2Fo%2Fassets%252F-MKZSsJBtSP9L4sqIe_q%252F-MQwaBAfMfkSUH6IVZlQ%252F-MQweEW2pqH-1Yd9qEfg%252Fverbinden.png%3Falt%3Dmedia%26token%3D837d8d56-e457-42a9-bc2f-84847f93c8d2\&width=768\&dpr=4\&quality=100\&sign=afb26d91\&sv=1)![](https://docs.agenatrader.com/~gitbook/image?url=https%3A%2F%2F2805764894-files.gitbook.io%2F%7E%2Ffiles%2Fv0%2Fb%2Fgitbook-legacy-files%2Fo%2Fassets%252F-MKZSsJBtSP9L4sqIe_q%252F-MQwaBAfMfkSUH6IVZlQ%252F-MQweJ6-3zs62BB4_KSl%252Fsend%2520token.png%3Falt%3Dmedia%26token%3Defc0e492-f7b1-4fe8-9fcb-bd27f584f0b4\&width=768\&dpr=4\&quality=100\&sign=32adadde\&sv=1)

Shortly after this, you will find an email in your email inbox with the token. Check the spam folder too if necessary. Now open the Global Configuration in AgenaTrader. In the tree menu, select the alerts and then the Notifier. Once you have briefly clicked on Android and copied the token into the text box by copying and pasting from the email, the connection is activated by clicking on the "Apply" button.

After this, switch to the subcategory "General" in the alerts, and activate the respective notifications there using the five "Mobile" checkboxes. Conclude the procedure by clicking on the OK button.

In the Setup Builder, you then also select which signals a notification should be sent for, and to do so, you select the entry signal in the parameter settings, and set the option "SendSignalMobileNotification" to true.

![](https://docs.agenatrader.com/~gitbook/image?url=https%3A%2F%2F2805764894-files.gitbook.io%2F%7E%2Ffiles%2Fv0%2Fb%2Fgitbook-legacy-files%2Fo%2Fassets%252F-MKZSsJBtSP9L4sqIe_q%252F-MQwaBAfMfkSUH6IVZlQ%252F-MQweOBOrSmDxsWT6GJD%252FconfigNotifier.png%3Falt%3Dmedia%26token%3Db6fa3cc8-c510-435b-b108-4888c024c682\&width=768\&dpr=4\&quality=100\&sign=c38eb7e0\&sv=1)![](https://docs.agenatrader.com/~gitbook/image?url=https%3A%2F%2F2805764894-files.gitbook.io%2F%7E%2Ffiles%2Fv0%2Fb%2Fgitbook-legacy-files%2Fo%2Fassets%252F-MKZSsJBtSP9L4sqIe_q%252F-MQwaBAfMfkSUH6IVZlQ%252F-MQweRYGemXrTTVxefb6%252FconfigMobile.png%3Falt%3Dmedia%26token%3D635b5705-e734-45fe-a717-1ddffc84fe2d\&width=768\&dpr=4\&quality=100\&sign=a3d62b55\&sv=1)![](https://docs.agenatrader.com/~gitbook/image?url=https%3A%2F%2F2805764894-files.gitbook.io%2F%7E%2Ffiles%2Fv0%2Fb%2Fgitbook-legacy-files%2Fo%2Fassets%252F-MKZSsJBtSP9L4sqIe_q%252F-MQwaBAfMfkSUH6IVZlQ%252F-MQweVl9_dgNcKRk1YT7%252FsetupEscort.png%3Falt%3Dmedia%26token%3Dd96e47d7-3589-4f46-aae2-a15e4f04f9e9\&width=768\&dpr=4\&quality=100\&sign=27b1df18\&sv=1)

Stay connected with the AgenaTrader Notifier Mobile APP!

**Important!** Please find details how to get token on our page [Notifie](https://docs.agenatrader.com/tools/configuration-escort#Notifier_en_)

**IMPORTANT NOTE:** Exchange transactions are associated with significant risks. Those who trade on the financial and commodity markets must familiarize themselves with these risks. Possible analyses, techniques and methods presented here are not an invitation to trade on the financial and commodity markets. They serve only for illustration, further education, and information purposes, and do not constitute investment advice or personal recommendations in any way. They are intended only to facilitate the customer's investment decision, and do not replace the advice of an investor or specific investment advice. The customer trades completely at his or her own risk.

AT++ Manager

Setup Builder

Signal Builder

## Hot Keys <a href="#configuration_escort__hot_keys" id="configuration_escort__hot_keys"></a>

This functionality enables you to assign various keystrokes as hotkeys.

There are several categories within the popup:

<figure><img src="https://docs.agenatrader.com/~gitbook/image?url=https%3A%2F%2F2805764894-files.gitbook.io%2F%7E%2Ffiles%2Fv0%2Fb%2Fgitbook-legacy-files%2Fo%2Fassets%252F-MKZSsJBtSP9L4sqIe_q%252F-MQCFungwxhiajGNAIdb%252F-MQCLQpg6tVdvrzb_5e6%252FHotkeys1.PNG%3Falt%3Dmedia%26token%3Df4301b56-7988-4374-b226-4fb3d9630836&#x26;width=768&#x26;dpr=4&#x26;quality=100&#x26;sign=8bcb5ed4&#x26;sv=1" alt=""><figcaption></figcaption></figure>

Many key combinations are preset in AgenaTrader but you can customize them according to your own preferences:

1. Left click in the field where the hot key is to be assigned
2. Enter the key from your keyboard in the field **New Hot Key for this Action**.
3. Click the **Assign** button to activate the new hot keys.

<figure><img src="https://docs.agenatrader.com/~gitbook/image?url=https%3A%2F%2F2805764894-files.gitbook.io%2F%7E%2Ffiles%2Fv0%2Fb%2Fgitbook-legacy-files%2Fo%2Fassets%252F-MKZSsJBtSP9L4sqIe_q%252F-MQCFungwxhiajGNAIdb%252F-MQCLVZBm6YRBmaUCpGs%252FHotkeys2.PNG%3Falt%3Dmedia%26token%3Ddc00657a-74ac-4d4a-9877-0f567f42b099&#x26;width=768&#x26;dpr=4&#x26;quality=100&#x26;sign=220ec89c&#x26;sv=1" alt=""><figcaption></figcaption></figure>

*The other buttons in the popup have the following functions:*

* Clear: deletes unconfirmed hot keys.
* Remove: deactivates the command and assigns "None" to the hot key.
* Restore Default Settings: returns all hot keys to the default settings.

**Multiple functions:** 1 key: e.g. F1 or 3 or T 2 keys: Switch or CTRL or ALT + Key 3 keys: Switch & CTRL + Key 4 keys: Switch & CTRL & ALT + Key

**Print Shortcuts**

Click the right mouse button and open the print options:

* Print: only the selected category will be printed.
* Print all: all categories will be printed.

<figure><img src="https://docs.agenatrader.com/~gitbook/image?url=https%3A%2F%2F2805764894-files.gitbook.io%2F%7E%2Ffiles%2Fv0%2Fb%2Fgitbook-legacy-files%2Fo%2Fassets%252F-MKZSsJBtSP9L4sqIe_q%252F-MQCFungwxhiajGNAIdb%252F-MQCL_k7D2BLmVRsL_SY%252FHotkeys3.PNG%3Falt%3Dmedia%26token%3D8a50994b-c722-4779-a29e-f88cfb4e5e9b&#x26;width=768&#x26;dpr=4&#x26;quality=100&#x26;sign=f015df33&#x26;sv=1" alt=""><figcaption></figcaption></figure>

#### Chart Groups <a href="#chart-groups" id="chart-groups"></a>

Allows user to assign various key strokes as hot keys for chart group.

Commands:

* Mark item
* Mazimize/Minimize chart
* Reload
* Reload selected instrument lists
* Reset marked item

**Mark Item** With this hotkey, You can mark/color a symbol:

<figure><img src="https://docs.agenatrader.com/~gitbook/image?url=https%3A%2F%2F2805764894-files.gitbook.io%2F%7E%2Ffiles%2Fv0%2Fb%2Fgitbook-legacy-files%2Fo%2Fassets%252F-MKZSsJBtSP9L4sqIe_q%252F-MQClv58ENCsyaHRTnHR%252F-MQEQ2Za2s5cpBQsWpz_%252Fscanner-LCG2.png%3Falt%3Dmedia%26token%3Da27b5f80-70ca-4937-862c-96c278d40e2b&#x26;width=768&#x26;dpr=4&#x26;quality=100&#x26;sign=725e121c&#x26;sv=1" alt=""><figcaption></figcaption></figure>

*"Please find detail on page* [***Scanner context menu: Scanner for a list chart group***](https://docs.agenatrader.com/main/chart-area/realtime-scanner/scanner-settings#scanner-for-a-list-chart-group)*"*

**Reset marked item** Allows you to undo a symbol's marking. *"Please find detail on page* [***Scanner for a list chart group***](https://docs.agenatrader.com/main/chart-area/realtime-scanner/scanner-settings#scanner-for-a-list-chart-group)*"*

**Mazimize/Minimize chart** Allows you to maximize or minimize selected chart *"Please find detail on page* [***ActionBar***](https://docs.agenatrader.com/main/chart-area/actionbar)*"*

**Reload** Allows you to reload the whole scanner. *"Please find detail on page* [***Scanner context menu: Reload***](https://docs.agenatrader.com/main/chart-area/realtime-scanner/scanner-settings#reload)*"*

**Reload selected instrument lists** Allows you to reload multiple instrument lists. *"Please find detail on page* [***Scanner context menu: Reload instrument lists***](https://docs.agenatrader.com/main/chart-area/realtime-scanner/scanner-settings#reload-instrument-lists)*"*

#### Chart <a href="#chart-1" id="chart-1"></a>

Allows user to assign various key strokes as hot keys for single chart.user to assign various key strokes as hot keys for single chart. Commands:

* Add Indicator Alert
* Add Price Alert
* Cancel
* Chart public mode
* Copy Object
* Decrease Timeframe
* Enable Global Drawing
* H-Scroll Left
* H-Scroll Right
* H-ZoomIn
* H-ZoomOut
* Increase Timeframe
* Paste Object
* Price Alert Lines
* Print
* Quick Trader
* Reload Data
* Reload Scripts
* Remove
* Remove All Drawing Objects
* Save as Image
* Show Drawings
* Spread Lines
* Spread Markers
* Toogle Crosshair/Pointer
* Trade Markers
* Trader Bars
* Trader Lines
* V-ZoomIn
* V-ZoomOut

**Add Indicator Alert**

Allows you to set an alert that will inform you when a particular indicator crosses the specified price level. *Details on page* [***Chart Context Menu: Add Indicator Alert***](https://docs.agenatrader.com/main/chart-area/untitled/chart-context-menu#add-indicator-alert)

**Add Price Alert**

Allows you to set an alert that will inform you when price crossed the specified level *Details on page* [***Chart Context Menu: Add price alert***](https://docs.agenatrader.com/main/chart-area/untitled/chart-context-menu#add-price-alert)

**Cancel**

With this hot key user may quit drawing mode. *Details on page* [***Chart Toolbar: Drawing objects***](https://docs.agenatrader.com/main/chart-area/untitled/drawing-objects)

**Chart public mode**

Enable public mode *Details on page* [***Chart Toolbar: Public Mode***](https://docs.agenatrader.com/main/chart-area/untitled/public-mode)

**Copy Object**

Copy drawing object *Details on page* [***Chart Toolbar: Drawing objects***](https://docs.agenatrader.com/main/chart-area/untitled/drawing-objects)

**Decrease Timeframe**

Decrease Timeframe for selected chart. *Details on page* [***Chart Toolbar: Time frame***](https://docs.agenatrader.com/main/chart-area/untitled/time-frame) *and* [***Time frame regulator***](https://docs.agenatrader.com/main/chart-area/actionbar#time-frame-regulator)

**Increase Timeframe**

Increase Timeframe for selected chart. *Details on page* [***Chart Toolbar: Time frame***](https://docs.agenatrader.com/main/chart-area/untitled/time-frame) *and* [***Time frame regulator***](https://docs.agenatrader.com/main/chart-area/actionbar#time-frame-regulator)

**Enable Global Drawing**

Display drawing objects on all charts *Details on page* [***Global drawing objects***](https://docs.agenatrader.com/main/chart-area/untitled/drawing-objects#Global_drawing_objects)

**Paste Object**

Paste copied object *Details on page* [***Chart Toolbar: Drawing objects***](https://docs.agenatrader.com/main/chart-area/untitled/drawing-objects)

**Price Alert Lines**

Display price alert lines on a chart. *Details on page* [***Chart Toolbar: Price markers and spread markers***](https://docs.agenatrader.com/main/chart-area/untitled/price-markers-and-spread-markers)

**Print**

Enable to print selected chart *Details on page* [***Chart Toolbar: Print***](https://docs.agenatrader.com/main/chart-area/untitled/print)

**Quick Trader**

Enable Quick Trader *Details on page* [***Quick Trader***](https://docs.agenatrader.com/main/chart-area/actionbar#ActionBar__Quick_Trader__en_)

**Reload Data**

Reload chart data *Details on page* [***Chart Context Menu: Reload data***](https://docs.agenatrader.com/main/chart-area/untitled/chart-context-menu#reload-data)

**Reload Scripts**

Allows you to recalculate all indicators. *Details on page* [***Chart Context Menu: Reload scripts***](https://docs.agenatrader.com/main/chart-area/untitled/chart-context-menu#reload-scripts)

**Remove**

Remove selected drawing object *Details on page* [***Chart Toolbar: Drawing objects***](https://docs.agenatrader.com/main/chart-area/untitled/drawing-objects)

**Remove All Drawing Objects**

Remove all drawings from the chart *Details on page* [***Chart Toolbar: Drawing objects***](https://docs.agenatrader.com/main/chart-area/untitled/drawing-objects)

**Save as Image**

Save a snapshot of the chart *Details on page* [***Chart Toolbar: Saving as image***](https://docs.agenatrader.com/main/chart-area/untitled/saving-as-image)

**Show Drawings**

Display Drawings on a chart *Details on page* [Types ***of drawing objects***](https://docs.agenatrader.com/main/chart-area/untitled/drawing-objects/types-of-drawing-objects)

**Spread Lines**

Display Spread Lines on a chart *Details on page* [***Chart Toolbar: Price markers and spread markers***](https://docs.agenatrader.com/main/chart-area/untitled/price-markers-and-spread-markers)

**Spread Markers**

Display Spread Markers on a chart *Details on page* [***Chart Toolbar: Price markers and spread markers***](https://docs.agenatrader.com/main/chart-area/untitled/price-markers-and-spread-markers)

**Toogle Crosshair/Pointer**

Switch between mouse Crosshair and Pointer *Details on page* [***Chart Toolbar: Cursor type***](https://docs.agenatrader.com/main/chart-area/untitled/cursor-type)

**Trade Markers**

Display trade markers on a chart:

<figure><img src="https://docs.agenatrader.com/~gitbook/image?url=https%3A%2F%2F2805764894-files.gitbook.io%2F%7E%2Ffiles%2Fv0%2Fb%2Fgitbook-legacy-files%2Fo%2Fassets%252F-MKZSsJBtSP9L4sqIe_q%252F-MQClv58ENCsyaHRTnHR%252F-MQEQe-q8gS70bGvRKfl%252Ftrader%2520markers.png%3Falt%3Dmedia%26token%3D285f6f04-12b6-4e44-a46e-3f65102300a2&#x26;width=768&#x26;dpr=4&#x26;quality=100&#x26;sign=68215d99&#x26;sv=1" alt=""><figcaption></figcaption></figure>

**Trader Bars**

Enable/disable the chart ordersbars *Details on page* [***Chart Trading: Chart trader bars***](https://docs.agenatrader.com/main/chart-area/untitled/chart-context-menu#Chart_traders_bars)

**Trader Lines**

Enable/disable Traders Lines

<figure><img src="https://docs.agenatrader.com/~gitbook/image?url=https%3A%2F%2F2805764894-files.gitbook.io%2F%7E%2Ffiles%2Fv0%2Fb%2Fgitbook-legacy-files%2Fo%2Fassets%252F-MKZSsJBtSP9L4sqIe_q%252F-MQClv58ENCsyaHRTnHR%252F-MQEQjch3byiMsj0Hx9r%252Ftrader%2520lines.png%3Falt%3Dmedia%26token%3D983a38fa-db2d-489a-873e-548409e46049&#x26;width=768&#x26;dpr=4&#x26;quality=100&#x26;sign=9e13d3f2&#x26;sv=1" alt=""><figcaption></figcaption></figure>

#### ChartPads <a href="#chartpads" id="chartpads"></a>

Allows user to assign various key strokes as hot keys for Chart Pads through ActionBar

* Toggle DOM
* Toggle Local Point
* Toggle OrderStream
* Toggle Standart Chart Trading Pad

**Toggle DOM**

Enable DOM (depth of the market) on a chart *Detail on page* [***DOM***](https://docs.agenatrader.com/main/main-menu/dom)

**Toggle Local Point**

Enable Local Point on a chart ***'in development*****'**

**Toggle OrderStream**

Enable OrderStream Pad *Detail on page* [***OrderStream***](https://docs.agenatrader.com/main/chart-area/orderstream)

**Toggle Standart Chart Trading Pad**

Enable Standart Chart Trading Pad *Detail on page* [***Chart Toolbar: Standard chart trading pad***](https://docs.agenatrader.com/main/chart-area/untitled/standard-chart-trading-pad)

#### Bar Types <a href="#bar-types" id="bar-types"></a>

Allows user to assign various key strokes as hot keys for Bar Types

Commands:

* Bar Chart
* Candle Chart
* Candle Volume
* Darvas Boxes
* EquiVolume
* EquiVolume Shadow
* Heikin Ashi
* Line Chart
* Mountain Chart

**Bar Chart**

Display Bar Chart *Details on page* [***Bar Chart***](https://docs.agenatrader.com/main/chart-area/untitled/price-styles#bar-chart)

**Candle Chart**

Display Candle Chart *Details on page* [***Candle Chart***](https://docs.agenatrader.com/main/chart-area/untitled/price-styles#candle-chart)

**EquiVolume**

Display EquiVolume Chart *Details on page* [***EquiVolume***](https://docs.agenatrader.com/main/chart-area/untitled/price-styles#equivolume-chart)

**EquiVolume Shadow**

Display EquiVolume Shadow Chart *Details on page* [***EquiVolume Shadow***](https://docs.agenatrader.com/main/chart-area/untitled/price-styles#equivolume-shadow-chart)

**Heikin Ashi**

Display Heikin Ashi Chart *Details on page* [***Heikin Ashi Chart***](https://docs.agenatrader.com/main/chart-area/chart-container/chart-types#Heikin_Ashi)

**Line Chart**

Display Line Chart *Details on page* [***Line Chart***](https://docs.agenatrader.com/main/chart-area/untitled/price-styles#line-chart)

**Mountain Chart**

Display Mountain Chart *Details on page* [***Mountain Chart***](https://docs.agenatrader.com/main/chart-area/untitled/price-styles#mountain-chart)

#### Drawing Objects <a href="#drawing-objects" id="drawing-objects"></a>

Allows user to assign various key strokes as hot keys for Drawing Objects Commands:

* Andrew's Pitchfork
* Arc
* Arrow Down
* Arrow Left
* Arrow Line
* Arrow Right
* Arrow Up
* Chart Ruler
* Diamond
* Dot
* Eliott Wave
* Ellipse
* Fibonacci Arcs
* Fibonacci Projections
* Fibonacci Retracements
* Fibonacci Time Zones
* Free Hand Drawing
* Gan Fan
* Horizontal Line
* Quadrant Lines
* Raff Regression
* Rectangle
* Slope Counter Trend
* Slope Trend
* Square
* Text Object
* Tirone Levels
* Trend Channel
* Trend Line
* Trend Line Advanced
* Triangle
* Vertical Line

**Important!** Please find details about drawing on pages [**Drawing objects** ](https://docs.agenatrader.com/main/chart-area/untitled/drawing-objects)and [**Types of drawing objects**](https://docs.agenatrader.com/main/chart-area/untitled/drawing-objects/types-of-drawing-objects)

#### OrdersTemplates <a href="#orderstemplates" id="orderstemplates"></a>

Allows the user to assign various key strokes as hot keys for Orders Template. To assign keys user should create orders template:

**Important!** Please find details how to create orders template on page [**Chart Toolbar: Orders templates**](https://docs.agenatrader.com/main/chart-area/untitled/orders-templates)

#### InstrumentLists <a href="#instrumentlists" id="instrumentlists"></a>

Allows user to assign various key strokes as hot keys for adding instruments to your favorites lists To assign keys user should add Instrument Lists to an ActionBar

**Important!** Please find details how to add Instrument Lists on page [**ActionBar**](https://docs.agenatrader.com/main/chart-area/actionbar)

#### StandardIndicators <a href="#standardindicators" id="standardindicators"></a>

Allows user to assign various key strokes as hot keys for adding quick indicators. To assign keys user should add Indicators to an ActionBar

**Important!** Please find details how add indicators on page [**ActionBar**](https://docs.agenatrader.com/main/chart-area/actionbar)

#### TimeFrames <a href="#timeframes" id="timeframes"></a>

Allows the user to assign various key strokes as hot keys to switch between different time frames.

To assign keys user should add Time Frame to an ActionBar

**Important!** Please find details how to add time frames on page [**ActionBar**](https://docs.agenatrader.com/main/chart-area/actionbar)

#### Trading <a href="#trading_hotkeys" id="trading_hotkeys"></a>

Allows user to assign various key strokes as hot keys for Orders

Commands:

* Buy-Limit 1 Tick below Bid
* Buy-Limit 3 Tick below Bid
* Buy-Limit @ Inside-Bid
* Buy-Market
* Buy-Stop 1 Tick above Ask
* Buy-Stop 3 Tick above Ask
* Cancel Last Order
* Cancel all Orders
* Flatten trader
* Reverse trader
* Sell-Limit 1 Tick above Ask
* Sell-Limit 3 Tick above Ask
* Sell-Limit at Inside Ask
* Sell-Market
* Sell-Stop 1 Tick below Bid
* Sell-Stop 3 Tick below Bid

#### TradeEscort <a href="#tradeescort" id="tradeescort"></a>

Allows user to assign various key strokes as hot keys for Trading Setups.

To place order on a chart via TradeEscort hotkeys, the user should also press **Ctrl** for long and **Alt** button for short orders.

For example, user assign **K** button for ManualMode as a Hotkey. On a chart, the user should press **Ctrl + K** to place long or **Alt + K** to place short order.

In other case you will get message:

<figure><img src="https://docs.agenatrader.com/~gitbook/image?url=https%3A%2F%2F2805764894-files.gitbook.io%2F%7E%2Ffiles%2Fv0%2Fb%2Fgitbook-legacy-files%2Fo%2Fassets%252F-MKZSsJBtSP9L4sqIe_q%252F-MQClv58ENCsyaHRTnHR%252F-MQERVPUyocy9FN7nd6i%252FError.png%3Falt%3Dmedia%26token%3Da8a4e59a-878c-44e9-af1f-db9af3c32c98&#x26;width=768&#x26;dpr=4&#x26;quality=100&#x26;sign=15cff9e9&#x26;sv=1" alt=""><figcaption></figcaption></figure>

**Important!** Please find details how create Trading Setup on section [**Signal Builder**](https://docs.agenatrader.com/create-your-own-trading-strategy/condition-escort)

#### Global <a href="#global" id="global"></a>

Allows user to assign various key strokes as hot keys for AgenaTrader global settings

Commands:

* Compile
* Flatten All
* Lock AgenaTrader
* Reload Connected

**Compile**

Compile script Indicators, Strategies, etc *Details on page* [***Scripting: Compile***](https://docs.agenatrader.com/create-your-own-trading-strategy/scripting#Scripting__Compile)

**Flatten All**

Flatten all position and orders

**Lock AgenaTrader**

Lock AgenaTrader. To unlock user should define the password. *Details on page* [***Global Configuration: Login***](https://docs.agenatrader.com/tools/configuration-escort#login)

## Directories <a href="#directories" id="directories"></a>

The **Directories category** enables you to set directories' paths.

<figure><img src="https://docs.agenatrader.com/~gitbook/image?url=https%3A%2F%2F2805764894-files.gitbook.io%2F%7E%2Ffiles%2Fv0%2Fb%2Fgitbook-legacy-files%2Fo%2Fassets%252F-MKZSsJBtSP9L4sqIe_q%252F-MQClv58ENCsyaHRTnHR%252F-MQES2XNHPVpGrZrgYyD%252FConfig-Directories.png%3Falt%3Dmedia%26token%3Ddb68e513-f3b9-46d8-a8f6-ca4c36d58aa5&#x26;width=768&#x26;dpr=4&#x26;quality=100&#x26;sign=7254c98e&#x26;sv=1" alt=""><figcaption></figcaption></figure>

This tab shows the following:

|                  |                                                                                                                                                                                                                                                                                                                                              |
| ---------------- | -------------------------------------------------------------------------------------------------------------------------------------------------------------------------------------------------------------------------------------------------------------------------------------------------------------------------------------------- |
| User's directory | Folder containing the user data needed to maintain the same appearance for the workspace, templates, self-programmed indicators etc. (if you work for example using Dropbox or server). The file **store.sdf** contains all the information about executed trades, orders, OrdersLog, instrument and connection settings, alerts, and notes. |
| Data Directory   | Folder containing local user data such as history, protocol, replay data, etc.                                                                                                                                                                                                                                                               |

**User directory**

The user data is automatically saved in the ".../Documents/AgenaTrader" folder. You can change this manually in the [**Global Configuration**](https://docs.agenatrader.com/tools/configuration-escort).

<figure><img src="https://docs.agenatrader.com/~gitbook/image?url=https%3A%2F%2F2805764894-files.gitbook.io%2F%7E%2Ffiles%2Fv0%2Fb%2Fgitbook-legacy-files%2Fo%2Fassets%252F-MKZSsJBtSP9L4sqIe_q%252F-MQClv58ENCsyaHRTnHR%252F-MQESCc641GAilPJ9ce9%252Fuser_directory1.png%3Falt%3Dmedia%26token%3D28b954e2-d855-41c3-9ee7-df82a0c52e8e&#x26;width=768&#x26;dpr=4&#x26;quality=100&#x26;sign=51f66ce6&#x26;sv=1" alt=""><figcaption></figcaption></figure>

*The following folders are contained in the user's directory:*

* Templates - contains saved templates for list chart groups or tab chart groups as well as your pre-settings for various drawing objects (Fibonacci-retracements etc).
* TradeEscort/Files/Date/AgenaTraderLog.log - the log files for each individual day.
* TradeEscort/Files/Date/Chart images/Trade - screenshots that are automatically taken after a trade.
* UserCode. Please read more about the UserCode directory in the section: [Scripting: Compile](https://docs.agenatrader.com/create-your-own-trading-strategy/scripting#Scripting__Compile).
* Workspaces - your workspaces are saved in this folder.

**Data directory**

<figure><img src="https://docs.agenatrader.com/~gitbook/image?url=https%3A%2F%2F2805764894-files.gitbook.io%2F%7E%2Ffiles%2Fv0%2Fb%2Fgitbook-legacy-files%2Fo%2Fassets%252F-MKZSsJBtSP9L4sqIe_q%252F-MQClv58ENCsyaHRTnHR%252F-MQESJdVlXgjfXSf6ixR%252Fdata_directory.png%3Falt%3Dmedia%26token%3D6ebd7c59-91f0-452b-b176-6c993f328ce9&#x26;width=768&#x26;dpr=4&#x26;quality=100&#x26;sign=cc235e48&#x26;sv=1" alt=""><figcaption></figcaption></figure>

* History - contains saved historical data from your data feed provider. Under certain circumstances this folder may become rather large.
* Logs - specific log data is saved here.
* Replay Data - contains saved replay data. Similar to the history folder, this folder may become large as well.

{% hint style="info" %}
**Important!**

AgenaTrader validates user directory version and compares it with the installed version If the version in user directory is higher than installed version user will get the popup:

<img src="https://docs.agenatrader.com/~gitbook/image?url=https%3A%2F%2F2805764894-files.gitbook.io%2F%7E%2Ffiles%2Fv0%2Fb%2Fgitbook-legacy-files%2Fo%2Fassets%252F-MKZSsJBtSP9L4sqIe_q%252F-MQClv58ENCsyaHRTnHR%252F-MQESeThs4P50HOLJJLS%252FE.png%3Falt%3Dmedia%26token%3D048beddd-f5ac-4964-a39a-02f1a859c4a7&#x26;width=768&#x26;dpr=4&#x26;quality=100&#x26;sign=f0400a5d&#x26;sv=1" alt="" data-size="original">

Click **OK** button to install latest AgenaTrader version. **Cancel** button will skip the process.
{% endhint %}


# Mappings and Instrument-Lists

Managing your instruments effectively is key to maintaining a smooth trading experience in AgenaTrader. The **Mappings and Instrument Lists** section is designed to help you keep your instrument database accurate and up-to-date, ensuring you have access to the latest market data.

## Introduction <a href="#introduction" id="introduction"></a>

### What Are Instrument Mappings?

Instrument mappings allow AgenaTrader to correctly interpret and match financial instruments across different brokers and data feed providers. Each provider may use a unique symbol format, and mappings ensure seamless integration by linking these symbols to the correct instruments within your platform. This process enables you to access historical data, place trades, and analyze markets without discrepancies or missing data.

### What You'll Learn in This Section

In this section, you’ll discover how to:

* Access and navigate the **Instrument Editor** to manage your instrument data.
* Import and export symbol mappings to align your trading instruments with various brokers and data feeds.
* Keep your **instrument lists** up-to-date by manually managing and generating lists based on market and asset class preferences.
* Utilize both **simple** and **advanced** import options to customize your trading environment based on your needs.

## Automated Mapping Updates

To ensure you always have the most accurate and up-to-date instrument data, AgenaTrader features an **automated mapping update** process. Whenever a mapping change is detected on our mapping server, the system will automatically initiate an import of the updated mappings.

When this happens, a **popup notification** will appear, informing you about the detected changes and prompting you to proceed with the update.

This automated process is designed to help you effortlessly keep your mapping database current, ensuring seamless trading operations. We **highly recommend** always performing the update when prompted and avoiding cancellation to prevent potential issues with outdated or incorrect instrument mappings.

By staying up-to-date with the latest mappings, you can trade with confidence, knowing that your data is accurate and fully synchronized with your broker and data feed providers.

## Manual Mapping Update

If you have skipped an automated mapping update or want to ensure that your instrument mappings are fully up-to-date, you can manually update them at any time. Performing a manual update allows you to verify that all required mappings are correctly imported into your database, ensuring accurate market data and order execution.

**To manually update your mappings, follow these steps:**

1. Open the **Instruments** window by selecting:
   * `Tools` → `Settings` → `Instrument Editor`
   * Or by clicking the **Instrument Editor** <img src="https://docs.agenatrader.com/~gitbook/image?url=https%3A%2F%2F2805764894-files.gitbook.io%2F%7E%2Ffiles%2Fv0%2Fb%2Fgitbook-x-prod.appspot.com%2Fo%2Fspaces%252F-MKZSsJBtSP9L4sqIe_q-887967055%252Fuploads%252FzF1QgVHIg606KOmO6bMC%252Fimage.png%3Falt%3Dmedia%26token%3Da335861a-d3eb-46e3-95be-c1406fcd5225&#x26;width=46&#x26;dpr=4&#x26;quality=100&#x26;sign=3a187de1&#x26;sv=2" alt="" data-size="line"> icon in the application toolbar.
2. In the Instruments window, click the **Import/Export** button.
3. Select **Markets+Mappings** to manually import the latest symbol mappings from your data feed providers.

<figure><img src="/files/fZ3cmXEo1YxYqR7GEZGL" alt=""><figcaption></figcaption></figure>

By regularly performing manual updates, you can prevent potential issues caused by outdated mappings and maintain optimal trading conditions.

### **Simple view** <a href="#simple_view" id="simple_view"></a>

The simple view of this window makes it possible to select a broker and datafeed and import all available financial market symbols and mappings.&#x20;

<figure><img src="/files/WPbSWFv4Ezns6eFBM9fM" alt="" width="305"><figcaption></figcaption></figure>

### **Advanced view** <a href="#advanced_view" id="advanced_view"></a>

Advanced Mode allows you to only import specific data. Filter between types: currency, future, stock and index, and subsequently according to the stock exchange: Nasdaq, Nyse, Xetra and many more. This means that you only ever have to save the data that you really need.

<figure><img src="/files/MzzznbW3LvsAWX6l8JEE" alt="" width="310"><figcaption></figcaption></figure>

**Category:** Available only for Taipan. Allows importing mappings from different sources.

**Add connections:** Allows to add/edit connection. Details on page [Account connections: Create or change a connection](broken://pages/-MPF0msd9y2o4KRfNV5Y)

**Generate Instrument Lists:** The function "Generate Instruments Lists" allows creating of lists automatically with the import of the data that is available. Instrument Lists can be filtered per type (asset class) and exchange market.

**Example:**\
If you import mappings and instrument data for the exchange Nyse and Globex, and "generate per instrument type" is selected than you will receive several lists for each asset class. The second function also separates lists based on exchange markets.

If you click the **Delete...** button, all selected mappings will be removed. You can also decide whether you wish to remove only the mapping for certain brokers or the corresponding instruments as well. Once you have deleted a market, the font text will be changed to "regular" (this also applies to instrument lists).

## **Instrument Lists** <a href="#templates_for_static_financial_market_symbols_in_lists" id="templates_for_static_financial_market_symbols_in_lists"></a>

This feature provides you with an extensive array of pre-prepared static lists, general or broker-specific. The lists are maintained and kept up-to-date via our server. The update also takes place automatically in your AgenaTrader. However, you do have the option to deactivate this automatism in the [Preferences](broken://pages/-MPd1sZL_g4LxWTwMSwB#environment)

<figure><img src="/files/8Rri1PjGldjKcCipJud4" alt=""><figcaption></figcaption></figure>

**Instrument Lists (Broker)** tab displays broker-specific instrument lists.

<figure><img src="/files/Lyob3i4RsTpPksb4WyN2" alt="" width="305"><figcaption></figcaption></figure>

**An instrument can only be available in the instrument lists after you have imported all necessary mappings.**\
Otherwise you will receive a popup with the list of symbols that cannot be imported:


# Instrument Editor

## The Instrument Editor window <a href="#the-instrument-editor-window" id="the-instrument-editor-window"></a>

The **Instrument Editor** is a tool that helps you to manage instruments and instrument lists. In order to receive data for particular instruments and to be able to trade with them, the necessary instruments must be imported into the Instrument Editor.

Use the Instrument Editor to:

* edit
* select instruments and instrument lists.

*In order to open the **Instruments window** use one of the options:*

1. Select **Instrument Editor** by using **Tools -> Settings** or
2. left click the symbol <img src="/files/XFd3lWtPld6w3Kzf3cj6" alt="" data-size="line"> in the application toolbar within the main window.

*This window consists of the following parts:*

* **Search for a symbol/name:**
  * enter the symbol (e.g. GOOG), the full name (Google Inc.) or the ISIN number (US38259P5089).
  * double-click on the search result to select the instrument and bring up the **Instrument details tab**.
  * enter type of symbol (e.g. future, stocks, index etc)
  * enter exchange (e.g. Nyse)
* **Selection list tree:**
  * Choose single instruments or whole instrument lists for further editing.
* **Details tab:**
  * Add new instruments or edit existing instruments within the details tab.
* **Instrument lists tab:**
  * Add or manage instrument lists within this tab.

<figure><img src="/files/eCFkyXOo3xLbuK2tMB8s" alt=""><figcaption></figcaption></figure>

**Note**: Fractals are only available for Futures. It is default setting in the right area of the window, yet disappears when you have chosen an instrument other than futures.

**Static lists, dynamic lists und screener presets**

<figure><img src="/files/UOb6vqGuMAaU7y2VowOa" alt=""><figcaption></figcaption></figure>

*The Instrument Editor selection list tree displays 3 additional lists:*

* Static Lists: lists created or edited by a user. Using the Global Configuration you can [connect chart groups with the static instrument lists](https://docs.agenatrader.com/tools/configuration-escort#chart) if necessary. This means that changing values within the list chart group or the tab chart group will automatically change your static lists and vice versa.
* Dynamic Lists: pre-defined lists that are updated automatically (if there is an internet connection).
* Screener Presets: lists that refresh automatically based on scanning activities (if there is an internet connection). These lists can be created using the Stock EOD Screener.

*The context menu of the selection list tree section can be accessed by right clicking and allows the following*

* Reset checkboxes: deletes all checkbox markers.
* Reload: reloads the Instrument Editor. This may be necessary after a new instrument has been added.

<figure><img src="/files/cJ8uBw26AOfPOnrptQdK" alt=""><figcaption></figcaption></figure>

### **From chart to Instrument Editor**

Left clicking on the instrument name within the chart opens the **Instrument Editor window**.

<figure><img src="/files/2IQefw0y0OsUv7LskDhJ" alt=""><figcaption></figcaption></figure>

### **Opening a new instrument inside the chart**

*To add a new instrument to a chart follow these steps:*

1. "Activate" the chart by left clicking on it.
2. Once you start typing letters using the keyboard, the instrument search window will be opened.
3. After selecting the instrument needed and pressing 'Enter' (or double-clicking) the new chart will be displayed.

<figure><img src="/files/LgkvrSbvoIVcpPiH417c" alt=""><figcaption></figcaption></figure>

### **Selecting instruments / instrument lists**

If you open the **Instrument Editor** to choose instruments/instrument lists (tick record, Forex pad, etc.) then only the section with the selection list will appear. Press the **Select** button or double-click to choose a single instrument or whole instrument list.

<figure><img src="/files/3A5IIe9SIit4qNrgkOb2" alt=""><figcaption></figcaption></figure>

## Import and export of instruments <a href="#instrument_escort__import_and_export_of_instruments" id="instrument_escort__import_and_export_of_instruments"></a>

The following actions can be carried out using the **Import/Export** button within the **Instruments** window:

<figure><img src="/files/BJ2j5OlpayFag3Q6Ykjr" alt=""><figcaption></figcaption></figure>

*Description of the functions:*

Select Markets + Mappings menu item: more information in the section [Instruments: Markets and Mappings](https://docs.agenatrader.com/tools/markets-and-mappings)

* Import from File: imports instruments from a CSV file
* Import from Dialog: inserts symbols that satisfy the same criteria.

<figure><img src="/files/j4t6sKyCsyO00x2lkSlm" alt=""><figcaption></figcaption></figure>

* Import Mappings: imports mappings from a CSV file.
* Import Instrument Lists: imports instrument lists from a CSV file.

The name of the \*.csv file will be suggested as the instrument list name. Importing will not overwrite existing lists but will simply add instruments from the \*.csv file that are not included in the instrument list. However, importing will overwrite existing instruments (details will be updated).

* Import from Instruments DB XML Snapshots: creates a backup file of instruments. More information in the section: [Instrument Editor: How to backup the instrument database](https://docs.agenatrader.com/tools/instrument-escort#how-to-backup-the-instrument-database).
* Export Instruments to XML Snapshot.

### Import formats - Instruments & Mappings <a href="#import_formats_-_instruments_real_amp_mappings" id="import_formats_-_instruments_real_amp_mappings"></a>

This section explains which formats are supported when importing instruments and mappings from a CSV file.

### Instruments imported from a CSV file <a href="#instruments-imported-from-a-csv-file" id="instruments-imported-from-a-csv-file"></a>

Each instrument traded or analyzed within AgenaTrader must exist in the Instrument Editor. Currently, the AgenaTrader database contains approx. 7000 instruments of all types (stocks, futures, etc.).

**The following attributes can be imported into AgenaTrader:** - \<Symbol> - The instrument's exchange symbol \
\- \<Name> - Instrument name \
\- \<Margin> - %-margin for a leveraged instrument (see below) \
\- \<PointValue> - Value per point \
\- \<TickSize> - Tick size \
\- \<MainSector> - Sector of economy (for stocks) \
\- \<DetailSector> - Industry (for stocks) \
\- \<InstrumentType> - Instrument type (see selection list in the Details tab) \
\- \<Exchange> - Exchange (see selection list in the Details tab) \
\- \<ETF> - Exchange Traded Fund: true / false \
\- \<Currency> - Currency (see selection list in the Details tab) \
\- \<Expiry> - The instrument's expiration date (futures) – Format example: 06.2014 (mm.yyyy) \
\- \<ISIN> - tbd - \<DefaultOrdersize> - tbd

{% hint style="info" %}
Important! will not be overwritten if the native tick has already been set to "Fixed" in the Instrument Manager.
{% endhint %}

If a margin is different for various brokers, you can edit it using the **Mapped symbol** column in the **Details tab**.

<figure><img src="/files/wjPh2VvuCxkKcoh6CeB4" alt=""><figcaption></figcaption></figure>

*The following formatting is required for a CSV file:*

1. The first cell must contain the tag **\<Import Instrumens>**
2. Below this tag there are **\<Attributes>** and **\<Instrument>** rows.
3. The **\<Attributes>** row causes a change of attributes for the following **\<Instrument>** rows.
4. The **\<Instrument>** row may also include attributes.

Sample data:

| \<Import instruments> |                      |                        |                        |                    |                    |                  |                |                  |
| --------------------- | -------------------- | ---------------------- | ---------------------- | ------------------ | ------------------ | ---------------- | -------------- | ---------------- |
|                       |                      |                        |                        |                    |                    |                  |                |                  |
| \<Attributes>         | \<Exchange>Nasdaq    | \<Instrumenttype>Stock | \<ETF>false            | \<PointValue>1     | \<TickSize>0,01    | \<Currency>USD   |                |                  |
| \<Instrument>         | \<Symbol>AA          | \<Name>AA Name         | \<Margin>25            | \<MainSector>AAS   | \<DetailSector>ADS | \<Expiry>03.2012 |                |                  |
| \<Instrument>         | \<Symbol>BB          | \<Name>BB Name         | \<Margin>20            | \<MainSector>BBS   | \<DetailSector>BDS | \<Expiry>04.2012 |                |                  |
| ...                   |                      |                        |                        |                    |                    |                  |                |                  |
| \<Attributes>         | \<Exchange>FromYahoo | \<Name>FromYahoo       | \<Instrumenttype>Stock | \<ETF>false        | \<PointValue>1     | \<TickSize>0,01  | \<Currency>USD | \<Expiry>06.2014 |
| \<Instrument>         | \<Symbol>CC          | \<Margin>25            | \<MainSector>CCS       | \<DetailSector>CDS |                    |                  |                |                  |
| \<Instrument>         | \<Symbol>DD          | \<Margin>15            | \<MainSector>DDS       | \<DetailSector>DDS |                    |                  |                |                  |
| ...                   |                      |                        |                        |                    |                    |                  |                |                  |

To download examples please click [here](https://agenatrader.com/support-informations/ExportMappings.zip).

**Using "FromYahoo"**: you may often face situations in which you have an instrument list and know its base currency, instrument type etc. but are missing information such as the traded exchange or a symbol name. You can solve this problem by simply retrieving the required information from the internet. When you enter \<Name>FromYahoo or \<Exchange>FromYahoo this information will be imported from the Yahoo database.

**CAUTION!** Should you need to import a large number of values, then this may take quite a long time. Importing 1000 instruments will take approximately 10 minutes.

### Instrument lists imported from a CSV file <a href="#instrument-lists-imported-from-a-csv-file" id="instrument-lists-imported-from-a-csv-file"></a>

There is a difference between importing instruments and instrument lists. Instrument lists are lists of symbols that have been assembled for a specific purpose e.g. long lists/short lists etc. When you import a list such as this, the corresponding symbols must already exist in AgenaTrader.

*The following formatting is required for a CSV file:*

1. The first cell must contain the tag **\<Import Instrument list>**
2. Below this tag all symbols needed must be listed.

Sample data:

| \<Import Instrumentlist> |
| ------------------------ |
| А                        |
| АА                       |
| AAPL                     |
| ABC                      |
| 2323                     |
| 3343                     |

If symbols are not identified correctly, a popup will display the following message:

<figure><img src="https://docs.agenatrader.com/~gitbook/image?url=https%3A%2F%2F2805764894-files.gitbook.io%2F%7E%2Ffiles%2Fv0%2Fb%2Fgitbook-legacy-files%2Fo%2Fassets%252F-MKZSsJBtSP9L4sqIe_q%252F-MQCAh-14xmgX2eJrdUw%252F-MQCBdl0hSOJcbrS3nPX%252FInstrument_escort_cannotimport.png%3Falt%3Dmedia%26token%3D7627b808-6e7a-48c2-8faf-b172f010fd91&#x26;width=768&#x26;dpr=4&#x26;quality=100&#x26;sign=7b91474c&#x26;sv=1" alt=""><figcaption></figcaption></figure>

To download other examples please click [here](https://agenatrader.com/support-informations/ExportMappings.zip).

Additional information is available on our [forum](https://tradersyard.com/forums) (in german only).

### Mappings from a CSV file <a href="#mappings-from-a-csv-file" id="mappings-from-a-csv-file"></a>

An example of the format for the import of mappings from a CSV file:

| \<InstrumentMapping> |   |   |   |
| -------------------- | - | - | - |

| \<Provider>BarChart |   |   |   |
| ------------------- | - | - | - |

| \<mappedSymbol>AUDCAD | \<Name>AUDCAD | \<Symbol>AUDCAD | \<Instrumenttype>Currency |
| --------------------- | ------------- | --------------- | ------------------------- |

| \<mappedSymbol>AUDCHF | \<Name>AUDCHF | \<Symbol>AUDCHF | \<Instrumenttype>Currency |
| --------------------- | ------------- | --------------- | ------------------------- |

| \<mappedSymbol>AUDJPY | \<Name>AUDJPY | \<Symbol>AUDJPY | \<Instrumenttype>Currency |
| --------------------- | ------------- | --------------- | ------------------------- |

To download examples please click [here](https://agenatrader.com/support-informations/ExportMappings.zip).

## Creating and managing instrument lists <a href="#instrument_escort__creating__and_managing_instrument_lists" id="instrument_escort__creating__and_managing_instrument_lists"></a>

#### Creating an instrument list <a href="#creating_an_instrument_list" id="creating_an_instrument_list"></a>

Inside the tab **Instrument lists** of the **Instrument Editor** you can create or edit existing instrument lists.

*In order to create a new instrument list follow these steps:*

1. Assign the name for a new list manually.
2. Add instruments using one of the following methods:

* **Manual entry in the "Symbol" cell**

<figure><img src="/files/Lv7tZ4CyzjbNcIRHPVTN" alt=""><figcaption></figcaption></figure>

{% hint style="info" %}
**Important note**. You can also create a blank list by leaving this cell empty. However, you can only use a blank list as an LCG (list chart group).
{% endhint %}

* **Drag and drop:**
  * from the instrument search section
  * from the list selection tree:
    * single values
    * instrument lists.

Clicking or double-clicking the checkbox will select an instrument / instrument list, after which you can drag it into a new instrument list.checkbox will select an instrument / instrument list, after which you can drag it into a new instrument list.

<figure><img src="/files/6L7H6k45qEvlriL4XvFb" alt=""><figcaption></figcaption></figure>

3\. Click the **Save** button to add the new list to the list selection tree. Once finished, the list will be available for editing within the static lists in AgenaTrader.

<figure><img src="/files/HEC7IuH5fKVMVpmd05LC" alt=""><figcaption></figcaption></figure>

If you wish to create a new list (for example, from the [scanner](https://docs.agenatrader.com/main/chart-area/realtime-scanner)), then the name of the instrument list will be pre-initialized with \<New List> or empty. The instrument list cannot be saved in either of these states. If you choose an existing name, this instrument list will be overwritten.

Additional functions are available under the **Instrument lists tab**:

<figure><img src="/files/2z0LdhLG9TIhluv0lGOG" alt=""><figcaption></figcaption></figure>

* Delete All: Clicking the arrow next to "Delete All" opens a drop-down menu where you can choose between Delete All Instruments or Instrument Lists. **Delete All Instruments** removes all instruments from the Instrument manager. **Delete All Instrument Lists** removes all instrument lists from the Instrument manager.
* Remove List: deletes only the list
* Export list: exports the symbol names into a CSV file
* Exp. Instruments: exports the symbol names and all corresponding data into a CSV file

<figure><img src="/files/LttVHUN27SggVf2fV6jO" alt=""><figcaption></figcaption></figure>

* Save: saves the instrument list
* Remove: removes one or more marked instruments from the list (this can also be achieved by clicking the **Delete** button)
* Synchronize: opens a new settings window that enables you to assign the same value to all entries in the list according to the specific instrument properties
* Clear: removes all instruments from the list

### Changes outside the Instrument Editor <a href="#changes_outside_the_instrument_escort" id="changes_outside_the_instrument_escort"></a>

You can edit Instrument lists outside the Instrument Editor using the following functionalities:

* Click the **Instrument list** buttons in the action bar to make the necessary changes. These buttons will be displayed once you add them from the [**Action bar**](https://docs.agenatrader.com/main/chart-area/actionbar) settings under the menu item **Instrument List**. Once an instrument's symbol is red, the instrument from the current chart will be added to the list. By clicking the button it can be added to as well as deleted from the corresponding list.

<figure><img src="https://docs.agenatrader.com/~gitbook/image?url=https%3A%2F%2F2805764894-files.gitbook.io%2F%7E%2Ffiles%2Fv0%2Fb%2Fgitbook-legacy-files%2Fo%2Fassets%252F-MKZSsJBtSP9L4sqIe_q%252F-MPA2Up_kL4jcNCs4R-c%252F-MPA4GUEeIb4kIZx8KvH%252Fact-bar4.png%3Falt%3Dmedia%26token%3D79dc87c5-3789-42d9-83d7-5b1cc329a478&#x26;width=768&#x26;dpr=4&#x26;quality=100&#x26;sign=c22cb3e4&#x26;sv=1" alt=""><figcaption></figcaption></figure>

* Add an instrument to an instrument list with the <img src="/files/ezMIy80OqRUAXIPVbm5f" alt="" data-size="line"> icon in the chart toolbar.

<figure><img src="/files/UnzGz9xMPpQcRM6a6NM0" alt=""><figcaption></figcaption></figure>

* The scanner has a multi-select function that allows you to add several instruments to a list in one go.

<figure><img src="/files/GBkD4IX3PnxcthkDPb5b" alt=""><figcaption></figcaption></figure>

### Favorite instrument list <a href="#favorite_instrument_list" id="favorite_instrument_list"></a>

You can define your favorite instrument list by selecting the corresponding icon in the chart toolbar and checking the **Fav.** checkbox in the popup. The favorite instrument list will be offered as the first option whenever a new LCG/TCG is created.

<figure><img src="/files/EoNiLsMQ5KzRC9Uu4hxw" alt=""><figcaption></figcaption></figure>

## Creating and editing of instruments <a href="#creating-and-editing-of-instruments" id="creating-and-editing-of-instruments"></a>

A large amount of instruments are already mapped in AgenaTrader. If a certain instrument does not exist in the **Instrument Editor** then you can add it manually.

To add a new instrument, select an instrument of the same type (stock, Future, etc.).

<figure><img src="/files/5Er13blSQWUWRb6Sn4m7" alt=""><figcaption></figcaption></figure>

Usually it is sufficient to:

1. enter the **symbol**, **name** of the instrument or its **ISIN number**.
2. select the **exchange**:
   1. the correct exchange input is highly important in order to access the appropriate trading hours (**Marketplace Escort** and tab [**Trading hours**](https://docs.agenatrader.com/tools/configuration-escort#Configuration_Escort__Market_Place_Escort)) and organize charts.
3. Adjust the **def. ordersize** in the [**Global Configuration**.](https://docs.agenatrader.com/tools/configuration-escort) Any value higher than 0 replaces the default setting for the order size.
4. Adjust the mappings for a new instrument using **mapped symbol** (see examples in the forum below) (available in german only).

<figure><img src="/files/Fk1WFbi6S9S393SJvJHI" alt=""><figcaption></figcaption></figure>

Additional fields are:

* **Instrument type**: allows you to define a new instrument as one of the following types:

<figure><img src="/files/8AJwZYdR54GFvycJwEoX" alt=""><figcaption></figcaption></figure>

* **Currency**: pertains to the currency in which the instrument is traded. It is necessary to perform currency conversions in AgenaTrader for the correct P\&L display.

<figure><img src="/files/cM4lavfwwJ0vcsJyFZNm" alt=""><figcaption></figcaption></figure>

* **Margin** (security %): must be entered for leveraged products, and represents the general margin for the instrument. This value may vary depending on the broker. If this is the case, the margin must be entered in broker-specific list (in the **Instrument Editor window** within the **Details tab**).
* **Tick size** and **point value** are necessary for various calculations such as: stop price, P\&L calculation etc.
* If the **main sector** or **detail sector** is entered, an instrument will be displayed inside the appropriate submenu of the selection tree in the **InstrumentEditor**.

Press the **Add/Save** button to register a new instrument in the system or edit the existing instrument.

### Specific information from a broker / data feed provider <a href="#inconsistent_information_from_a_broker_data_feed_provider" id="inconsistent_information_from_a_broker_data_feed_provider"></a>

Different brokers / data feed providers may use different symbol names and offer different margins for leveraged instruments.

You can enter their specific characteristics manually in the list within the details tab.

<figure><img src="/files/SKkcBxCALaVorrXL7Lrw" alt=""><figcaption></figcaption></figure>

| Name             | Meaning                                                                  |
| ---------------- | ------------------------------------------------------------------------ |
| Provider         | Broker's or datafeed provider name                                       |
| Symbol           | Mapping for each datafeed or broker symbol                               |
| Cont.            | Contract for broker future symbol                                        |
| Comm.            | Commision                                                                |
| Margin           | Broker's margin to purchase securities                                   |
| Min Qty          | Minimum order size                                                       |
| Max Qty          | Maximum order size                                                       |
| Min Qty Step     | Minimum order size step                                                  |
| Stop Distance    | Distance for trading stops orders to be met when trading                 |
| Point Value      | Mapped point value                                                       |
| Price Multiplier | Some broker platform uses multiplier to calculate the price of a symbol. |

In addition, you may set commission manually by adding this info in the InstrumentEditor in the Mapping Area using the **"C"** Button:

<figure><img src="/files/22e86qwe67IZrAKtlvAS" alt=""><figcaption></figcaption></figure>

The mapped symbols entered within the details tab will be used internally by AgenaTrader. If the same symbol is used by other brokers / data feed providers, this mapping will not take place. The name (symbol) AAPL (Apple Inc. stocks ) is used by the majority of brokers and does not need an additional label / identification in the list. Different labels / names exist primarily in the Futures and Forex markets.

### Examples <a href="#examples" id="examples"></a>

**IB**

*Adjusting the tick size for CFDs according to the current price*

Please note that Interactive Brokers uses different tick size parameters according to the particular price range. When trading some European CFDs, it may occur that users receive the following error messages: 1. "The price does not conform to the minimum price variation for the contract". 2. "Instrument Tick-Size is not zet calculated or delivered". In order to continue the trade it is necessary to adjust the tick size for the instrument manually.

Please enter a ticker name in the search field on [IB's website](https://www.interactivebrokers.com/en/?f=/en/general/contact/tipsContractsDatabaseSearch.php?ib_entity=llc) and check the price parameters for the selected instrument.

<figure><img src="https://docs.agenatrader.com/~gitbook/image?url=https%3A%2F%2F2805764894-files.gitbook.io%2F%7E%2Ffiles%2Fv0%2Fb%2Fgitbook-legacy-files%2Fo%2Fassets%252F-MKZSsJBtSP9L4sqIe_q%252F-MQCAh-14xmgX2eJrdUw%252F-MQCCvygO7ucVIK6a_DO%252FZurn%2520IB.png%3Falt%3Dmedia%26token%3D60d37701-c2ae-4ff5-a511-8277d70e184e&#x26;width=768&#x26;dpr=4&#x26;quality=100&#x26;sign=5c89c46f&#x26;sv=1" alt=""><figcaption></figcaption></figure>

Then enter the tick size in the **Instruments** window according the the current price, and check the checkbox **Fixed** as shown in the figure below:

<figure><img src="/files/69XGi9ADjedWfaEvCnu5" alt=""><figcaption></figcaption></figure>

## Futures contract rollover <a href="#instrument_escort__futures_contract_rollover" id="instrument_escort__futures_contract_rollover"></a>

### Expiration date of a futures contract <a href="#expiration_date_of_a_futures_contract" id="expiration_date_of_a_futures_contract"></a>

*In order to change the expiration date of a futures contract:*

1. Open the [**Instrument Editor**](https://docs.agenatrader.com/tools/instrument-escort) from the graph via clicking the instrument symbol or by using the main menu **Tools -> Instrument Editor**.
2. Find the desired instrument using the **Symbol** search cell ot the instrument selection tree.
3. Change the date in the **Contract** cell in the **Details tab**.

<figure><img src="/files/UxjWC51gO32fu0hj9T78" alt=""><figcaption></figcaption></figure>

In addition user have possibility to change contract date in Future Calendar. Just Right Mouse click on a Contract field opposite interested symbol:

<figure><img src="/files/y3GOUgPA0lzszBJIP9SP" alt=""><figcaption></figcaption></figure>

You can check the expiry date for each future contract beside the instument name in a chart toolbar.

<figure><img src="/files/PU2QrT5PJxyxXHnML3Ga" alt=""><figcaption></figcaption></figure>

Continious Contract is preset, if any of the three other options (see screenshot) was chosen, the number 1 to 3 will be added to the Mapped Symbol.

<figure><img src="/files/gZElEdyN8FtRIdjdR1gh" alt=""><figcaption></figcaption></figure>

AgenaTrader allows you to set a futures rollover alert. More information about futures contracts can be found in the section [Futures](https://docs.agenatrader.com/tools/configuration-escort#discretionary-trading).

**Definition for contracts:**

Continuous CC = continuous contract \
FrontMonth FM = actual contract according to calendar only \
Next = upcoming contract according to calendar \
NextOn = contract after next according to calendar

Setting options are quite similar or even the same for Taipan.

As described in [Taipan connection guide](https://www.youtube.com/watch?v=WJmwA8ULIQQ\&index=4\&list=PLpXCfYw2ra-9SLyMMS7UGqk085okmStiB), you can choose in account settings, if you want "CC" or "FM". Whatever is chosen there, will be regarded as default setting afterwards.

### Switching from one contract to another <a href="#switching_from_one_contract_to_another" id="switching_from_one_contract_to_another"></a>

**Changing the expiration date**

If you wish to extend the existing expiration date to the next expiration date for an FDAX instrument, you must **disconnect all data feed and broker connections**. After changing the expiration date and reconnecting you will see the data from the new futures contract.

**The same instrument with a different expiration date**

*If you wish to see both expiration dates for a future contract for the same instrument follow these steps:*

1. Find the desired futures contract in the **Instrument Editor**.
2. If, for example, you wish to see FDAX 09.JJJJ and FDAX 12.JJJJ simultaneously, change the name of one of these instruments (e.g. to "FDAX-NEXT") and set the new expiry date as 12.JJJJ, then click the **Save** button.

By doing so you create the FDAX with the Contract date 09.JJJJ and the FDAX-NEXT with the expiry date 12.JJJJ, both of which can now be found within the instruments.

**Volume Based Rollover**

For CME instruments, expiry with the most Volume settlements will be marked by **yellow** (in case you haven't set it yet for the selected instrument). With this data, the user may easily switch to the most popular expiry.

<figure><img src="/files/5NdZWjU07TYAbfHlSC8u" alt=""><figcaption></figcaption></figure>

To manage this user should first import mappings for **CME Manager.**

<figure><img src="/files/oMF05cJa43LwrSJDvzNx" alt=""><figcaption></figcaption></figure>

## How to backup the instrument database <a href="#how-to-backup-the-instrument-database" id="how-to-backup-the-instrument-database"></a>

You can create an instrument database backup using the [**Instrument Editor**](https://docs.agenatrader.com/tools/instrument-escort).

Clicking the **Import/Export** button followed by the **Export Instruments DB to XML Snapshot** submenu will prompt you to select a directory, where the backup file will be saved in XML format. To restore, click the **Import/Export** button and select **Import from Instruments DB XML Snapshot**. After choosing the XML file the instruments will be imported.

*Please note the following when importing the instruments:*

* Existing instruments will be updated.
* Instruments in the Instrument Editor will not be overwritten if they are not included in the XML file.
* Instruments from the XML file will be added if they are not included in the Instrument Editor.
* All mappings and instrument lists from the Instrument Editor will be deleted and replaced with entries from the XML file.

{% hint style="info" %}
**CAUTION**. Depending on the size of the instrument database the Import/Export process may take a while.
{% endhint %}

<figure><img src="/files/uobNPBYdi1LK8h5pXhdM" alt=""><figcaption></figcaption></figure>

## Create your instruments <a href="#create_your_instruments" id="create_your_instruments"></a>

AgenaTrader comes with a large number of instruments already recorded for you. If instruments are missing, they can be set up in the following way:

Select the right stock exchange: the correct stock exchange is very important, since the trading times of the marketplaces are determined based on the stock exchange (**Marketplace Escort / trading times**) and the charts are also oriented according to this.

After this, adjust the default order size (a value greater than 0 replaces the settings of the default order size in the **Global Configuration**) and adjust the mappings for the new instrument:

<figure><img src="/files/yGGCkoDzHzmUgBTx12s1" alt=""><figcaption></figcaption></figure>

You can find the right mapping for your instrument on the reference platform of your broker or data feed provider. Alternatively, of course, you can also contact them directly and request the mappings for the corresponding instruments. You also have the option to use the "feedback button" to request the relevant mapping. In addition, you should carry out a new import of the mappings from your broker and data feed provider at regular intervals.

You can find more information on creating and editing instruments [**here**](https://docs.agenatrader.com/tools/instrument-escort#Instrument_Escort__Creating__and_managing_instrument_lists).

### **Practical examples**

#### **IB** <a href="#ib" id="ib"></a>

**Example 1**

*Adjusting the tick size for CFDs according to the current price*

Please note that Interactive Brokers uses different tick size parameters according to the particular price range. When trading some European CFDs, it may occur that users receive the following error messages: 1. "The price does not conform to the minimum price variation for the contract". 2. "Instrument Tick-Size is not zet calculated or delivered". In order to continue the trade it is necessary to adjust the tick size for the instrument manually.

Please enter a ticker name in the search field on [IB's website](https://www.interactivebrokers.com/en/?f=/en/general/contact/tipsContractsDatabaseSearch.php?ib_entity=llc) and check the price parameters for the selected instrument.

<figure><img src="https://docs.agenatrader.com/~gitbook/image?url=https%3A%2F%2F2805764894-files.gitbook.io%2F%7E%2Ffiles%2Fv0%2Fb%2Fgitbook-legacy-files%2Fo%2Fassets%252F-MKZSsJBtSP9L4sqIe_q%252F-MQCAh-14xmgX2eJrdUw%252F-MQCEOXqhu9AhgzcFdrW%252FZurn%2520IB%2520%281%29.png%3Falt%3Dmedia%26token%3D96b41511-52a3-4365-865e-216562ad99ec&#x26;width=768&#x26;dpr=4&#x26;quality=100&#x26;sign=d6ea8534&#x26;sv=1" alt=""><figcaption></figcaption></figure>

Then enter the tick size in the **Instruments** window according the the current price, and check the checkbox **Pin Tick Size** as shown in the figure below:

<figure><img src="/files/67TWZaif6k1NIGn2Ji14" alt=""><figcaption></figcaption></figure>

**Example 2**

Check symbol mappings for symbol FMCE"''

*This example may be a little tricky because symbols name in AgenaTrader and IB mapping for this symbol totally differs.*

<figure><img src="https://docs.agenatrader.com/~gitbook/image?url=https%3A%2F%2F2805764894-files.gitbook.io%2F%7E%2Ffiles%2Fv0%2Fb%2Fgitbook-legacy-files%2Fo%2Fassets%252F-MKZSsJBtSP9L4sqIe_q%252F-MQCAh-14xmgX2eJrdUw%252F-MQCEYPzSvJLVvr_WkfK%252FIB%282%29.jpg%3Falt%3Dmedia%26token%3Daa582168-8b3c-4082-9346-7e08afdfa9ac&#x26;width=768&#x26;dpr=4&#x26;quality=100&#x26;sign=163fd2a4&#x26;sv=1" alt=""><figcaption></figcaption></figure>

1\. Visit [**IB's website**](https://misc.interactivebrokers.com/cstools/contract_info/v3.9/)

2\. Select **Advanced** Tab. Paste symbol **Name** (from Instrument Editor) to **Description/Name** input and click Search button

<figure><img src="https://docs.agenatrader.com/~gitbook/image?url=https%3A%2F%2F2805764894-files.gitbook.io%2F%7E%2Ffiles%2Fv0%2Fb%2Fgitbook-legacy-files%2Fo%2Fassets%252F-MKZSsJBtSP9L4sqIe_q%252F-MQCAh-14xmgX2eJrdUw%252F-MQCEc53umu17hR9SbA2%252FIB%283%29.jpg%3Falt%3Dmedia%26token%3D33624eed-a339-4494-8f07-69bc8a3b567c&#x26;width=768&#x26;dpr=4&#x26;quality=100&#x26;sign=7fcf7e0e&#x26;sv=1" alt=""><figcaption></figcaption></figure>

3.In open dialog click on button **Details**

<figure><img src="https://docs.agenatrader.com/~gitbook/image?url=https%3A%2F%2F2805764894-files.gitbook.io%2F%7E%2Ffiles%2Fv0%2Fb%2Fgitbook-legacy-files%2Fo%2Fassets%252F-MKZSsJBtSP9L4sqIe_q%252F-MQCAh-14xmgX2eJrdUw%252F-MQCEfZVYF_ni_MWFmxy%252FIB%284%29.jpg%3Falt%3Dmedia%26token%3Db08374f4-a023-4e95-a969-e8a7d8531b5f&#x26;width=768&#x26;dpr=4&#x26;quality=100&#x26;sign=8635729a&#x26;sv=1" alt=""><figcaption></figcaption></figure>

4\. After just copy Symbol and paste it to symbol field in Instrument Editor opposite IB datafeed.

<figure><img src="https://docs.agenatrader.com/~gitbook/image?url=https%3A%2F%2F2805764894-files.gitbook.io%2F%7E%2Ffiles%2Fv0%2Fb%2Fgitbook-legacy-files%2Fo%2Fassets%252F-MKZSsJBtSP9L4sqIe_q%252F-MQCAh-14xmgX2eJrdUw%252F-MQCEkTrUBtegX_dzUWj%252FIB%285%29.jpg%3Falt%3Dmedia%26token%3D70301288-6dff-4104-8ea0-4641d477be86&#x26;width=768&#x26;dpr=4&#x26;quality=100&#x26;sign=4893142d&#x26;sv=1" alt=""><figcaption></figcaption></figure>

## Error: "No security definition found" <a href="#no_security_definition_found" id="no_security_definition_found"></a>

**Definition of the problem**

**What has happened?**

1. If an order is placed or an order is flattened, I receive the notification "NO DEFINITION FOUND" and the order is neither sent to the broker nor flattened.
2. After connecting to my broker for the first time, a trade was opened without my doing.

**What does this mean?**

1. The instrument for the corresponding market (symbol) is missing. If an instrument is present, the mapped symbol (mapping) for the corresponding broker and data feed is missing.
2. Trades that have been made with the broker platform will be inputted into AgenaTrader when the connection is established.

### **Possible solutions**

**Creating/setting up the instruments yourself**

Open the Instrument Editor and carefully fill in all entry fields.

Trading times are taken from the respective stock exchange. Here in the example image, Providers and Mapped Symbol allow you to request data via TaiPan (a data feed account with the providers is required, and can lead to additional costs).

If further data feeds or brokers for which the user has an account are connected, then a further Mapped Symbol and Provider must be selected here (e.g. CapTrader, XTB, Dukascopy, FXCM and co.). You can ask the broker and data feed provider respectively which Mapped Symbol they use.

<figure><img src="/files/nUNycitS8MFjFE8yIrAS" alt=""><figcaption></figcaption></figure>

The changes need to be confirmed using the "Save" button. Reconnection to the data feed or broker is required for the changes to be applied.

**Request instruments / mappings**

With the "Submit corrected mapping"-button, you can request the mapping for an instrument right away: open the InstrumentEditor, enter the instrument in question and click "Submit corrected mapping". Then enter a short issue description in the window that pops up and click "Send":

<figure><img src="/files/PAEWMSzeBYK8z1HXI1Ge" alt=""><figcaption></figcaption></figure>

Usually the mappings team take care in a timely manner and you get response shortly after. Simply re-import mappings and Instrument Lists to continue working with the updated mappings.

**Instrument Lists and Mappings Import**

Go to Tools -> Settings -> Instruments: Markets and Mappings. In the Mappings tab, select your data feed or broker (provider). Clicking on the Import field below starts the import. Only after a successful import of the mappings can Instrument Lists (general or broker-specific) be imported without errors.

<figure><img src="/files/ahLG9S3bo3pBzIgPaJly" alt=""><figcaption></figcaption></figure>

If you accidentally delete Mappings and Instrument Lists, then you can repeat the import here and the data will be transferred.

**Further sources of information**

There is an detailed webinar on the topic of [instruments and lists](https://www.youtube.com/watch?v=Nf2XgjroreM\&index=23\&list=PLLftyBhQjHrX0Qpi--gcLZEh3YojWGZ53) on our YouTube channel.

{% embed url="<https://www.youtube.com/watch?index=24&list=PLLftyBhQjHrX0Qpi--gcLZEh3YojWGZ53&v=Nf2XgjroreM>" %}


# Tools Menu

## &#x20;<img src="/files/CsdZ6miHlWgpCveriRP4" alt="" data-size="line"> COTReport Escort <a href="#cotreport-escort" id="cotreport-escort"></a>

Each Tuesday, U.S. Commodity Futures Trading Commission provide reports of open interest for markets in which 20 or more traders hold positions equal to or above the reporting levels established by the CFTC. These reports are available in long and short format.

Through the COT Report Escort AgenaTrader load these data from U.S. Commodity Futures Trading Commission official [**website**](http://www.cftc.gov/MarketReports/CommitmentsofTraders/index.htm).

These data are used by premium indicators of add-ons:

* COT Standart Addon - *Find description* [***here***](https://docs.agenatrader.com/package-1/addons-packages-and-their-content#cot-standard)
* COT Institutional Addon - *Find description* [***here***](https://docs.agenatrader.com/package-1/addons-packages-and-their-content#cot-institutional)
* Umland Addon - *Find description* [***here***](https://docs.agenatrader.com/package-1/addons-packages-and-their-content#umland)

**Important!** Please find all addons description [**here**](https://docs.agenatrader.com/package-1/addons-packages-and-their-content). You may purchase the selected package on our shop [**here**](https://shop.tradersyard.com/addons)**.**

In addition, you can find more information regarding COTReport on [**Carsten Umland's homepage**](http://www.simplified-trading.de/) and on our [**homepage** ](https://agenatrader.com/commitments-of-traders-report-software/).

*In order to open the COT Report Escort please follow these steps:*

* Select **COTReport Escor**t by using **Tools -> Services -> COTReport Escort.**

<figure><img src="https://docs.agenatrader.com/~gitbook/image?url=https%3A%2F%2F2805764894-files.gitbook.io%2F%7E%2Ffiles%2Fv0%2Fb%2Fgitbook-legacy-files%2Fo%2Fassets%252F-MKZSsJBtSP9L4sqIe_q%252F-MQGhVKbpUZqxGhopWLQ%252F-MQHNgcR3Kk0HYuaAepo%252Fcot.jpg%3Falt%3Dmedia%26token%3D9c1735a8-2165-4357-83c2-1e6437aeac5a&#x26;width=768&#x26;dpr=4&#x26;quality=100&#x26;sign=4693b945&#x26;sv=1" alt=""><figcaption></figcaption></figure>

In open dialog, you may see COT report (left side) and AgenaTrader symbol which uses those data (right side).

If some specific symbol is absent, you may add it manually in the symbol field.

However, you should check in which COT report this symbol is present. Please check this on the official U.S. Commodity website [**here**](http://www.cftc.gov/MarketReports/CommitmentsofTraders/index.htm)

<figure><img src="https://docs.agenatrader.com/~gitbook/image?url=https%3A%2F%2F2805764894-files.gitbook.io%2F%7E%2Ffiles%2Fv0%2Fb%2Fgitbook-legacy-files%2Fo%2Fassets%252F-MKZSsJBtSP9L4sqIe_q%252F-MQGhVKbpUZqxGhopWLQ%252F-MQHNm7KiIthxoGiNjfI%252FCOTReport.jpg%3Falt%3Dmedia%26token%3Dabb85ba5-5822-42e6-b00a-eea9fe46dc51&#x26;width=768&#x26;dpr=4&#x26;quality=100&#x26;sign=e000a29e&#x26;sv=1" alt=""><figcaption></figcaption></figure>

After just display symbol on a chart and add an indicator which uses COT report.

### **Premium COT Indicators:**

<figure><img src="https://docs.agenatrader.com/~gitbook/image?url=https%3A%2F%2F2805764894-files.gitbook.io%2F%7E%2Ffiles%2Fv0%2Fb%2Fgitbook-legacy-files%2Fo%2Fassets%252F-MKZSsJBtSP9L4sqIe_q%252F-MQGhVKbpUZqxGhopWLQ%252F-MQHNqa1G5RRdOce93-N%252FCOT%2520indicators.jpg%3Falt%3Dmedia%26token%3D10148fb4-63db-4a63-b5a3-d3d935330e1e&#x26;width=768&#x26;dpr=4&#x26;quality=100&#x26;sign=535c350d&#x26;sv=1" alt=""><figcaption></figcaption></figure>

### **Scripted COT Indicators:**

<figure><img src="https://docs.agenatrader.com/~gitbook/image?url=https%3A%2F%2F2805764894-files.gitbook.io%2F%7E%2Ffiles%2Fv0%2Fb%2Fgitbook-legacy-files%2Fo%2Fassets%252F-MKZSsJBtSP9L4sqIe_q%252F-MQGhVKbpUZqxGhopWLQ%252F-MQHNuQBgt1kUsnRaCyZ%252FSripted%2520indicators.jpg%3Falt%3Dmedia%26token%3D0f04e8da-534f-43a1-bd84-3dd8ad45a0de&#x26;width=768&#x26;dpr=4&#x26;quality=100&#x26;sign=f7e6d692&#x26;sv=1" alt=""><figcaption></figcaption></figure>

## &#x20;Futures calendar <a href="#futures-calendar" id="futures-calendar"></a>

*In the **Futures calendar** window you will see the day of the month on which the rollover will take place:*

* If the rollover date lies within the time range between the predefined days and the contract expiration date, then the corresponding cell will be highlighted in red: ![Red](https://docs.agenatrader.com/~gitbook/image?url=https%3A%2F%2F2805764894-files.gitbook.io%2F%7E%2Ffiles%2Fv0%2Fb%2Fgitbook-legacy-files%2Fo%2Fassets%252F-MKZSsJBtSP9L4sqIe_q%252F-MQGhVKbpUZqxGhopWLQ%252F-MQHNy9xlNqKDoittR-e%252Fred.png%3Falt%3Dmedia%26token%3D0fdf551e-51c1-4e5f-894e-3239eee9b2f7\&width=300\&dpr=4\&quality=100\&sign=6d48bb51\&sv=1)
* If the expiration date lies in the past, then the corresponding cell will be highlighted in light red: ![Light Red](https://docs.agenatrader.com/~gitbook/image?url=https%3A%2F%2F2805764894-files.gitbook.io%2F%7E%2Ffiles%2Fv0%2Fb%2Fgitbook-legacy-files%2Fo%2Fassets%252F-MKZSsJBtSP9L4sqIe_q%252F-MQGhVKbpUZqxGhopWLQ%252F-MQHO0ASMpRaxnyZ_iKQ%252Flight%2520red.png%3Falt%3Dmedia%26token%3Ddc88bf4c-2b35-4cef-bbc8-9b2688435b69\&width=300\&dpr=4\&quality=100\&sign=3ea0411f\&sv=1)
* If the futures have already been rolled over to the next contract, then the corresponding cell will be highlighted in green: ![Green](https://docs.agenatrader.com/~gitbook/image?url=https%3A%2F%2F2805764894-files.gitbook.io%2F%7E%2Ffiles%2Fv0%2Fb%2Fgitbook-legacy-files%2Fo%2Fassets%252F-MKZSsJBtSP9L4sqIe_q%252F-MQGhVKbpUZqxGhopWLQ%252F-MQHO3dUOoevLabV7be4%252Fgreen.png%3Falt%3Dmedia%26token%3D24dd57b1-bdfa-48ca-afbb-f4f5fba34611\&width=300\&dpr=4\&quality=100\&sign=e079f174\&sv=1)
* For CME instruments, expiry with the most Volume settlements will be marked by yellow (in case you haven't set it yet for the selected instrument). With this data, the user may easily switch to the most popular expiry: ![Yellow](https://docs.agenatrader.com/~gitbook/image?url=https%3A%2F%2F2805764894-files.gitbook.io%2F%7E%2Ffiles%2Fv0%2Fb%2Fgitbook-legacy-files%2Fo%2Fassets%252F-MKZSsJBtSP9L4sqIe_q%252F-MQGhVKbpUZqxGhopWLQ%252F-MQHO6kFRA0F_M_776PT%252Fyellow.png%3Falt%3Dmedia%26token%3Dcdc7fefa-8c28-4bcd-a2fb-4967c077c697\&width=300\&dpr=4\&quality=100\&sign=2fcb2b60\&sv=1)

By clicking on the symbol you will call up the detail window for the instrument within the **Instrument Editor**. Here you may make the necessary changes. More information about the rollover can be found in the section: [Futures contract rollover](https://docs.agenatrader.com/tools/instrument-escort#Instrument_Escort__Futures_contract_rollover).

<figure><img src="https://docs.agenatrader.com/~gitbook/image?url=https%3A%2F%2F2805764894-files.gitbook.io%2F%7E%2Ffiles%2Fv0%2Fb%2Fgitbook-legacy-files%2Fo%2Fassets%252F-MKZSsJBtSP9L4sqIe_q%252F-MQGhVKbpUZqxGhopWLQ%252F-MQHOAvhiVsHIP9I_73K%252Ffuture.png%3Falt%3Dmedia%26token%3D8221742d-f099-49d4-a566-09cce576080d&#x26;width=768&#x26;dpr=4&#x26;quality=100&#x26;sign=647cb17&#x26;sv=1" alt=""><figcaption></figcaption></figure>

In case you are looking for a specific contract please enter the symbol name in the search field and click the **Search** button

<figure><img src="https://docs.agenatrader.com/~gitbook/image?url=https%3A%2F%2F2805764894-files.gitbook.io%2F%7E%2Ffiles%2Fv0%2Fb%2Fgitbook-legacy-files%2Fo%2Fassets%252F-MKZSsJBtSP9L4sqIe_q%252F-MQGhVKbpUZqxGhopWLQ%252F-MQHOFXJmyQV6P2XQil-%252Fsearch.png%3Falt%3Dmedia%26token%3D3ecd9fdd-5663-4ab9-b382-1e9ace69b862&#x26;width=768&#x26;dpr=4&#x26;quality=100&#x26;sign=cf232843&#x26;sv=1" alt=""><figcaption></figcaption></figure>

For the **Futures,** you may adjust some additional settings. Check the **Show Rollover Alert** checkbox if you wish to be shown the futures calendar window (see below) upon starting up AgenaTrader - it will appear if one of the major futures is n days before its rollover. The dialog window will open where the cursor is positioned.

<figure><img src="https://docs.agenatrader.com/~gitbook/image?url=https%3A%2F%2F2805764894-files.gitbook.io%2F%7E%2Ffiles%2Fv0%2Fb%2Fgitbook-legacy-files%2Fo%2Fassets%252F-MKZSsJBtSP9L4sqIe_q%252F-MQGhVKbpUZqxGhopWLQ%252F-MQHOqW_iOQP1tl3vm_K%252Frollover.png%3Falt%3Dmedia%26token%3Dc40cf78b-48bb-4dd5-ac96-a8be2c12269a&#x26;width=768&#x26;dpr=4&#x26;quality=100&#x26;sign=8f2d1a5c&#x26;sv=1" alt=""><figcaption></figcaption></figure>

## **Financial Calendar**

The new Financial Calendar shows a snap-shot of loaded data at each point of time.

By means of the financial calendar you can set a time alert in AgenaTrader for the most important dates and even show those information in the chart at the specific date and time of the event. Should you need to see all changes it is necessary to reload the financial calendar (there is no automatic transfer of data).

You have the option to choose Economic, Earnings, Holidays and Dividend Dates, more details below the image.

<figure><img src="https://docs.agenatrader.com/~gitbook/image?url=https%3A%2F%2F2805764894-files.gitbook.io%2F%7E%2Ffiles%2Fv0%2Fb%2Fgitbook-legacy-files%2Fo%2Fassets%252F-MKZSsJBtSP9L4sqIe_q%252F-MQGhVKbpUZqxGhopWLQ%252F-MQHOvMFlOnllTNlvuA2%252FFinancialCalendar.png%3Falt%3Dmedia%26token%3De8a24043-11c3-4c25-9ba3-09f1fcba3478&#x26;width=768&#x26;dpr=4&#x26;quality=100&#x26;sign=f2ce9bea&#x26;sv=1" alt=""><figcaption></figcaption></figure>

| Option         | Meaning                                                                                                                                  |
| -------------- | ---------------------------------------------------------------------------------------------------------------------------------------- |
| Economic       | Show most important economic events which drive the worldwide markets, each event is referred to the currencies it will affect the most. |
| Earnings       | List of companies which are giving out earning reports at this date.                                                                     |
| Holidays       | Worldwide Holidays and therefore closed exchanges are listed here.                                                                       |
| Dividend Dates | List of companies which are paying dividends at this date.                                                                               |
| Country        | Here you can choose for which countries you want to load the specific information.                                                       |
| Period         | Specify for which time period you want to look at the information.                                                                       |

### **Create Time Alert**

*The right click on a calendar will open the context menu with the following options:*

<figure><img src="https://docs.agenatrader.com/~gitbook/image?url=https%3A%2F%2F2805764894-files.gitbook.io%2F%7E%2Ffiles%2Fv0%2Fb%2Fgitbook-legacy-files%2Fo%2Fassets%252F-MKZSsJBtSP9L4sqIe_q%252F-MQGhVKbpUZqxGhopWLQ%252F-MQHP3CMd1v9YOUwGGNu%252FFinancialCalendar%2520%281%29.png%3Falt%3Dmedia%26token%3D19a14318-836c-4ea5-8859-b831ca34d2c3&#x26;width=768&#x26;dpr=4&#x26;quality=100&#x26;sign=5bb6ae94&#x26;sv=1" alt=""><figcaption></figcaption></figure>

1. Create Time Alert allows to create time alert visible on a chart
2. MS Excel Export: exports all information into a CSV file.

<figure><img src="https://docs.agenatrader.com/~gitbook/image?url=https%3A%2F%2F2805764894-files.gitbook.io%2F%7E%2Ffiles%2Fv0%2Fb%2Fgitbook-legacy-files%2Fo%2Fassets%252F-MKZSsJBtSP9L4sqIe_q%252F-MQGhVKbpUZqxGhopWLQ%252F-MQHP9UgHWeO8if2nbh6%252Ffinancial%2520alert.png%3Falt%3Dmedia%26token%3D52005680-ade1-45b8-989a-0e9858c9d5f4&#x26;width=768&#x26;dpr=4&#x26;quality=100&#x26;sign=23a67c0c&#x26;sv=1" alt=""><figcaption></figcaption></figure>

The Create Time Alert definition popup allows you to input the following values:

| Column          | Meaning                                                                                                                                    |
| --------------- | ------------------------------------------------------------------------------------------------------------------------------------------ |
| Date\&Time      | Date and time of the (next) reminder                                                                                                       |
| Reason          | The reason for alert (set manually)                                                                                                        |
| Iteration       | Repetition frequency for the time alert. If no repetition frequency is entered here, the alert will be triggered only once.                |
| Iteration Type  | tba                                                                                                                                        |
| Sound           | The sound to be played when the alert is triggered. If no sound is selected, the reason for the alert will be spoken by a synthetic voice. |
| E-Mail          | An Email address can be entered (e.g. <user@tradeescort.com>). If the price alert gets triggered a notification will be sent per email.    |
| Popup           | If the price alert gets triggered a notification will be send as popup.                                                                    |
| Mobile Notific. | Enable mobile notification                                                                                                                 |
| Cancel          | Deletes the alert                                                                                                                          |
| Parameter       | Custom user input                                                                                                                          |
| Show            | Display alert on Chart                                                                                                                     |
| Instruments     | Display alert only on exact Instrument Chart                                                                                               |
| Color           | Color of alert                                                                                                                             |

**Example**

<figure><img src="https://docs.agenatrader.com/~gitbook/image?url=https%3A%2F%2F2805764894-files.gitbook.io%2F%7E%2Ffiles%2Fv0%2Fb%2Fgitbook-legacy-files%2Fo%2Fassets%252F-MKZSsJBtSP9L4sqIe_q%252F-MQGhVKbpUZqxGhopWLQ%252F-MQHPFnk8Xz9sfuwA2zO%252Ftime%2520alert.png%3Falt%3Dmedia%26token%3Da32a193b-77c9-4256-91ee-5305f8d2cfe2&#x26;width=768&#x26;dpr=4&#x26;quality=100&#x26;sign=d43208bb&#x26;sv=1" alt=""><figcaption></figcaption></figure>

**Important!** Alert can only be placed for events that are in the future not in the past.

## Notes <a href="#notes" id="notes"></a>

The **Notes tab** saves your notes for each trading day and sorts them automatically by date of creation.

![](https://docs.agenatrader.com/~gitbook/image?url=https%3A%2F%2F2805764894-files.gitbook.io%2F%7E%2Ffiles%2Fv0%2Fb%2Fgitbook-legacy-files%2Fo%2Fassets%252F-MKZSsJBtSP9L4sqIe_q%252F-MQGhVKbpUZqxGhopWLQ%252F-MQHPMxYVZyKvBx79JqN%252FnotesCurrentDay.png%3Falt%3Dmedia%26token%3Df92764ce-9331-4646-900b-963ee3900f2f\&width=768\&dpr=4\&quality=100\&sign=2e8ef746\&sv=1)![](https://docs.agenatrader.com/~gitbook/image?url=https%3A%2F%2F2805764894-files.gitbook.io%2F%7E%2Ffiles%2Fv0%2Fb%2Fgitbook-legacy-files%2Fo%2Fassets%252F-MKZSsJBtSP9L4sqIe_q%252F-MQGhVKbpUZqxGhopWLQ%252F-MQHPQSnmu1Ae_4i8F7j%252FinfoCenterNotesInstrument.png%3Falt%3Dmedia%26token%3D0ba2b5a8-9596-4dea-a821-3692685661b0\&width=768\&dpr=4\&quality=100\&sign=8f0a855d\&sv=1)

*The right click on a day field will open a the context menu for a complete trading day with the following options:*

* Expand/Collapse: opens or closes the notes for the particular day (also achieved by left clicking on the corresponding row).
* Delete notes for ...(date): removes notes for the entire day.
* MS Excel Export: exports all notes into a CSV file.
* Save to File: saves all notes as a TXT file.

*The right click on a note will open the context menu with the following options:*

<figure><img src="https://docs.agenatrader.com/~gitbook/image?url=https%3A%2F%2F2805764894-files.gitbook.io%2F%7E%2Ffiles%2Fv0%2Fb%2Fgitbook-legacy-files%2Fo%2Fassets%252F-MKZSsJBtSP9L4sqIe_q%252F-MQGhVKbpUZqxGhopWLQ%252F-MQHPU1lbfGiR6c3fKqw%252FinfoCenterNotesContextNote.png%3Falt%3Dmedia%26token%3D82b6871d-1bcc-4459-9d96-0dea6a6a988f&#x26;width=768&#x26;dpr=4&#x26;quality=100&#x26;sign=bd926c04&#x26;sv=1" alt=""><figcaption></figcaption></figure>

* Edit: allows you to edit the note (also achieved by double-clicking on the note).
* Delete note: removes the note
* MS Excel Export: exports all notes into a CSV file.
* Save to File: saves all notes as a TXT file.

## <img src="/files/L0LzA9oymXN0366xD8HO" alt="" data-size="line"> TV-Streams <a href="#tv-streams" id="tv-streams"></a>

The TV-Streams tab provides access to TV stream websites without needing to open a browser.

<figure><img src="https://docs.agenatrader.com/~gitbook/image?url=https%3A%2F%2F2805764894-files.gitbook.io%2F%7E%2Ffiles%2Fv0%2Fb%2Fgitbook-legacy-files%2Fo%2Fassets%252F-MKZSsJBtSP9L4sqIe_q%252F-MQGhVKbpUZqxGhopWLQ%252F-MQHPZMS5IHhbYzgziDI%252FTV%2520streams.png%3Falt%3Dmedia%26token%3De49a7c62-a8d3-4103-a876-da5c9afa374c&#x26;width=768&#x26;dpr=4&#x26;quality=100&#x26;sign=e9456cec&#x26;sv=1" alt=""><figcaption></figcaption></figure>

To change stream please left mouse click on stream name and in open list select stream you want to watch

<figure><img src="https://docs.agenatrader.com/~gitbook/image?url=https%3A%2F%2F2805764894-files.gitbook.io%2F%7E%2Ffiles%2Fv0%2Fb%2Fgitbook-legacy-files%2Fo%2Fassets%252F-MKZSsJBtSP9L4sqIe_q%252F-MQGhVKbpUZqxGhopWLQ%252F-MQHPda0leh3S6rcU3-C%252FTV%2520streams%25202.png%3Falt%3Dmedia%26token%3Dcd3c27b4-b569-473d-92ff-2b6e0b2bc9fa&#x26;width=768&#x26;dpr=4&#x26;quality=100&#x26;sign=5d806889&#x26;sv=1" alt=""><figcaption></figcaption></figure>

*The buttons in the TV-Streams tab have the following functions:*

![Back](https://docs.agenatrader.com/~gitbook/image?url=https%3A%2F%2F2805764894-files.gitbook.io%2F%7E%2Ffiles%2Fv0%2Fb%2Fgitbook-legacy-files%2Fo%2Fassets%252F-MKZSsJBtSP9L4sqIe_q%252F-MPEd4e9CrdAzGP2Y0tM%252F-MPEf8sHG8XO-6bXXRtG%252FBack.png%3Falt%3Dmedia%26token%3D44c785d6-df9e-4664-be87-34c5661a9f22\&width=300\&dpr=4\&quality=100\&sign=1a8b56de\&sv=1) or ![Next](https://docs.agenatrader.com/~gitbook/image?url=https%3A%2F%2F2805764894-files.gitbook.io%2F%7E%2Ffiles%2Fv0%2Fb%2Fgitbook-legacy-files%2Fo%2Fassets%252F-MKZSsJBtSP9L4sqIe_q%252F-MPEd4e9CrdAzGP2Y0tM%252F-MPEfCquPlFBBVOgEEDO%252Fnext.png%3Falt%3Dmedia%26token%3D6999253e-fd04-48c8-997d-6c1da5eda1c7\&width=300\&dpr=4\&quality=100\&sign=e209bb5b\&sv=1) allows you to navigate back and forth between loaded Streaming websites.

![Reload](https://docs.agenatrader.com/~gitbook/image?url=https%3A%2F%2F2805764894-files.gitbook.io%2F%7E%2Ffiles%2Fv0%2Fb%2Fgitbook-legacy-files%2Fo%2Fassets%252F-MKZSsJBtSP9L4sqIe_q%252F-MPEd4e9CrdAzGP2Y0tM%252F-MPEfHgPZiipZdqpW4-6%252FReload.png%3Falt%3Dmedia%26token%3D84844153-d27f-4fbf-8439-b042921c0321\&width=300\&dpr=4\&quality=100\&sign=e8d0853b\&sv=1) reload a website.

![Mute](https://docs.agenatrader.com/~gitbook/image?url=https%3A%2F%2F2805764894-files.gitbook.io%2F%7E%2Ffiles%2Fv0%2Fb%2Fgitbook-legacy-files%2Fo%2Fassets%252F-MKZSsJBtSP9L4sqIe_q%252F-MPEd4e9CrdAzGP2Y0tM%252F-MPEfKunTK0XpaOOS99_%252FMute.png%3Falt%3Dmedia%26token%3D81abbf56-0ae7-4dde-8938-a278868aea26\&width=300\&dpr=4\&quality=100\&sign=b25bbce2\&sv=1) Mute/Unmute stream

![Settings](https://docs.agenatrader.com/~gitbook/image?url=https%3A%2F%2F2805764894-files.gitbook.io%2F%7E%2Ffiles%2Fv0%2Fb%2Fgitbook-legacy-files%2Fo%2Fassets%252F-MKZSsJBtSP9L4sqIe_q%252F-MPEd4e9CrdAzGP2Y0tM%252F-MPEfThgz78stcds5WZv%252FSettings.png%3Falt%3Dmedia%26token%3D7c61f665-78c7-4e2d-b090-1d47f836e271\&width=300\&dpr=4\&quality=100\&sign=7750663c\&sv=1) Open stream Settings. Via these settings, you may add or delete stream channels.

*Please find details about TV-Stream settings on wiki page* [*Global Configuration: TV-Streams*](https://docs.agenatrader.com/tools/configuration-escort#tv-streams)

## WEB tab <a href="#web-tab" id="web-tab"></a>

The **WEB tab** provides access to Internet websites without needing to open a browser.

<figure><img src="https://docs.agenatrader.com/~gitbook/image?url=https%3A%2F%2F2805764894-files.gitbook.io%2F%7E%2Ffiles%2Fv0%2Fb%2Fgitbook-legacy-files%2Fo%2Fassets%252F-MKZSsJBtSP9L4sqIe_q%252F-MQGhVKbpUZqxGhopWLQ%252F-MQHQ1o9iys_RGNDn81M%252FWebTab1.png%3Falt%3Dmedia%26token%3D23e92d46-a78b-47b3-b3c4-c3e54bd6332e&#x26;width=768&#x26;dpr=4&#x26;quality=100&#x26;sign=3e5019b9&#x26;sv=1" alt=""><figcaption></figcaption></figure>

*The buttons in the WEB tab have the following functions:*

![Web1](https://docs.agenatrader.com/~gitbook/image?url=https%3A%2F%2F2805764894-files.gitbook.io%2F%7E%2Ffiles%2Fv0%2Fb%2Fgitbook-legacy-files%2Fo%2Fassets%252F-MKZSsJBtSP9L4sqIe_q%252F-MPEfeztlpcHzJaMeRin%252F-MPEh0pwxFw0LdXP5HXa%252Fweb1.png%3Falt%3Dmedia%26token%3Da935de85-a7ca-4596-ae89-bd76e5661296\&width=300\&dpr=4\&quality=100\&sign=546b51c7\&sv=1) or ![Web2](https://docs.agenatrader.com/~gitbook/image?url=https%3A%2F%2F2805764894-files.gitbook.io%2F%7E%2Ffiles%2Fv0%2Fb%2Fgitbook-legacy-files%2Fo%2Fassets%252F-MKZSsJBtSP9L4sqIe_q%252F-MPEfeztlpcHzJaMeRin%252F-MPEh3nYu4wFP735FeL8%252Fweb2.png%3Falt%3Dmedia%26token%3Dec17c42a-3805-4b49-bbf8-71a0c51b1f7f\&width=300\&dpr=4\&quality=100\&sign=12888ad7\&sv=1) allows you to navigate back and forth between loaded websites.

![Web3](https://docs.agenatrader.com/~gitbook/image?url=https%3A%2F%2F2805764894-files.gitbook.io%2F%7E%2Ffiles%2Fv0%2Fb%2Fgitbook-legacy-files%2Fo%2Fassets%252F-MKZSsJBtSP9L4sqIe_q%252F-MPEfeztlpcHzJaMeRin%252F-MPEh74gDEleuf4wIkuw%252Fweb3.png%3Falt%3Dmedia%26token%3Dbbc47199-b76c-48ae-bd48-06909593e7a8\&width=300\&dpr=4\&quality=100\&sign=5b0f8486\&sv=1) reloads a website.

![Web4](https://docs.agenatrader.com/~gitbook/image?url=https%3A%2F%2F2805764894-files.gitbook.io%2F%7E%2Ffiles%2Fv0%2Fb%2Fgitbook-legacy-files%2Fo%2Fassets%252F-MKZSsJBtSP9L4sqIe_q%252F-MPEfeztlpcHzJaMeRin%252F-MPEhAAGDO7K4h7VJaCz%252Fweb4.png%3Falt%3Dmedia%26token%3D12ed7e4e-ce80-4699-8445-070bc6930bf4\&width=300\&dpr=4\&quality=100\&sign=252be8cf\&sv=1) adds a current website to your favorites or sets it as the homepage.

<figure><img src="https://docs.agenatrader.com/~gitbook/image?url=https%3A%2F%2F2805764894-files.gitbook.io%2F%7E%2Ffiles%2Fv0%2Fb%2Fgitbook-legacy-files%2Fo%2Fassets%252F-MKZSsJBtSP9L4sqIe_q%252F-MQGhVKbpUZqxGhopWLQ%252F-MQHQIASVkUboeo3iVGa%252FwebTab.png%3Falt%3Dmedia%26token%3D59e4862a-1206-40cd-b105-a20f04fa9825&#x26;width=768&#x26;dpr=4&#x26;quality=100&#x26;sign=6911f41e&#x26;sv=1" alt=""><figcaption></figcaption></figure>

## <img src="/files/FYUnqbasKS2JzgcY0AqA" alt="" data-size="line"> Record and Replay Escort <a href="#record-and-replay-escort" id="record-and-replay-escort"></a>

The **Record/Replay Escort** is able to record market data from a currently ongoing operation and replay later when necessary. If a broker or data feed offers the possibility of downloading the tick data (usually only for one trading day), then this can also be accomplished by the record manager.

Currently the following brokers enable market data download for 1-2 days: IQFeed, BarChart and DukasCopy.

If you wish to download the data, a connection to the preferred data feed provider must be established. You can download market data for one instrument or for an entire instrument list.

<figure><img src="https://docs.agenatrader.com/~gitbook/image?url=https%3A%2F%2F2805764894-files.gitbook.io%2F%7E%2Ffiles%2Fv0%2Fb%2Fgitbook-legacy-files%2Fo%2Fassets%252F-MKZSsJBtSP9L4sqIe_q%252F-MQGhVKbpUZqxGhopWLQ%252F-MQHQOM2-QYjNy2t2mw5%252FReplay.png%3Falt%3Dmedia%26token%3Dd1cdd185-2f3f-4682-a4bf-4a0249546c32&#x26;width=768&#x26;dpr=4&#x26;quality=100&#x26;sign=553ec9d8&#x26;sv=1" alt=""><figcaption></figcaption></figure>

Columns of the **Record/Replay Escort tab** show the following information:

| Column      | Meaning                                                                                                                                                                                                                                                                                                                                                                                                                                                                                                                                                                                                                                                                                                                                                                                                                                                                                                                                                                                                                                                                                                                                                                                                                                                                                                                                                                                                        |
| ----------- | -------------------------------------------------------------------------------------------------------------------------------------------------------------------------------------------------------------------------------------------------------------------------------------------------------------------------------------------------------------------------------------------------------------------------------------------------------------------------------------------------------------------------------------------------------------------------------------------------------------------------------------------------------------------------------------------------------------------------------------------------------------------------------------------------------------------------------------------------------------------------------------------------------------------------------------------------------------------------------------------------------------------------------------------------------------------------------------------------------------------------------------------------------------------------------------------------------------------------------------------------------------------------------------------------------------------------------------------------------------------------------------------------------------- |
| Name        | Name of the instrument or instrument list for which the tick data will be recorded or downloaded                                                                                                                                                                                                                                                                                                                                                                                                                                                                                                                                                                                                                                                                                                                                                                                                                                                                                                                                                                                                                                                                                                                                                                                                                                                                                                               |
| State       | The status of recording/replay: [![Dot](https://docs.agenatrader.com/~gitbook/image?url=https%3A%2F%2Fagenatrader.com%2Fwiki%2Ftiki-download_file.php%3FfileId%3D22%26display\&width=300\&dpr=4\&quality=100\&sign=5ef5815b\&sv=1) ](https://agenatrader.com/wiki/tiki-download_file.php?fileId=22\&display)**Recording**: data from the data feed provider is currently being downloaded or recorded. [![Dot](https://docs.agenatrader.com/~gitbook/image?url=https%3A%2F%2Fagenatrader.com%2Fwiki%2Ftiki-download_file.php%3FfileId%3D22%26display\&width=300\&dpr=4\&quality=100\&sign=5ef5815b\&sv=1) ](https://agenatrader.com/wiki/tiki-download_file.php?fileId=22\&display)**Finished**: downloading or recording is completed. This status allows you to start replay. [![Dot](https://docs.agenatrader.com/~gitbook/image?url=https%3A%2F%2Fagenatrader.com%2Fwiki%2Ftiki-download_file.php%3FfileId%3D22%26display\&width=300\&dpr=4\&quality=100\&sign=5ef5815b\&sv=1) ](https://agenatrader.com/wiki/tiki-download_file.php?fileId=22\&display)**Replaying**: replay has started. [![Dot](https://docs.agenatrader.com/~gitbook/image?url=https%3A%2F%2Fagenatrader.com%2Fwiki%2Ftiki-download_file.php%3FfileId%3D22%26display\&width=300\&dpr=4\&quality=100\&sign=5ef5815b\&sv=1) ](https://agenatrader.com/wiki/tiki-download_file.php?fileId=22\&display)**Paused**: replay has been paused. |
| Time from   | Date and time when recording was started or the first tick data was downloaded.                                                                                                                                                                                                                                                                                                                                                                                                                                                                                                                                                                                                                                                                                                                                                                                                                                                                                                                                                                                                                                                                                                                                                                                                                                                                                                                                |
| Time to     | Date and time when recording was finished or the last tick data was downloaded.                                                                                                                                                                                                                                                                                                                                                                                                                                                                                                                                                                                                                                                                                                                                                                                                                                                                                                                                                                                                                                                                                                                                                                                                                                                                                                                                |
| Start at    | Time at which replay should be started during the period between the 'From' and 'To'. This time frame can only be changed when the status is displayed as 'Finished' or when the replay has been stopped (not paused).                                                                                                                                                                                                                                                                                                                                                                                                                                                                                                                                                                                                                                                                                                                                                                                                                                                                                                                                                                                                                                                                                                                                                                                         |
| Speed       | The multiplicative factor at which the recording is to be played. For example, 20x symbolizes that the recording will be played at 20x the regular speed.                                                                                                                                                                                                                                                                                                                                                                                                                                                                                                                                                                                                                                                                                                                                                                                                                                                                                                                                                                                                                                                                                                                                                                                                                                                      |
| Start/Pause | ![старт](https://docs.agenatrader.com/~gitbook/image?url=https%3A%2F%2F2805764894-files.gitbook.io%2F%7E%2Ffiles%2Fv0%2Fb%2Fgitbook-legacy-files%2Fo%2Fassets%252F-MKZSsJBtSP9L4sqIe_q%252F-MPEfeztlpcHzJaMeRin%252F-MPEhxaI98HM3NO9N-Q7%252Fplay.png%3Falt%3Dmedia%26token%3D3f48b683-ce19-47a2-ba7c-0d64e0e6c5fb\&width=300\&dpr=4\&quality=100\&sign=805b747d\&sv=1) Starts the replay for a selected entry in the list ![пауза](https://docs.agenatrader.com/~gitbook/image?url=https%3A%2F%2F2805764894-files.gitbook.io%2F%7E%2Ffiles%2Fv0%2Fb%2Fgitbook-legacy-files%2Fo%2Fassets%252F-MKZSsJBtSP9L4sqIe_q%252F-MPEfeztlpcHzJaMeRin%252F-MPEi-4pQA40F7mCGMY0%252Fpause.png%3Falt%3Dmedia%26token%3D1809ac74-86c4-462d-baf4-c8d68483750c\&width=300\&dpr=4\&quality=100\&sign=90d313e2\&sv=1) Pauses the replay                                                                                                                                                                                                                                                                                                                                                                                                                                                                                                                                                                                          |
| Stop        | ![стоп](https://docs.agenatrader.com/~gitbook/image?url=https%3A%2F%2F2805764894-files.gitbook.io%2F%7E%2Ffiles%2Fv0%2Fb%2Fgitbook-legacy-files%2Fo%2Fassets%252F-MKZSsJBtSP9L4sqIe_q%252F-MPEfeztlpcHzJaMeRin%252F-MPEi1R4vnL-zsqw8x85%252Fstop.png%3Falt%3Dmedia%26token%3D0a7d6f44-b98e-4014-83b9-bbe3abf60241\&width=300\&dpr=4\&quality=100\&sign=f9390bae\&sv=1) Stops the replay and returns it to the original point (status 'Finished')                                                                                                                                                                                                                                                                                                                                                                                                                                                                                                                                                                                                                                                                                                                                                                                                                                                                                                                                                               |
| Comment     | The cell in which you can enter a comment.                                                                                                                                                                                                                                                                                                                                                                                                                                                                                                                                                                                                                                                                                                                                                                                                                                                                                                                                                                                                                                                                                                                                                                                                                                                                                                                                                                     |

*The context menu of the Record manager:*

* Start Recording: opens the [Instrument Editor](https://docs.agenatrader.com/tools/instrument-escort) selection list. After selecting the instrument or instrument list, recording will begin. This requires the data feed to be active.
* Stop Recording: becomes available when the status is displayed as 'Recording' and stops the current recording.
* Download ReplayData: opens the Instrument Editor selection list. After choosing the instrument / instrument list and entering the time frame, the download will start.
* Import from the Url: allows user to enter an URL to download data.
* Remove Recording: deletes the selected entry
* Play: starts the replay
* Stop Replay: stops the replay and returns it to the original point (Status 'Finished').

### **Import from the URL example**

To import data from URL user should have two files with bars and ticks. File extensions should be .sdf.

The link should be ended by file name. For example, we have **20170201\_FDAX\_1738764711.sdf** file so the link should look like <https://agenatrader.com/download/prebeta/**20170201\\_FDAX\\_1738764711.sdf>\*\*

*In order to import data from URL please follow these steps:*

* Upload files with bars and ticks to file sharing service (For example **20170201\_FDAX\_1738764711.sdf** and **20170201\_FDAX\_1738764711\_Ticks.sdf** files)
* In Replay Escort context menu please select **Import from the Url**
* In open dialog paste direct download link to one of each files (AgenaTrader will download second one automatically)
* Click **OK** button

<figure><img src="https://docs.agenatrader.com/~gitbook/image?url=https%3A%2F%2F2805764894-files.gitbook.io%2F%7E%2Ffiles%2Fv0%2Fb%2Fgitbook-legacy-files%2Fo%2Fassets%252F-MKZSsJBtSP9L4sqIe_q%252F-MQGhVKbpUZqxGhopWLQ%252F-MQHR9EZxccbNldNcw1v%252Fdownload.jpg%3Falt%3Dmedia%26token%3D1e950893-fe6a-4712-880d-b56956d24b4f&#x26;width=768&#x26;dpr=4&#x26;quality=100&#x26;sign=27a3340c&#x26;sv=1" alt=""><figcaption></figcaption></figure>

You can change the settings of the **replay history** in the **Tools -> Global Configuration** in tabs: [**General -> Chart**](https://docs.agenatrader.com/tools/configuration-escort#chart). The replay history defines the time period inside the time frame for which tick data was downloaded, thus it can be replayed tick by tick.

<figure><img src="https://docs.agenatrader.com/~gitbook/image?url=https%3A%2F%2F2805764894-files.gitbook.io%2F%7E%2Ffiles%2Fv0%2Fb%2Fgitbook-legacy-files%2Fo%2Fassets%252F-MKZSsJBtSP9L4sqIe_q%252F-MQGhVKbpUZqxGhopWLQ%252F-MQHRD0VNlk-QshJAxn9%252Frecord_replay_from_to.png%3Falt%3Dmedia%26token%3D4654f1f6-16cf-4c8f-8f28-32e5c971bd82&#x26;width=768&#x26;dpr=4&#x26;quality=100&#x26;sign=83894a82&#x26;sv=1" alt=""><figcaption></figcaption></figure>

## <img src="/files/SRulOVHPibHw0lT3KVaR" alt="" data-size="line"> Alerts <a href="#alerts" id="alerts"></a>

his section describes all user-defined alerts in AgenaTrader.

<figure><img src="https://docs.agenatrader.com/~gitbook/image?url=https%3A%2F%2F2805764894-files.gitbook.io%2F%7E%2Ffiles%2Fv0%2Fb%2Fgitbook-legacy-files%2Fo%2Fassets%252F-MKZSsJBtSP9L4sqIe_q%252F-MQGhVKbpUZqxGhopWLQ%252F-MQHRPSXdLUKbL8Io8q6%252FALERTS.png%3Falt%3Dmedia%26token%3Ddc709292-8616-4aca-a474-74b85ad31d97&#x26;width=768&#x26;dpr=4&#x26;quality=100&#x26;sign=9edd1bfa&#x26;sv=1" alt=""><figcaption></figcaption></figure>

### <img src="/files/Z7QhfKCD6MYWbe8eXaQA" alt="" data-size="line"> Price Alerts <a href="#price_alerts" id="price_alerts"></a>

The price alert is triggered when a current price has broken through the specified user price level. You can use this to operate in different events on the trading chart. A price alert may also be linked to an order. If the price alert is activated, this either deletes or activates the order.

Should you create a price alert AgenaTrader will note the price of instruments for the creation. Additionaly you can choose, whether the price alert will be activated in RTH (RealTimeTradingHours) only or outside these hours.

Additional information is the section: [Add a price alert](https://docs.agenatrader.com/main/chart-area/untitled/chart-context-menu#add-price-alert).

<figure><img src="https://docs.agenatrader.com/~gitbook/image?url=https%3A%2F%2F2805764894-files.gitbook.io%2F%7E%2Ffiles%2Fv0%2Fb%2Fgitbook-legacy-files%2Fo%2Fassets%252F-MKZSsJBtSP9L4sqIe_q%252F-MQGhVKbpUZqxGhopWLQ%252F-MQHRSuiT0otoUCqa3gA%252Fprice_alert_edit_new.png%3Falt%3Dmedia%26token%3D8b0d6bd5-f65b-4d18-80b9-5c2b643b091c&#x26;width=768&#x26;dpr=4&#x26;quality=100&#x26;sign=fb0d86d4&#x26;sv=1" alt=""><figcaption></figcaption></figure>

The **Price alerts tab** contains the following columns:

| Column          | Meaning                                                                                                                                       |
| --------------- | --------------------------------------------------------------------------------------------------------------------------------------------- |
| Instrument      | Instrument symbol                                                                                                                             |
| Price           | Price level at which the alert will be triggered                                                                                              |
| Trigger on      | Price type at which the alert will be triggered (Last, Ask oder Bid)                                                                          |
| Reason          | The reason for alert (set manually)                                                                                                           |
| Sound           | The sound that will be played when the alert is triggered. If no sound is selected, the reason for alert will be spoken by a synthetic voice. |
| E-Mail          | An Email address can be entered (e.g. <user@agenatrader.com>). If the price alert gets triggered a notification will be sent per email.       |
| Popup           | If the price alert gets triggered a notification will be send as popup.                                                                       |
| Is global       | The price alert will be displayed on the chart                                                                                                |
| Is RTH          | The price alert will be activated only during the regular trading hours                                                                       |
| Mobile Notific. | Enable mobile notification                                                                                                                    |
| Parameter       | Custom user input                                                                                                                             |

*Right clicking in the **Price alerts tab** will bring up the context menu with the following options:*

* Add Alert: adds a new alert and opens a popup to enter the criteria.
* Edit Alert: opens the popup that allows you to edit the criteria.
* Remove Alert: deletes the selected alert.
* Export to MS Excel: exports the alert rows into a CSV-file.

Price alerts may be saved as [order templates](https://docs.agenatrader.com/main/chart-area/untitled/orders-templates). However, this setting is valid for discretionary trades but not for AT++ mode. Using the [Alert handler](https://docs.agenatrader.com/create-your-own-trading-strategy/scripting#Scripting__Programming_of_Alert_Handlers) you can program individual features for alerts.

**Important!** To make price alert visible on a chart please activate **Show Price Alert Lines**. Details on page [Chart Toolbar: Price markers and spread markers](https://docs.agenatrader.com/main/chart-area/untitled/price-markers-and-spread-markers)

### <img src="/files/Y9m5jqIfR9zKHO1tux49" alt="" data-size="line"> Time Alerts <a href="#time_alerts" id="time_alerts"></a>

Time alert is a one-time or iterative reminder about specific important dates such as:

* 14:30 American market data
* Expiration days for futures or options
* Reminder every Friday at 14:30 during 10 weeks etc.

<figure><img src="https://docs.agenatrader.com/~gitbook/image?url=https%3A%2F%2F2805764894-files.gitbook.io%2F%7E%2Ffiles%2Fv0%2Fb%2Fgitbook-legacy-files%2Fo%2Fassets%252F-MKZSsJBtSP9L4sqIe_q%252F-MQGhVKbpUZqxGhopWLQ%252F-MQHRlx4sIUIQzBMYTp2%252Ftime_alerts.png%3Falt%3Dmedia%26token%3D27a7af41-fc27-4f0e-9e91-7d0f16c84d31&#x26;width=768&#x26;dpr=4&#x26;quality=100&#x26;sign=e65d8e25&#x26;sv=1" alt=""><figcaption></figcaption></figure>

The **Time alerts tab** contains the following columns:

| Column          | Meaning                                                                                                                                    |
| --------------- | ------------------------------------------------------------------------------------------------------------------------------------------ |
| Date\&Time      | Date and time of the (next) reminder                                                                                                       |
| Reason          | The reason for alert (set manually)                                                                                                        |
| Iteration       | Repetition frequency for the time alert. If no repetition frequency is entered here, the alert will be triggered only once.                |
| Iteration Type  | tba                                                                                                                                        |
| Sound           | The sound to be played when the alert is triggered. If no sound is selected, the reason for the alert will be spoken by a synthetic voice. |
| E-Mail          | An Email address can be entered (e.g. <user@agenatrader.com>). If the price alert gets triggered a notification will be sent per email.    |
| Popup           | If the price alert gets triggered a notification will be send as popup.                                                                    |
| Mobile Notific. | Enable mobile notification                                                                                                                 |
| Cancel          | Deletes the alert                                                                                                                          |
| Parameter       | Custom user input                                                                                                                          |
| Show on Chart   | Display alert on Chart                                                                                                                     |
| Instruments     | Display alert only on exact Instrument Chart                                                                                               |
| Color           | Color of alert                                                                                                                             |

*Right clicking in the **Time alerts tab** will bring up the context menu with the following options:*

* Add Alert: adds a new alert and opens a popup to enter the criteria.
* Edit Alert: opens the popup that allows you to edit the criteria.
* Remove Alert: deletes the selected alert.
* Export to MS Excel : exports the alert rows into a CSV-file.

You may select the following criteria in the alert popup:

<figure><img src="https://docs.agenatrader.com/~gitbook/image?url=https%3A%2F%2F2805764894-files.gitbook.io%2F%7E%2Ffiles%2Fv0%2Fb%2Fgitbook-legacy-files%2Fo%2Fassets%252F-MKZSsJBtSP9L4sqIe_q%252F-MQGhVKbpUZqxGhopWLQ%252F-MQHRtfk33n_98LzsJlS%252FTime%2520Alert%2520%281%29.PNG%3Falt%3Dmedia%26token%3D561a2892-1ef4-49ef-bc41-90fe053dafda&#x26;width=768&#x26;dpr=4&#x26;quality=100&#x26;sign=130fa5c4&#x26;sv=1" alt=""><figcaption></figcaption></figure>

Using the [Alert handler](https://docs.agenatrader.com/create-your-own-trading-strategy/scripting#Scripting__Programming_of_Alert_Handlers) you can also program individual features for alerts.

### <img src="/files/hEzG0SzdiXpkDHLSJdd9" alt="" data-size="line"> Indicator Alerts <a href="#indicator_alerts" id="indicator_alerts"></a>

This functionality allows you to set an alert that will inform you when a particular indicator has crossed the defined price level.

Additional information in the section: [Add an indicator alert](https://docs.agenatrader.com/main/chart-area/untitled/chart-context-menu#add-indicator-alert).

<figure><img src="https://docs.agenatrader.com/~gitbook/image?url=https%3A%2F%2F2805764894-files.gitbook.io%2F%7E%2Ffiles%2Fv0%2Fb%2Fgitbook-legacy-files%2Fo%2Fassets%252F-MKZSsJBtSP9L4sqIe_q%252F-MQGhVKbpUZqxGhopWLQ%252F-MQHRxaxA2J_a5-xE_VU%252Findicator_alert.png%3Falt%3Dmedia%26token%3D7cc52c54-209b-4865-a2bf-0594debbf67a&#x26;width=768&#x26;dpr=4&#x26;quality=100&#x26;sign=95ca7207&#x26;sv=1" alt=""><figcaption></figcaption></figure>

The indicator alerts tab contains the following columns:

| Chart           | Shows the instrument and time frame for which an indicator alert was set                                                                                                                                                                                                                                                                                                                                                                                                                                                                                                                                                                                                                                                   |
| --------------- | -------------------------------------------------------------------------------------------------------------------------------------------------------------------------------------------------------------------------------------------------------------------------------------------------------------------------------------------------------------------------------------------------------------------------------------------------------------------------------------------------------------------------------------------------------------------------------------------------------------------------------------------------------------------------------------------------------------------------- |
| Indicator       | The indicator that will trigger the alert once the set price level is crossed                                                                                                                                                                                                                                                                                                                                                                                                                                                                                                                                                                                                                                              |
| Last Price      | Current price                                                                                                                                                                                                                                                                                                                                                                                                                                                                                                                                                                                                                                                                                                              |
| Alert Price     | Price level at which alert will be triggered                                                                                                                                                                                                                                                                                                                                                                                                                                                                                                                                                                                                                                                                               |
| Reason          | The reason for alert (set manually)                                                                                                                                                                                                                                                                                                                                                                                                                                                                                                                                                                                                                                                                                        |
| Sound           | The sound to be played when the alert is triggered. If no sound is selected, the reason for alert will be spoken by a synthetic voice.                                                                                                                                                                                                                                                                                                                                                                                                                                                                                                                                                                                     |
| State           | There are two possible states: [![Dot](https://docs.agenatrader.com/~gitbook/image?url=https%3A%2F%2Fagenatrader.com%2Fwiki%2Ftiki-download_file.php%3FfileId%3D22%26display\&width=300\&dpr=4\&quality=100\&sign=5ef5815b\&sv=1) ](https://agenatrader.com/wiki/tiki-download_file.php?fileId=22\&display)Waiting: the alert has not been yet triggered [![Dot](https://docs.agenatrader.com/~gitbook/image?url=https%3A%2F%2Fagenatrader.com%2Fwiki%2Ftiki-download_file.php%3FfileId%3D22%26display\&width=300\&dpr=4\&quality=100\&sign=5ef5815b\&sv=1) ](https://agenatrader.com/wiki/tiki-download_file.php?fileId=22\&display)Activated: the alert has been triggered by the price that reached the specified level |
| Mobile Notific. | Enable mobile notification                                                                                                                                                                                                                                                                                                                                                                                                                                                                                                                                                                                                                                                                                                 |
| Cancel          | Deletes the alert                                                                                                                                                                                                                                                                                                                                                                                                                                                                                                                                                                                                                                                                                                          |

*Right clicking in the **Indicator alerts tab** will bring up the context menu with the following options:*

* Add Alert: adds a new alert and opens a popup to enter the criteria.
* Edit Alert: opens the popup that allows you to edit the criteria.
* Remove Alert: deletes the selected alert.
* Export to MS Excel : exports the alert rows into a CSV-file.

Using the [Alert handler](https://docs.agenatrader.com/create-your-own-trading-strategy/scripting#Scripting__Programming_of_Alert_Handlers) you can also program individual features for alerts.

### IfDone, OCO Connections between alerts <a href="#ifdone_oco_connections_between_alerts" id="ifdone_oco_connections_between_alerts"></a>

Connect alerts with IfDone (alt + left mouse button) and OCO (Strg(Ctrl) + left mouse button) connections.

**Example**

1. If the entry order gets triggered the Alert1 short and Alert1 long will be activated because a IfDone connection (green line) was set.
2. If the Limit order (long target) gets filled the price Alert1 short will be cancelled because of a OCO connection (red line) was set. Furthermore if the Alert1 (long) gets triggered the Stop order will be cancelled.
3. If the Stop order (short stop) gets filled the price Alert1 long will be cancelled because of a OCO connection (red line) was set. Furthermore if the Alert1 (short) gets triggered the Limit (Target) order will be cancelled.

<figure><img src="https://docs.agenatrader.com/~gitbook/image?url=https%3A%2F%2F2805764894-files.gitbook.io%2F%7E%2Ffiles%2Fv0%2Fb%2Fgitbook-legacy-files%2Fo%2Fassets%252F-MKZSsJBtSP9L4sqIe_q%252F-MQGhVKbpUZqxGhopWLQ%252F-MQHSAvDtylg4ZXqjPhT%252Fifdone__oco_connections_custom.png%3Falt%3Dmedia%26token%3Dd3b52e13-b4a1-4ebb-9c8e-45c36b8c64c0&#x26;width=768&#x26;dpr=4&#x26;quality=100&#x26;sign=3772a66f&#x26;sv=1" alt=""><figcaption></figcaption></figure>

Price alerts can be connected among each other in the OCO-group

## <img src="/files/vk3y74wHxmttJqXG4b8D" alt="" data-size="line"> Account connections for broker and datafeed <a href="#account-connections-for-broker-and-datafeed" id="account-connections-for-broker-and-datafeed"></a>

The window "Account connections set up" includes three tabs:

1. Connections
2. Datafeeds
3. Accounts

For more information, please take a look at the section: [Multi account settings](https://docs.agenatrader.com/main/broker-and-datafeed-connections/multi-account-settings).

## &#x20;<img src="/files/1hEklf2pu2ZhND4RFLHJ" alt="" data-size="line">Packages <a href="#packages" id="packages"></a>

AgenaTrader lets you create packages that you can then distribute (export and import) to another computer. These packages can contain your own:

* conditions
* indicators
* strategies
* chart templates
* workspaces etc.

<figure><img src="https://docs.agenatrader.com/~gitbook/image?url=https%3A%2F%2F2805764894-files.gitbook.io%2F%7E%2Ffiles%2Fv0%2Fb%2Fgitbook-legacy-files%2Fo%2Fassets%252F-MKZSsJBtSP9L4sqIe_q%252F-MQGhVKbpUZqxGhopWLQ%252F-MQHSEa8K0qDK0-hwcF-%252FPAckage.png%3Falt%3Dmedia%26token%3Da8cdc0e5-b3d9-48d6-8e98-d3f8c32688ef&#x26;width=768&#x26;dpr=4&#x26;quality=100&#x26;sign=68ee1f81&#x26;sv=1" alt=""><figcaption></figcaption></figure>

This functionality enables you to share your customized components with clients, friends and colleagues by sending packages via email. These can also easily be imported or installed on other computers. In the future we plan to provide a service for our customers wishing to share their self-developed packages with the community, either free of charge or on a commercial basis via our webstore, which should be opened sometime during the next year.

### <img src="/files/9wwgHOK5bicVA631Vpyd" alt="" data-size="line">How to create a package <a href="#how_to_create_a_package" id="how_to_create_a_package"></a>

1. Select **Tools -> Packages** and then **Create package** from the main menu.
2. This will bring up a tab where you can check the **Export Logs** checkbox and set a date range for information to be compiled.
3. Click the **Create** button to save this package.

<figure><img src="https://docs.agenatrader.com/~gitbook/image?url=https%3A%2F%2F2805764894-files.gitbook.io%2F%7E%2Ffiles%2Fv0%2Fb%2Fgitbook-legacy-files%2Fo%2Fassets%252F-MKZSsJBtSP9L4sqIe_q%252F-MQGhVKbpUZqxGhopWLQ%252F-MQHSIPCwPSTAWH3hypa%252FPackage1.png%3Falt%3Dmedia%26token%3D8149895d-0ee1-4d42-b4b9-830961b0b78b&#x26;width=768&#x26;dpr=4&#x26;quality=100&#x26;sign=316aa6c5&#x26;sv=1" alt=""><figcaption></figcaption></figure>

{% hint style="info" %}
Attention! For detailed instructions on importing packages, please visit the corresponding [page](/package/package-first-steps#import-packages)[.](/package/package-first-steps#create-packages-setup)
{% endhint %}

### <img src="/files/7Wq9rqWXoZvZKUIsAnhs" alt="" data-size="line">How to import package <a href="#how_to_delete_a_package" id="how_to_delete_a_package"></a>

The setup is located in the main menu bar in the "TOOLS" tab under the category "Packages", followed by Create package or Import package, and the displaying or deleting of already imported packages.

![](https://docs.agenatrader.com/~gitbook/image?url=https%3A%2F%2F2805764894-files.gitbook.io%2F%7E%2Ffiles%2Fv0%2Fb%2Fgitbook-legacy-files%2Fo%2Fassets%252F-MKZSsJBtSP9L4sqIe_q%252F-MQuyUOvSDf10S_TO9Zp%252F-MQw1PxaIbqCchkvB1Yv%252Fpackage.png%3Falt%3Dmedia%26token%3De1803930-055a-4b97-adad-2eb63745085e\&width=768\&dpr=4\&quality=100\&sign=4cd4a76a\&sv=1)

{% hint style="info" %}
Attention! For detailed instructions on importing packages, please visit the corresponding [page](/package/package-first-steps#import-packages).
{% endhint %}

### <img src="/files/k4nF6cfM1jmTq9jZZSst" alt="" data-size="line"> Imported Packages <a href="#how_to_delete_a_package" id="how_to_delete_a_package"></a>

#### How to delete a package <a href="#how_to_delete_a_package" id="how_to_delete_a_package"></a>

1. Select **Tools -> Packages** and then **Imported Packages** from the main menu.
2. This will bring up a tab where you can select the **Package** you want to delete
3. Right click on **Package** **->** **Remove**

<figure><img src="https://docs.agenatrader.com/~gitbook/image?url=https%3A%2F%2F2805764894-files.gitbook.io%2F%7E%2Ffiles%2Fv0%2Fb%2Fgitbook-legacy-files%2Fo%2Fassets%252F-MKZSsJBtSP9L4sqIe_q%252F-MQGhVKbpUZqxGhopWLQ%252F-MQHSNklnoAoJ9IIxKkd%252FRemove%2520Package.png%3Falt%3Dmedia%26token%3D615cd08d-c691-4bb6-94f9-bba834394ae9&#x26;width=768&#x26;dpr=4&#x26;quality=100&#x26;sign=f9710398&#x26;sv=1" alt=""><figcaption></figcaption></figure>

{% hint style="info" %}
**Attention!** Before deleting package please certify that you use neutral Workspace. More details in [Workspace menu](https://docs.agenatrader.com/main/main-menu/workspace-menu)
{% endhint %}

### How to update a package <a href="#how_to_update_a_package" id="how_to_update_a_package"></a>

1. Select **Tools -> Packages** and then **Imported Packages** from the main menu.
2. This will bring up a tab where you can select the **Package** you want to update
3. Left click on **Update-to-date** button

<figure><img src="https://docs.agenatrader.com/~gitbook/image?url=https%3A%2F%2F2805764894-files.gitbook.io%2F%7E%2Ffiles%2Fv0%2Fb%2Fgitbook-legacy-files%2Fo%2Fassets%252F-MKZSsJBtSP9L4sqIe_q%252F-MQGhVKbpUZqxGhopWLQ%252F-MQHSl5jV2K_hC7Zm_Dy%252F11.png%3Falt%3Dmedia%26token%3Dcff49bbf-e66f-49f1-8a21-c64f3e53cf8c&#x26;width=768&#x26;dpr=4&#x26;quality=100&#x26;sign=1c306447&#x26;sv=1" alt=""><figcaption></figcaption></figure>

{% hint style="warning" %}
**Attention!** Before updating package please certify that you use neutral Workspace. More details in [Workspace menu](https://docs.agenatrader.com/main/main-menu/workspace-menu)
{% endhint %}

In the [**Top FAQs**](https://docs.agenatrader.com/faq/frequently-asked-questions) section you can find the installation manual, including licensing and download for our AddOns:

* Markus Gabel
* Carsten Umland,
* Rüdiger Born.

The Market technique AddOn does not have to be imported and therefore does not require any additional license key. After the activation AgenaTrader must be restarted. This doocument includes the explanation how to create an AddOn (package) as well.

## <img src="/files/Ml2lUfIJAXVgTtiH7G9b" alt="" data-size="line"> Language <a href="#language" id="language"></a>

To change the language of AgenaTrader, select your desired language within the **Tools -> Language** menu.

<figure><img src="https://docs.agenatrader.com/~gitbook/image?url=https%3A%2F%2F2805764894-files.gitbook.io%2F%7E%2Ffiles%2Fv0%2Fb%2Fgitbook-legacy-files%2Fo%2Fassets%252F-MKZSsJBtSP9L4sqIe_q%252F-MQGhVKbpUZqxGhopWLQ%252F-MQHSuaW6R6I-OQJPgLM%252FLanguage.png%3Falt%3Dmedia%26token%3Df15f450e-db35-49df-83a7-984e491935ca&#x26;width=768&#x26;dpr=4&#x26;quality=100&#x26;sign=55b5b7a9&#x26;sv=1" alt=""><figcaption></figcaption></figure>

Once selected, you must restart AgenaTrader. The dialogue box will prompt you to either restart the program immediately or later on.

<figure><img src="https://docs.agenatrader.com/~gitbook/image?url=https%3A%2F%2F2805764894-files.gitbook.io%2F%7E%2Ffiles%2Fv0%2Fb%2Fgitbook-legacy-files%2Fo%2Fassets%252F-MKZSsJBtSP9L4sqIe_q%252F-MQGhVKbpUZqxGhopWLQ%252F-MQHSyQ51hvlkBT-kxgV%252FLanguage1.png%3Falt%3Dmedia%26token%3D3cbe2db6-b254-4044-b66b-83386b051a69&#x26;width=768&#x26;dpr=4&#x26;quality=100&#x26;sign=fd16cc40&#x26;sv=1" alt=""><figcaption></figcaption></figure>


# Trading Information

## Trading Center

The trading center is a logical grouping of all the tabs that are relevant to trading. This grouping can be defined and customized according to your preferences and does not need to look exactly like the example below:

<figure><img src="/files/HPzPJglmR1e61M9NFuiE" alt=""><figcaption></figcaption></figure>

| Tab                                                                                      | Meaning                                                                                                                                                                                                                                                                                                                                         |
| ---------------------------------------------------------------------------------------- | ----------------------------------------------------------------------------------------------------------------------------------------------------------------------------------------------------------------------------------------------------------------------------------------------------------------------------------------------- |
| <img src="/files/gwyet18IRH1z7HcFNBbd" alt="" data-size="line"> Order manager            | Contains all currently active or already executed orders.                                                                                                                                                                                                                                                                                       |
| <img src="/files/WFvuLdgpjAPwdA4mo2cM" alt="" data-size="line"> Trades                   | contains the individual trading decisions made in various time frames. Positions may be displayed differently if opposite positions are existent. In the above example, **Positions tab** and **Trades tab** contain the same information because there are no [counter positions](https://docs.agenatrader.com/faq/more-help#Counter_trading). |
| <img src="/files/k8lHX9x1p08eLoxeCRfR" alt="" data-size="line"> Part-Trades              | Separates trade fragments, e.g. from entry to target 1.                                                                                                                                                                                                                                                                                         |
| <img src="/files/tj1K5LVbGTGq5tdl1Tor" alt="" data-size="line"> Executions               | Displays the order executions (as well as partial executions).                                                                                                                                                                                                                                                                                  |
| <img src="/files/8pyHA3toYMGD1pwXsuUD" alt="" data-size="line"> Account                  | Shows detailed account information associated with the currently connected broker.                                                                                                                                                                                                                                                              |
| <img src="/files/OJzDBDzPfBScYCxoBuWJ" alt="" data-size="line"> Default Trading Accounts | Shows the selected account ID                                                                                                                                                                                                                                                                                                                   |
| <img src="/files/YMk3D5tJ0fQGY5UWm3wi" alt="" data-size="line"> Open Orders Log          | Opens the orders log                                                                                                                                                                                                                                                                                                                            |

*The time range filter* (within the Order manager/Positions manager/Trades manager/Part trades manager/Executions tabs) With the help of this filter you can display the corresponding entries for a specified time interval. You also may choose user account. Currently running positions (open positions/trades/...) will always be displayed regardless of your filter settings.

<figure><img src="https://docs.agenatrader.com/~gitbook/image?url=https%3A%2F%2F2805764894-files.gitbook.io%2F%7E%2Ffiles%2Fv0%2Fb%2Fgitbook-legacy-files%2Fo%2Fassets%252F-MKZSsJBtSP9L4sqIe_q%252F-MQC5oGiykjQLWeB50o-%252F-MQC72mT-IWSzKtRNnPQ%252FFilter.PNG%3Falt%3Dmedia%26token%3Da22b622b-43c5-44ee-8602-5cc26ea4a20b&#x26;width=768&#x26;dpr=4&#x26;quality=100&#x26;sign=53eb173c&#x26;sv=1" alt=""><figcaption></figcaption></figure>

*Context menu functions*

Right click within the tab column to access the following options:

* Sort Ascending: sorts in ascending order
* Sort Descending: sorts in descending order
* Best Fit: adjusts column width of the selected column
* Best Fit All: adjusts column width of all columns
* Choose Columns: select the columns to be displayed

<figure><img src="https://docs.agenatrader.com/~gitbook/image?url=https%3A%2F%2F2805764894-files.gitbook.io%2F%7E%2Ffiles%2Fv0%2Fb%2Fgitbook-legacy-files%2Fo%2Fassets%252F-MKZSsJBtSP9L4sqIe_q%252F-MQC5oGiykjQLWeB50o-%252F-MQC75yy5eC6a37s77F4%252Ftrading_center_context.png%3Falt%3Dmedia%26token%3Dabce2fde-e350-4c11-b7f9-481818f9bc4c&#x26;width=768&#x26;dpr=4&#x26;quality=100&#x26;sign=8a7a17ff&#x26;sv=1" alt=""><figcaption></figcaption></figure>

## <img src="/files/YU0dkulWa7ILa34JauJx" alt="" data-size="line"> Order Manager <a href="#trading_information__order_manager" id="trading_information__order_manager"></a>

The order manager is divided into two sections: the order list and the order pad.

**Order list**

<figure><img src="https://docs.agenatrader.com/~gitbook/image?url=https%3A%2F%2F2805764894-files.gitbook.io%2F%7E%2Ffiles%2Fv0%2Fb%2Fgitbook-legacy-files%2Fo%2Fassets%252F-MKZSsJBtSP9L4sqIe_q%252F-MQC5oGiykjQLWeB50o-%252F-MQC7A9MHtmHkqYAU4IM%252Forder_manager2.png%3Falt%3Dmedia%26token%3D9e10bb8a-1b05-424a-a04f-8fc10469ac55&#x26;width=768&#x26;dpr=4&#x26;quality=100&#x26;sign=79e765f9&#x26;sv=1" alt=""><figcaption></figcaption></figure>

The order list contains all active and inactive orders (deleted, executed, etc.) with the following information:

| Column                                                                        | Meaning                                                                                                                                            |
| ----------------------------------------------------------------------------- | -------------------------------------------------------------------------------------------------------------------------------------------------- |
| Symbol                                                                        | The market symbol for an instrument                                                                                                                |
| Creation time                                                                 | Date/time when the order was submitted                                                                                                             |
| Last change                                                                   | Date/time when quantity or price were last changed                                                                                                 |
| Name                                                                          | Name of the order e.g. entry scenario, stop method, target level                                                                                   |
| Time-Frame                                                                    | Time frame if the order was placed as part of a strategy                                                                                           |
| [Type](https://docs.agenatrader.com/main/chart-area/order-escort#Order_types) | Stop, Limit, Market, StopLimit                                                                                                                     |
| [Mode](https://docs.agenatrader.com/main/chart-area/order-escort#Order_types) | Direct, synthetic, dynamic order                                                                                                                   |
| State                                                                         | Status of the order (depends on the broker): undetermined, partially filled, filled, rejected, deleted, etc.                                       |
| Order/Action                                                                  | Sell or buy order                                                                                                                                  |
| Quantity                                                                      | Units of instruments ordered                                                                                                                       |
| Price                                                                         | Price level at which the order was placed                                                                                                          |
| Stop Price                                                                    | If the type of order is StopLimit, then stop price will activate the limit order                                                                   |
| AvgFillPrice                                                                  | The "fill" price (execution price) for different [executions](https://docs.agenatrader.com/tools/trading-information#execution-lists) of the order |
| Account                                                                       | The account to which the order is assigned                                                                                                         |
| Tif                                                                           | Operating time for the order (time in force)                                                                                                       |
| Gtd                                                                           | Date of expiry ("good till day/date")                                                                                                              |
| OCO                                                                           | Shows if the order is part of an OCO connection                                                                                                    |
| ORO                                                                           | Shows if the order is part of an ORO connection                                                                                                    |
| IfDone                                                                        | Shows if the order is part of an IfDone connection                                                                                                 |
| Cancel                                                                        | Deletes the order                                                                                                                                  |

With a double mouse click on splitter bar you may open chart where selected order was running:

<figure><img src="https://docs.agenatrader.com/~gitbook/image?url=https%3A%2F%2F2805764894-files.gitbook.io%2F%7E%2Ffiles%2Fv0%2Fb%2Fgitbook-legacy-files%2Fo%2Fassets%252F-MKZSsJBtSP9L4sqIe_q%252F-MQC5oGiykjQLWeB50o-%252F-MQC7Ey8g9MpkYhTe2Du%252FOrder%2520Manager.png%3Falt%3Dmedia%26token%3Dd09966c5-6937-4043-bb68-44a8c7183f46&#x26;width=768&#x26;dpr=4&#x26;quality=100&#x26;sign=dc16be9&#x26;sv=1" alt=""><figcaption></figcaption></figure>

*The Context menu of the order list includes the following options:*

<figure><img src="https://docs.agenatrader.com/~gitbook/image?url=https%3A%2F%2F2805764894-files.gitbook.io%2F%7E%2Ffiles%2Fv0%2Fb%2Fgitbook-legacy-files%2Fo%2Fassets%252F-MKZSsJBtSP9L4sqIe_q%252F-MQC5oGiykjQLWeB50o-%252F-MQC7IHWgdC8a26fWjk_%252Forder_manager_context.png%3Falt%3Dmedia%26token%3Dc19661cc-fb75-461d-b2ce-56a524cd1b01&#x26;width=768&#x26;dpr=4&#x26;quality=100&#x26;sign=6a0f273a&#x26;sv=1" alt=""><figcaption></figcaption></figure>

* Replace order: applies the entered order data from the order list to the order pad. You can change the parameters and activate them by clicking the **Replace** button. Click the **Cancel** button to revert to the original settings.

<figure><img src="https://docs.agenatrader.com/~gitbook/image?url=https%3A%2F%2F2805764894-files.gitbook.io%2F%7E%2Ffiles%2Fv0%2Fb%2Fgitbook-legacy-files%2Fo%2Fassets%252F-MKZSsJBtSP9L4sqIe_q%252F-MQC5oGiykjQLWeB50o-%252F-MQC7MvTskj8D7LPW6E6%252Freplace_order.png%3Falt%3Dmedia%26token%3D1f7ba569-c66a-4768-8365-21f8bfecfe6b&#x26;width=768&#x26;dpr=4&#x26;quality=100&#x26;sign=9345af5c&#x26;sv=1" alt=""><figcaption></figcaption></figure>

* Cancel Order: deletes the selected order
* Cancel All Orders: deletes all active orders
* Show [execution list](https://docs.agenatrader.com/tools/trading-information#execution-lists): displays the execution list for orders
* Active Orders Only: displays only active orders
* Create OCO Group: creates an OCO connection between two orders
* Create ORO Group: creates an ORO connection between two orders
* Create IfDone Group: creates an IfDone connection between two orders
* Remove OCO: deletes the OCO connection but not the orders
* Remove ORO: deletes the ORO connection but not the orders
* Remove IfDone: deletes the IfDone connection but not the orders
* Export to MS Excel: exports entry into a CSV file
* Connect with Chart: connects the order manager with a single chart or single chart group

More information about order combinations in the [Order groups (connections](https://docs.agenatrader.com/main/chart-area/untitled/chart-context-menu#order-groups)) section.

## <img src="/files/dT4tdGgp82vReivHTz0q" alt="" data-size="line"> Trades Manager <a href="#trades-manager" id="trades-manager"></a>

The **Trades tab** displays all currently running and closed positions.

<figure><img src="https://docs.agenatrader.com/~gitbook/image?url=https%3A%2F%2F2805764894-files.gitbook.io%2F%7E%2Ffiles%2Fv0%2Fb%2Fgitbook-legacy-files%2Fo%2Fassets%252F-MKZSsJBtSP9L4sqIe_q%252F-MQC5oGiykjQLWeB50o-%252F-MQC7RVfNTJLbKZF60JE%252Ftrades_context.png%3Falt%3Dmedia%26token%3D5dffdc53-6c59-4bf6-9557-8c7d565faa07&#x26;width=768&#x26;dpr=4&#x26;quality=100&#x26;sign=7ce3c824&#x26;sv=1" alt=""><figcaption></figcaption></figure>

| Column              | Meaning                                                                                                                                                                                                                                                                                                                                                 |
| ------------------- | ------------------------------------------------------------------------------------------------------------------------------------------------------------------------------------------------------------------------------------------------------------------------------------------------------------------------------------------------------- |
| Account             | The account associated with the position                                                                                                                                                                                                                                                                                                                |
| Exchange            | The exchange for the traded instrument                                                                                                                                                                                                                                                                                                                  |
| Type                | The instrument type (currency, stocks, futures, etc.)                                                                                                                                                                                                                                                                                                   |
| Instrument Name     | The full instrument name                                                                                                                                                                                                                                                                                                                                |
| Symbol              | The market symbol for an instrument                                                                                                                                                                                                                                                                                                                     |
| Direction           | Long or short position                                                                                                                                                                                                                                                                                                                                  |
| Time Frame          | Time frame in which the trade was opened                                                                                                                                                                                                                                                                                                                |
| Entry Time          | The date and time of the entry order                                                                                                                                                                                                                                                                                                                    |
| Entry Reason        | The reason for the entry (i.e. for for strategies)                                                                                                                                                                                                                                                                                                      |
| Entry Price         | The price of the entry order                                                                                                                                                                                                                                                                                                                            |
| Entry Average Price | The average price of all executed entry orders for a specific instrument                                                                                                                                                                                                                                                                                |
| Quantity            | The volume of the position                                                                                                                                                                                                                                                                                                                              |
| Current Value       | The current value of the trade (calculated as quantity times entry avgPrice)                                                                                                                                                                                                                                                                            |
| Last Change         | The date and time of the last order execution for a specific instrument                                                                                                                                                                                                                                                                                 |
| Exit Reason         | The reason for exit: manually closed, target, stop, etc.                                                                                                                                                                                                                                                                                                |
| Exit Price          | The price of the exit order of the position                                                                                                                                                                                                                                                                                                             |
| Exit Average Price  | The average price of all executed exit orders for a specific instrument                                                                                                                                                                                                                                                                                 |
| Volume Closed       | Closed volume of the position                                                                                                                                                                                                                                                                                                                           |
| Exit Currency       | P\&L currency (see [settings for PL currency](https://docs.agenatrader.com/tools/configuration-escort#general) in the **Global Configuration**)                                                                                                                                                                                                         |
| Opened P\&L         | The profit/loss of the trade                                                                                                                                                                                                                                                                                                                            |
| Closed P\&L         | The realized profit/loss of the trade                                                                                                                                                                                                                                                                                                                   |
| Commission          | Commissions for the executed trades (based on the sum of partial trade commissions)                                                                                                                                                                                                                                                                     |
| Comment             | The cell in which you can enter a comment or add a picture (double-clicking will open an Editor)                                                                                                                                                                                                                                                        |
| Snapshot            | AgenaTrader can save not only trading data but also various charts within different time frames. In the evaluation list you will find a link to this image. The template to be used for the snapshot can be selected in the **Global Configuration** tabs [Global Configuration: Chart](https://docs.agenatrader.com/tools/configuration-escort#chart). |

With a double mouse click on splitter bar you may open chart where selected trade was running:

<figure><img src="https://docs.agenatrader.com/~gitbook/image?url=https%3A%2F%2F2805764894-files.gitbook.io%2F%7E%2Ffiles%2Fv0%2Fb%2Fgitbook-legacy-files%2Fo%2Fassets%252F-MKZSsJBtSP9L4sqIe_q%252F-MQC5oGiykjQLWeB50o-%252F-MQC7iTcEXVjtNqDFc8u%252FTrades.png%3Falt%3Dmedia%26token%3Df33da8e1-2e25-4449-9c51-bda7cf82109d&#x26;width=768&#x26;dpr=4&#x26;quality=100&#x26;sign=394338d5&#x26;sv=1" alt=""><figcaption></figcaption></figure>

You may add or change columns. **Richt click on a column**-**>Choose Columns**

<figure><img src="https://docs.agenatrader.com/~gitbook/image?url=https%3A%2F%2F2805764894-files.gitbook.io%2F%7E%2Ffiles%2Fv0%2Fb%2Fgitbook-legacy-files%2Fo%2Fassets%252F-MKZSsJBtSP9L4sqIe_q%252F-MQC5oGiykjQLWeB50o-%252F-MQC7mCaIW1zT_q4u7me%252FTrades%2520column.png%3Falt%3Dmedia%26token%3D3113059f-7df5-41d8-828d-33df5603abbf&#x26;width=768&#x26;dpr=4&#x26;quality=100&#x26;sign=3411ccef&#x26;sv=1" alt=""><figcaption></figcaption></figure>

The trades manager context menu includes the following options:

<figure><img src="https://docs.agenatrader.com/~gitbook/image?url=https%3A%2F%2F2805764894-files.gitbook.io%2F%7E%2Ffiles%2Fv0%2Fb%2Fgitbook-legacy-files%2Fo%2Fassets%252F-MKZSsJBtSP9L4sqIe_q%252F-MQC5oGiykjQLWeB50o-%252F-MQC7vjtYUNqJrkhF_lp%252Ftrades_context_m.png%3Falt%3Dmedia%26token%3Dc6738e31-9ab9-47b9-beb8-b2f3c4d0a896&#x26;width=768&#x26;dpr=4&#x26;quality=100&#x26;sign=52b97957&#x26;sv=1" alt=""><figcaption></figcaption></figure>

* Show PL percent: shows the profit/loss in percent
* Show executions list: opens the executions popup and shows all conducted executions for this position
* Show partial trades: opens the partial trades popup and shows all partial trades
* Edit comment: opens the Editor
* Active Trades Only: if activated only active trades are displayed if not all trades will be visible.
* Assign Time Frame: assigns a time frame to the entry order. If no time frame has been assigned within the order list or the trade was opened outside of a chart, then the trade can not be started with AgenaTrader++ (see settings in the [Setup Builder](https://docs.agenatrader.com/create-your-own-trading-strategy/setup-escort)). Using this option you can assign a time frame to the trade, but the time frame for trading in AgenaTrader++ cannot be changed.
* Start AgenaTrader++ plusplus for trade: if the trade has been opened within the 3rd Level Box or the order list, for example, then it cannot be started afterwards in AgenaTrader++. You can only start it in AgenaTrader++ if you have assigned a time frame to it.
* Close trade: closes the trade.
* Export to MS Excel: exports the trades list to a CSV file.
* Create New Instrument List: creates an [instrument list](https://docs.agenatrader.com/tools/instrument-escort#Instrument_Escort__Creating__and_managing_instrument_lists) from the instruments included in the tab.
* Replace Instrument List: replaces a created instrument list with another available list.
* Connect with chart: selecting this functionality allows you to drag a single chart or single chart group with the mouse. This will change the mouse indicator into a rectangle with an arrow. If you now click on the chart, the rows of the position manager will be linked to this chart (single chart or single chart group). After clicking through the instruments in the **Strategy Escort**, only the appropriate chart will now be loaded.
* Edit: trade information can be edited manually to ensure a correct Trading Journal.

### Edit Trade <a href="#edit-trade" id="edit-trade"></a>

With **Edit Trades** function we created the possibility to edit each trade manually or even add new trades, orders and executions. As result the **Trading Journal** displays the final data compared to your trading account at the broker.

<figure><img src="https://docs.agenatrader.com/~gitbook/image?url=https%3A%2F%2F2805764894-files.gitbook.io%2F%7E%2Ffiles%2Fv0%2Fb%2Fgitbook-legacy-files%2Fo%2Fassets%252F-MKZSsJBtSP9L4sqIe_q%252F-MQC5oGiykjQLWeB50o-%252F-MQC8-dCiM30Jmpc65lh%252FEdit_trade1.png%3Falt%3Dmedia%26token%3D1c3815c9-39d5-4db0-988c-4dde378029b0&#x26;width=768&#x26;dpr=4&#x26;quality=100&#x26;sign=92e78984&#x26;sv=1" alt=""><figcaption></figcaption></figure>

Description of buttons:

* Add Trade State: is always active and a Trade can be added.
* Add Order: becomes active if you click on Partial Trade since an order can only be part of a partial trade.
* Add Execution: becomes active if you click on Order since an execution can only be part of an order.
* The Edit button: becomes active with every item on the list.
* The Remove button: becomes active with every item on the list.

**First item: Edit Trade**

<figure><img src="https://docs.agenatrader.com/~gitbook/image?url=https%3A%2F%2F2805764894-files.gitbook.io%2F%7E%2Ffiles%2Fv0%2Fb%2Fgitbook-legacy-files%2Fo%2Fassets%252F-MKZSsJBtSP9L4sqIe_q%252F-MQC5oGiykjQLWeB50o-%252F-MQC83ZCbZxK4vzYiyao%252FEdit_trade2.png%3Falt%3Dmedia%26token%3Dd975e729-a04c-4dd5-9923-7742fd9e210c&#x26;width=768&#x26;dpr=4&#x26;quality=100&#x26;sign=d752e3d7&#x26;sv=1" alt=""><figcaption></figcaption></figure>

**Second item: Edit Trade State (Partial Trade)**

<figure><img src="https://docs.agenatrader.com/~gitbook/image?url=https%3A%2F%2F2805764894-files.gitbook.io%2F%7E%2Ffiles%2Fv0%2Fb%2Fgitbook-legacy-files%2Fo%2Fassets%252F-MKZSsJBtSP9L4sqIe_q%252F-MQC5oGiykjQLWeB50o-%252F-MQC871Kg7hmLek11kNQ%252FEdit_trade3.png%3Falt%3Dmedia%26token%3D0af7dd65-4cc9-4339-850c-92a25d203a08&#x26;width=768&#x26;dpr=4&#x26;quality=100&#x26;sign=1652cea0&#x26;sv=1" alt=""><figcaption></figcaption></figure>

**Third item: Edit Order**

<figure><img src="https://docs.agenatrader.com/~gitbook/image?url=https%3A%2F%2F2805764894-files.gitbook.io%2F%7E%2Ffiles%2Fv0%2Fb%2Fgitbook-legacy-files%2Fo%2Fassets%252F-MKZSsJBtSP9L4sqIe_q%252F-MQC5oGiykjQLWeB50o-%252F-MQC8A1TwbbxOuA6JzEM%252FEdit_trade4.png%3Falt%3Dmedia%26token%3D41953fe2-4721-4f5c-ac37-5d8fc0ab648c&#x26;width=768&#x26;dpr=4&#x26;quality=100&#x26;sign=f11f7e5c&#x26;sv=1" alt=""><figcaption></figcaption></figure>

**Fourth item: Edit Execution**

<figure><img src="https://docs.agenatrader.com/~gitbook/image?url=https%3A%2F%2F2805764894-files.gitbook.io%2F%7E%2Ffiles%2Fv0%2Fb%2Fgitbook-legacy-files%2Fo%2Fassets%252F-MKZSsJBtSP9L4sqIe_q%252F-MQC5oGiykjQLWeB50o-%252F-MQC8DLsgOCYF2XoV5iH%252FEdit_trade5.png%3Falt%3Dmedia%26token%3De6069b2c-2ff9-4450-a071-363eeedf7a23&#x26;width=768&#x26;dpr=4&#x26;quality=100&#x26;sign=5199f866&#x26;sv=1" alt=""><figcaption></figcaption></figure>

### Application Instructions <a href="#application-instructions" id="application-instructions"></a>

*To link the **Trades tab** to a* [*single chart*](https://docs.agenatrader.com/main/chart-area/chart-container/chart-container#single-chart)*, use one of the following methods:*

1. right click within the Trades tab and select the **Connect with Chart** menu item, then move the mouse to the designated chart and click the left mouse button.
2. left click on the ![Plus](https://docs.agenatrader.com/~gitbook/image?url=https%3A%2F%2F2805764894-files.gitbook.io%2F%7E%2Ffiles%2Fv0%2Fb%2Fgitbook-legacy-files%2Fo%2Fassets%252F-MKZSsJBtSP9L4sqIe_q%252F-MQC5oGiykjQLWeB50o-%252F-MQC8GWC7ZLgCXU_FFqZ%252Fplus.png%3Falt%3Dmedia%26token%3D3039684c-5ac1-45b5-b2b0-f19030093f0d\&width=300\&dpr=4\&quality=100\&sign=3ef24b82\&sv=1) button, then hold down the mouse button, move it into the chart and release the button.

<figure><img src="https://docs.agenatrader.com/~gitbook/image?url=https%3A%2F%2F2805764894-files.gitbook.io%2F%7E%2Ffiles%2Fv0%2Fb%2Fgitbook-legacy-files%2Fo%2Fassets%252F-MKZSsJBtSP9L4sqIe_q%252F-MQC5oGiykjQLWeB50o-%252F-MQC8L85rCDMEDUQ6DYx%252FTrades%2520filter.PNG%3Falt%3Dmedia%26token%3De4335318-9e19-4b78-bfc1-daf65c3636ca&#x26;width=768&#x26;dpr=4&#x26;quality=100&#x26;sign=4ee283c7&#x26;sv=1" alt=""><figcaption></figcaption></figure>

The linking of the **Trades tab** to a [single chart group](https://docs.agenatrader.com/main/chart-area/chart-container/chart-container#single-chart-group) will be available in one of the next AgenaTrader versions.

## <img src="/files/vyqFcvMan8gX4oaKtyI0" alt="" data-size="line"> Part Trades <a href="#part-trades" id="part-trades"></a>

If one or more targets are reached ("scale out"), these "part trades" will be displayed in the Part Trades list. The last part trade that completes the trade will also be displayed here.

**Example: EURJPY**

The trade will be shown in the **Execution list** in the following manner:

* Buy 100K
* Sell 25K
* Sell 75K

<figure><img src="https://docs.agenatrader.com/~gitbook/image?url=https%3A%2F%2F2805764894-files.gitbook.io%2F%7E%2Ffiles%2Fv0%2Fb%2Fgitbook-legacy-files%2Fo%2Fassets%252F-MKZSsJBtSP9L4sqIe_q%252F-MQC5oGiykjQLWeB50o-%252F-MQC8OlB8qkKqC9dIuiR%252Fpart-trades.png%3Falt%3Dmedia%26token%3D1933ae3a-be99-4005-ac8d-45b14e5c49d5&#x26;width=768&#x26;dpr=4&#x26;quality=100&#x26;sign=40f2e6e8&#x26;sv=1" alt=""><figcaption></figcaption></figure>

In the **Trades tab** you can see a row corresponding to the complete trade:

<figure><img src="https://docs.agenatrader.com/~gitbook/image?url=https%3A%2F%2F2805764894-files.gitbook.io%2F%7E%2Ffiles%2Fv0%2Fb%2Fgitbook-legacy-files%2Fo%2Fassets%252F-MKZSsJBtSP9L4sqIe_q%252F-MQC5oGiykjQLWeB50o-%252F-MQC8Skfr0GzdcQ8nNkn%252Fpart-trades_1.png%3Falt%3Dmedia%26token%3Daa174646-bf27-46d5-af6f-9bf4d4076af5&#x26;width=768&#x26;dpr=4&#x26;quality=100&#x26;sign=a7a57f56&#x26;sv=1" alt=""><figcaption></figcaption></figure>

The **Part trade tab** displays the first partial execution (1st part trade) and the second partial execution (2nd part trade):

* 1st part trade has a volume of 25K
* 2nd part trade has a volume of 75K (closes the trade)

<figure><img src="https://docs.agenatrader.com/~gitbook/image?url=https%3A%2F%2F2805764894-files.gitbook.io%2F%7E%2Ffiles%2Fv0%2Fb%2Fgitbook-legacy-files%2Fo%2Fassets%252F-MKZSsJBtSP9L4sqIe_q%252F-MQC5oGiykjQLWeB50o-%252F-MQC8W3WXXEzArkGqf8A%252Fpart-trades_2.png%3Falt%3Dmedia%26token%3D9538fe16-f5ae-41f7-842a-75e4a4ad8f2b&#x26;width=768&#x26;dpr=4&#x26;quality=100&#x26;sign=468a9fe3&#x26;sv=1" alt=""><figcaption></figcaption></figure>

The **Partial trade tab** columns contain the following information:

| Column              | Meaning                                                                                          |
| ------------------- | ------------------------------------------------------------------------------------------------ |
| Symbol              | The market symbol for an instrument                                                              |
| Time Frame          | Time frame in which trades are being run and managed                                             |
| Type                | Long/Short trade                                                                                 |
| Entry date and time | Date and time at which the position was opened                                                   |
| Entry price         | Price of the entry order                                                                         |
| Entry reason        | The entry strategy of current setups                                                             |
| AvgPrice            | The average price of all executed orders for an instrument                                       |
| Volume              | Volumes of the closed trades                                                                     |
| Exit date and time  | Date and time at which the partial trade was closed                                              |
| Exit price          | Price of the exit order                                                                          |
| Exit reason         | The reason for exit (target, stop)                                                               |
| Closed P\&L         | Profit/loss of the partial trade                                                                 |
| Commission          | Trading commission                                                                               |
| Account             | An account associated with the position                                                          |
| Comment             | The cell in which you can enter a comment or add a picture (double-clicking will open an Editor) |
| URL                 | Shows the path in which a snapshot of the part trade is located                                  |

With a double mouse click on splitter bar you may open chart where selected part trade was running:

<figure><img src="https://docs.agenatrader.com/~gitbook/image?url=https%3A%2F%2F2805764894-files.gitbook.io%2F%7E%2Ffiles%2Fv0%2Fb%2Fgitbook-legacy-files%2Fo%2Fassets%252F-MKZSsJBtSP9L4sqIe_q%252F-MQC5oGiykjQLWeB50o-%252F-MQC9-y1xZzgOw499BWE%252FPart%2520trades.png%3Falt%3Dmedia%26token%3D63948da4-fe51-4e6a-990a-b716faa1bd61&#x26;width=768&#x26;dpr=4&#x26;quality=100&#x26;sign=2595656d&#x26;sv=1" alt=""><figcaption></figcaption></figure>

The filter located above the partial trade list allows you to define a date and account range for which you wish to see the partial trades. The default setting is always the current trading day.

<figure><img src="https://docs.agenatrader.com/~gitbook/image?url=https%3A%2F%2F2805764894-files.gitbook.io%2F%7E%2Ffiles%2Fv0%2Fb%2Fgitbook-legacy-files%2Fo%2Fassets%252F-MKZSsJBtSP9L4sqIe_q%252F-MQC5oGiykjQLWeB50o-%252F-MQC96F3ZRjsZRDZ96Yd%252FFilter%2520%281%29.PNG%3Falt%3Dmedia%26token%3D777ed4cd-1b9a-46ce-9ac0-bdc9c25117d6&#x26;width=768&#x26;dpr=4&#x26;quality=100&#x26;sign=788bb3d4&#x26;sv=1" alt=""><figcaption></figcaption></figure>

Click the ​![Icon](https://docs.agenatrader.com/~gitbook/image?url=https%3A%2F%2F2805764894-files.gitbook.io%2F%7E%2Ffiles%2Fv0%2Fb%2Fgitbook-legacy-files%2Fo%2Fassets%252F-MKZSsJBtSP9L4sqIe_q%252F-MQC5oGiykjQLWeB50o-%252F-MQC9AM9Esty3Qqe1osH%252Ficon.PNG%3Falt%3Dmedia%26token%3D5350b023-fe4c-4bed-a0a6-01f633a6d13a\&width=300\&dpr=4\&quality=100\&sign=1c5034cd\&sv=1) button to hide the filter box.

## <img src="/files/jJ6n6sCU9RjlUCYwY0Wm" alt="" data-size="line"> Execution lists <a href="#execution-lists" id="execution-lists"></a>

All order executions are displayed in the **Execution list**.

<figure><img src="https://docs.agenatrader.com/~gitbook/image?url=https%3A%2F%2F2805764894-files.gitbook.io%2F%7E%2Ffiles%2Fv0%2Fb%2Fgitbook-legacy-files%2Fo%2Fassets%252F-MKZSsJBtSP9L4sqIe_q%252F-MQC5oGiykjQLWeB50o-%252F-MQC9DTb3iiVr4r_IPO1%252Fexecutions_list.png%3Falt%3Dmedia%26token%3Da6dabf5b-187c-4d8c-8ba3-1c0459839dee&#x26;width=768&#x26;dpr=4&#x26;quality=100&#x26;sign=37dabd39&#x26;sv=1" alt=""><figcaption></figcaption></figure>

This tab shows the following information:

| Column    | Meaning                                                                                                      |
| --------- | ------------------------------------------------------------------------------------------------------------ |
| Symbol    | The market symbol for an instrument                                                                          |
| Direction | Long or short position                                                                                       |
| Quantity  | Volume of the (partial) execution                                                                            |
| Price     | Price of the (partial) execution. The average price for orders, trades and positions is based on this price. |
| Time      | Time of the partial execution                                                                                |
| Name      | Order name                                                                                                   |
| Account   | The account associated with the position                                                                     |
| Message   | Execution message (accepted, rejected); this message depends on your broker                                  |

With a double mouse click on splitter bar you may open chart where selected execution displayed:

<figure><img src="https://docs.agenatrader.com/~gitbook/image?url=https%3A%2F%2F2805764894-files.gitbook.io%2F%7E%2Ffiles%2Fv0%2Fb%2Fgitbook-legacy-files%2Fo%2Fassets%252F-MKZSsJBtSP9L4sqIe_q%252F-MQC5oGiykjQLWeB50o-%252F-MQC9J9nkTRBHzXTVOim%252FExecution.png%3Falt%3Dmedia%26token%3D6aade38b-fb96-4d55-993f-6b025bf24f47&#x26;width=768&#x26;dpr=4&#x26;quality=100&#x26;sign=4b2df10a&#x26;sv=1" alt=""><figcaption></figcaption></figure>

## <img src="/files/exFqnO4hpEnnDqPirlR2" alt="" data-size="line"> Trading accounts <a href="#trading-accounts" id="trading-accounts"></a>

The **Account tab** shows all currently active accounts.

<figure><img src="https://docs.agenatrader.com/~gitbook/image?url=https%3A%2F%2F2805764894-files.gitbook.io%2F%7E%2Ffiles%2Fv0%2Fb%2Fgitbook-legacy-files%2Fo%2Fassets%252F-MKZSsJBtSP9L4sqIe_q%252F-MQC5oGiykjQLWeB50o-%252F-MQC9NVK2A2uhLM4AGUN%252Faccounts_list.png%3Falt%3Dmedia%26token%3Da7e84261-6d9c-478c-9e50-7c2c8db0d069&#x26;width=768&#x26;dpr=4&#x26;quality=100&#x26;sign=a084d1fc&#x26;sv=1" alt=""><figcaption></figcaption></figure>

This tab shows the following information:

| Column          | Meaning                                                                                                                                                 |
| --------------- | ------------------------------------------------------------------------------------------------------------------------------------------------------- |
| Account         | ID of the account                                                                                                                                       |
| Broker          | Broker/bank with which the account is located                                                                                                           |
| Instrument type | Instrument type traded within the account                                                                                                               |
| Currency        | The account currency                                                                                                                                    |
| Buying power    | The leverage provided by your broker. Leverage means that the account value can be increased by the broker to up to 2x, 3x of the account's cash value. |
| Cash value      | The currency amount you deposited in the account                                                                                                        |
| Excess equity   | The amount on account, which is available for openning new positions (without leverage)                                                                 |
| Realized P\&L   | Includes the profit/loss realized in that account during the current day                                                                                |

The account list does not offer any further editing possibilities.

## <img src="/files/BZfpBfJEPUi9hYI2QCvz" alt="" data-size="line"> Default Trading Accounts <a href="#default-trading-accounts" id="default-trading-accounts"></a>

*In order to open the **Default Trading Accounts** tab use one of the options:*

1. Select ***Default Trading Accounts*** by using the **Tools->Trading Information** menu.
2. left click the symbol <img src="/files/hjsdKyDCMipadNhYuJn0" alt="" data-size="line"> in the applications toolbar within the main window.

Th&#x65;***Default Trading Accounts*****&#x20;tab** shows default trading account for each connection.

<figure><img src="https://docs.agenatrader.com/~gitbook/image?url=https%3A%2F%2F2805764894-files.gitbook.io%2F%7E%2Ffiles%2Fv0%2Fb%2Fgitbook-legacy-files%2Fo%2Fassets%252F-MKZSsJBtSP9L4sqIe_q%252F-MQC5oGiykjQLWeB50o-%252F-MQC9WAenOBmmfhYCSfK%252FDefault%2520Trading.png%3Falt%3Dmedia%26token%3Dcd829d77-055a-4311-9826-e38d95af895a&#x26;width=768&#x26;dpr=4&#x26;quality=100&#x26;sign=c90541bb&#x26;sv=1" alt=""><figcaption></figcaption></figure>

| Column          | Meaning                                   |
| --------------- | ----------------------------------------- |
| Account         | ID of the account                         |
| Instrument type | Instrument type traded within the account |
| Markets         | Markets you trade on.                     |

***Default Trading Accounts*** tab does not offer any further editing possibilities.

## <img src="/files/ear8CBK0Wryqw1FjsZOf" alt="" data-size="line"> Open Orders Log <a href="#open-orders-log" id="open-orders-log"></a>

In order to open the **Order Log Tab** select the **Trading Information -> Open Orders Log** option from the **Tools.** main menu.

This tool was integrated to increase trading efficiency by enabling you to gain quick access to the proper data for ordering in case special errors occur. This enables you to view these data in the **Orders Log tab**, export them into a CSV file and send the file to us for further monitoring.

<figure><img src="https://docs.agenatrader.com/~gitbook/image?url=https%3A%2F%2F2805764894-files.gitbook.io%2F%7E%2Ffiles%2Fv0%2Fb%2Fgitbook-legacy-files%2Fo%2Fassets%252F-MKZSsJBtSP9L4sqIe_q%252F-MQC5oGiykjQLWeB50o-%252F-MQC9ZcQBBkPn8_XjEZ0%252FordersLog.png%3Falt%3Dmedia%26token%3D555f0bd0-95df-4d77-82a5-072b9de31430&#x26;width=768&#x26;dpr=4&#x26;quality=100&#x26;sign=a52418ec&#x26;sv=1" alt=""><figcaption></figcaption></figure>


# System Information

## Information tabs <a href="#information_tabs" id="information_tabs"></a>

The **Info center** contains differently positioned information tabs, which the user can arrange optimally within the workspace, if desired.

Log (protocol): contains system- and application-specific reports. Messages: contains various trading-specific information.

**Context menu of the Output, Log, Messages tab windows.**

Right clicking on the columns within each of the tabs will open the following features:

<figure><img src="https://docs.agenatrader.com/~gitbook/image?url=https%3A%2F%2F2805764894-files.gitbook.io%2F%7E%2Ffiles%2Fv0%2Fb%2Fgitbook-legacy-files%2Fo%2Fassets%252F-MKZSsJBtSP9L4sqIe_q%252F-MQC5oGiykjQLWeB50o-%252F-MQCA1iF3-OGty6qU0fV%252FinfoCenterContext.png%3Falt%3Dmedia%26token%3D1f80b35b-75e6-48f3-987f-a21756da1fed&#x26;width=768&#x26;dpr=4&#x26;quality=100&#x26;sign=d6113f5e&#x26;sv=1" alt=""><figcaption></figcaption></figure>

* Sort Ascending: sorts in ascending order
* Sort Descending: sorts in descending order
* Best Fit: adjusts the width of the selected column
* Best Fit All: adjusts the width of all columns
* Choose Columns: chooses which columns are to be shown in the tab

## <img src="/files/xbqqYntKJKvJezhadiIJ" alt="" data-size="line"> Log (protocol) <a href="#log_protocol" id="log_protocol"></a>

The **Log tab** displays all internal system messages, for example memory problems caused by opening too many charts, tabs, the scanner etc.

Log messages may be generated due to the following reasons:

* login status messages
* strategy problems
* connection issues with your broker
* memory issues
* internet connectivity problems

To resolve a particular problem without needing to close AgenaTrader there are several actions you can take, such as:

* closing applications,
* re-establishing the internet connection,
* re-establishing the connection with a broker etc.

<figure><img src="https://docs.agenatrader.com/~gitbook/image?url=https%3A%2F%2F2805764894-files.gitbook.io%2F%7E%2Ffiles%2Fv0%2Fb%2Fgitbook-legacy-files%2Fo%2Fassets%252F-MKZSsJBtSP9L4sqIe_q%252F-MQC5oGiykjQLWeB50o-%252F-MQCA5Cno2LiGypfemPr%252FlogError.png%3Falt%3Dmedia%26token%3D0f83af79-5019-47d7-a309-f2cdbc2a8bed&#x26;width=768&#x26;dpr=4&#x26;quality=100&#x26;sign=8da63471&#x26;sv=1" alt=""><figcaption></figcaption></figure>

The **Log tab** contains the following columns:

| Column      | Meaning                                         |
| ----------- | ----------------------------------------------- |
| Date & Time | Displays the time at which the message appeared |
| Source      | Displays the reason for a message               |
| Message     | Displays the text message body                  |

*Right click to open the context menu with the following two options:*

* Filter by Source: allows you to filter out or display particular reason categories for message.
* Export to MS Excel: exports messages into a CSV file.
* Clear log: allows you to delete the content of the Log tab when searching for the error and make the overview clearer.

**Example 1.** **Message: „Symbol: xxx - Because of a multi-target setup, no OCO connection can be set between the stop and targets“**

From the 1.5.6.0 version of AT++ onwards we include **OCO (One Cancels Other) orders** into strategies as long as a broker can manage OCO orders or at least provide an interface for it. Please see our homepage for more detailed information. By submitting OCO orders you are better protected against Internet service interruptions or connection problems with your broker.

Once you have placed one target within AT++ you will see the OCO connection between the target and the stop.

<figure><img src="https://docs.agenatrader.com/~gitbook/image?url=https%3A%2F%2F2805764894-files.gitbook.io%2F%7E%2Ffiles%2Fv0%2Fb%2Fgitbook-legacy-files%2Fo%2Fassets%252F-MKZSsJBtSP9L4sqIe_q%252F-MQC5oGiykjQLWeB50o-%252F-MQCAN_CdyD12YsdQNAo%252FLog_protocol1.png%3Falt%3Dmedia%26token%3D519018a6-167c-4efd-8bbe-a30426fea807&#x26;width=768&#x26;dpr=4&#x26;quality=100&#x26;sign=690e2735&#x26;sv=1" alt=""><figcaption></figcaption></figure>

However, if you enter a setup with two or three targets then as long as AgenaTrader is disconnected your broker will not know exactly which target order should trigger the stop order. For this reason your broker will submit a setup to the market without the OCO connection.

<figure><img src="https://docs.agenatrader.com/~gitbook/image?url=https%3A%2F%2F2805764894-files.gitbook.io%2F%7E%2Ffiles%2Fv0%2Fb%2Fgitbook-legacy-files%2Fo%2Fassets%252F-MKZSsJBtSP9L4sqIe_q%252F-MQC5oGiykjQLWeB50o-%252F-MQCAQf0f8otS5ig261k%252FLog_protocol2.png%3Falt%3Dmedia%26token%3D0a962e1a-1508-420c-9e9c-4d16239215fd&#x26;width=768&#x26;dpr=4&#x26;quality=100&#x26;sign=83bb1515&#x26;sv=1" alt=""><figcaption></figcaption></figure>

Should this happen, you will receive notification of this in the **Log tab**.

<figure><img src="https://docs.agenatrader.com/~gitbook/image?url=https%3A%2F%2F2805764894-files.gitbook.io%2F%7E%2Ffiles%2Fv0%2Fb%2Fgitbook-legacy-files%2Fo%2Fassets%252F-MKZSsJBtSP9L4sqIe_q%252F-MQC5oGiykjQLWeB50o-%252F-MQCAUnn52xLM1t-8NpB%252FProtocol_Log.png%3Falt%3Dmedia%26token%3Dbb657440-89c3-49df-95cd-5623b9767926&#x26;width=768&#x26;dpr=4&#x26;quality=100&#x26;sign=4960e7e&#x26;sv=1" alt=""><figcaption></figcaption></figure>

**Example 2.** **Message: „You are running strategies with the pre-market data“**

## <img src="/files/slvOqEEICgEn9F6seYXh" alt="" data-size="line"> Messages <a href="#messages" id="messages"></a>

The **Messages tab** displays messages that describe specific user-defined settings (alerts, order rejections etc.) but not errors or other messages caused by the system.

<figure><img src="https://docs.agenatrader.com/~gitbook/image?url=https%3A%2F%2F2805764894-files.gitbook.io%2F%7E%2Ffiles%2Fv0%2Fb%2Fgitbook-legacy-files%2Fo%2Fassets%252F-MKZSsJBtSP9L4sqIe_q%252F-MQC5oGiykjQLWeB50o-%252F-MQCAYLK_PYs056X43gg%252Fmessages.png%3Falt%3Dmedia%26token%3D2de62bec-5220-403e-ac52-cd76ef17b2be&#x26;width=768&#x26;dpr=4&#x26;quality=100&#x26;sign=4ca2a589&#x26;sv=1" alt=""><figcaption></figcaption></figure>

The message tab contains the following columns:

| Column      | Meaning                                         |
| ----------- | ----------------------------------------------- |
| Date & Time | Displays the time at which the message appeared |
| Source      | Displays the reason for the message             |
| Message     | Displays the text message body                  |

*Right click to open the context menu with the following two options:*

* Filter by Source: allows you to filter out or display particular reason categories for messages.
* Export to MS Excel: exports messages into a CSV file.


# Semi automated trading

What is the difference between semi-automated and fully-automated trade management?

**Fully automated trade management is based on the following principles:**

1. the system suggests a setup;
2. the system places this on the market;
3. the system manages the trade.

**Semi automated trade management is based on the following principles:**

1. the system suggests a setup;
2. *the trader decides whether to accept these suggestions or not;*
3. the system manages the trade.

Before submitting a trade, you should ask yourself the following questions:

* Does the market provide sufficient entry criteria for placing a trade?
* Can the criteria be replicated?
* What is the current trend on the market? Does the signal support the trend or is opposite to it?
* What is the overall market trend (index)? Does the signal support the overall market trend or not?
* At which price level should I place an entry?
* What is the acceptable level of risk for the trade?
* At which price level should I place a stop?
* Which currency should the instrument be traded in?
* Which currency is my account held in?
* What is the currency conversion for the risk?
* What is the current price of currency pairs for the instrument/risk calculation?
* What spread does the instrument have?
* What average slippage does the instrument have?
* Taking all of these factors into consideration, how large should the order size be?
* Is the calculated order size even or odd? (Odd lots can lead to disadvantageous price setting by the market maker and bad execution)
* Is the order size already extensive?
* Is it better to scale in a position? If yes, then how?
* Which order type should be used in the market (market, limit, stop, stop limit)?
* How can currently running trades be secured (trailing stops)?
* Where should the targets be placed in order to reach a positive ratio of chances to risks?
* How will I scale out of the position (1 to targets)?
* By what order size proportion will the positions be reduced when scaling out?
* What is the impact on the trading account?
* How many long/short positions are going to be held?
* What will be my actions in the case of a crash? Are my positions market-neutral?

These are just some questions that should be answered by the trader, especially when dealing will smaller time frames such as 1 minute or 5 minutes. When using full automatism, this is no longer necessary because the system performs all trades automatically. Nevertheless, the human perspective has many advantages over automation. For example, many complex patterns/confluences can be better perceived visually and therefore more clearly interpreted. Semi-automatism will allow you to combine the best of both worlds.


# AgenaTrader++ (plusplus) – Automated Setup & Recovery Management

## General information <a href="#general-information" id="general-information"></a>

AgenaTrader++ plusplus represents the more advanced versions of AgenaTrader with innovative features for professional trading. This includes semi-automatic setup and trade management components, integrated risk and money management with automatic order sizing, signal scanner and other functions.

## Trading with AgenaTrader++ (plusplus) <a href="#trading-with-agenatrader-plusplus" id="trading-with-agenatrader-plusplus"></a>

When AgenaTrader++ (plusplus) is activated within a list chart group, the following popup will appear:

<figure><img src="https://docs.agenatrader.com/~gitbook/image?url=https%3A%2F%2F2805764894-files.gitbook.io%2F%7E%2Ffiles%2Fv0%2Fb%2Fgitbook-legacy-files%2Fo%2Fassets%252F-MKZSsJBtSP9L4sqIe_q%252F-MQwaBAfMfkSUH6IVZlQ%252F-MQwdVZ0moAISyPclHMH%252FAT%252B%252B.png%3Falt%3Dmedia%26token%3D09fb755e-3719-4fea-b807-a93d253c994b&#x26;width=768&#x26;dpr=4&#x26;quality=100&#x26;sign=22bf41b5&#x26;sv=1" alt=""><figcaption></figcaption></figure>

You will be asked whether you wants to start the AT++ for the current instrument, for several selected instruments from the list or for the whole List Chart Group.

## **Important points concerning the AgenaTrader ++ (plusplus) setup**: <a href="#important-points-concerning-the-agenatrader--plusplus-setup" id="important-points-concerning-the-agenatrader--plusplus-setup"></a>

1. If AT++ (plusplus) is already running for an instrument within a specified time frame (e.g. 5 min.) and you activate AT++ within another time frame (e.g. 10 min.), then the time settings for the strategy will be changed according to the time frame opened most recently (10 min. in this case). This ensures that the strategy and the submitted trade are active within the same time frame.
2. If a trade for a specific instrument is already running within a particular time frame, then starting a strategy in a different time frame will be denied.
3. If AgenaTrader++ (plusplus) is started within the chart, then the interval in brackets will show the time frame for a strategy. Thus, you will be able to identify which time frame the stop point will be adjusted to (5 min. in this case).

<figure><img src="https://docs.agenatrader.com/~gitbook/image?url=https%3A%2F%2F2805764894-files.gitbook.io%2F%7E%2Ffiles%2Fv0%2Fb%2Fgitbook-legacy-files%2Fo%2Fassets%252F-MKZSsJBtSP9L4sqIe_q%252F-MQwaBAfMfkSUH6IVZlQ%252F-MQwd_zVJ6BSnYFVR5s0%252FATplus.jpg%3Falt%3Dmedia%26token%3D35f2a338-65a0-4c45-a6b9-8a3050a04390&#x26;width=768&#x26;dpr=4&#x26;quality=100&#x26;sign=851ab9d9&#x26;sv=1" alt=""><figcaption></figcaption></figure>

## AgenaTrader++ (plusplus) Resolve Setup <a href="#agenatrader-plusplus-resolve-setup" id="agenatrader-plusplus-resolve-setup"></a>

This is one of the essential tools in AT++.

#### **AgenaTrader++ (plusplus) resolve setup works in the following manner:** <a href="#agenatrader-plusplus-resolve-setup-works-in-the-following-manner" id="agenatrader-plusplus-resolve-setup-works-in-the-following-manner"></a>

* If you have submitted and confirmed orders, AgenaTrader++ strategies will continue to run even when the trading platform is closed.
* These strategies will be saved within the system.
* When you start AgenaTrader up again, the strategies will be adjusted to the current market conditions.

If you plan to keep an intraday trade with the AT++ setup overnight, we recommend that you do not turn off AgenaTrader since this can lead to unexpected order behavior. For example, order groups managed by AgenaTrader, such as IfDone and OCO, are often not linked to your broker due to the fact that the majority of brokers do not support these special types of orders. Only having AT opened ensures that all setups and functionalities will remain unchangeable.

If something happens during the time in which AgenaTrader is closed (e.g. filled or cancelled orders, closed trades etc.), stops will be recalculated and positions/setups will be adjusted etc. Obviously, this can be dangerous.

Should this occur, you will receive a recovery popup (see image below) displaying the trades which require your intervention and supervision:

<figure><img src="https://docs.agenatrader.com/~gitbook/image?url=https%3A%2F%2F2805764894-files.gitbook.io%2F%7E%2Ffiles%2Fv0%2Fb%2Fgitbook-legacy-files%2Fo%2Fassets%252F-MKZSsJBtSP9L4sqIe_q%252F-MQwaBAfMfkSUH6IVZlQ%252F-MQwdeacTfyZNep_sQEJ%252Fresolve.jpg%3Falt%3Dmedia%26token%3Dd22b43f2-41f4-4b7f-a58a-b91b358c3da8&#x26;width=768&#x26;dpr=4&#x26;quality=100&#x26;sign=bcae0f90&#x26;sv=1" alt=""><figcaption></figcaption></figure>

*Functions of the buttons in the recovery popup:*

* The **Entry Escort** button allows you to enter the strategy. **NOTE:** the **Trades tab** will display the entry reason.
* The button **Session** allows user to select **analyzer** session
* The **Confirm** button applies the suggested actions.
* Chart area provides you access to all chart function. Details on section [**Chart Toolbar**](https://docs.agenatrader.com/main/chart-area/untitled)

If you close the popup without confirmation or get InconsstantState in column Action, you will have to clear the trades manually.


# AT (plusplus) Manager

In this section you may set settings for semi-automatic setups, trade management components, integrated risk and money management with automatic order sizing, signal scanner, and other functions.

* **AT (Plus Plus) General** - General AT ++ settings
* **AT (Plus Plus) Entries** - Entry Escort settings
* **AT (Plus PLus) Stops** - Stop Escort settings
* **AT (Plus PLus) Targets** - Target Escort settings
* **AT (Plus Plus): Order Rounding** - Set general settings related to order size and risk management.
* **AT (Plus Plus): Risk Management** - Define risk parameters settings for each account and asset type.
* [**Setup Builder**](https://docs.agenatrader.com/create-your-own-trading-strategy/setup-escort) - Here You can define, activate and deactivate fully functional trading setups.
* [**Signal Builder**](https://docs.agenatrader.com/create-your-own-trading-strategy/condition-escort) - Here You can create complex scans for trading signals.

<figure><img src="https://docs.agenatrader.com/~gitbook/image?url=https%3A%2F%2F2805764894-files.gitbook.io%2F%7E%2Ffiles%2Fv0%2Fb%2Fgitbook-legacy-files%2Fo%2Fassets%252F-MKZSsJBtSP9L4sqIe_q%252F-MQHT0WI94AtFFksEfNI%252F-MQHVlq5Bh-HTqNIoQou%252Fat%2520plus%2520%28en%29.png%3Falt%3Dmedia%26token%3D388f8d64-1325-450d-be72-ed4934c7fa33&#x26;width=768&#x26;dpr=4&#x26;quality=100&#x26;sign=b41a97d9&#x26;sv=1" alt=""><figcaption></figcaption></figure>

## General <a href="#at-plus-plus-general" id="at-plus-plus-general"></a>

General AT++ settings:

<figure><img src="https://docs.agenatrader.com/~gitbook/image?url=https%3A%2F%2F2805764894-files.gitbook.io%2F%7E%2Ffiles%2Fv0%2Fb%2Fgitbook-legacy-files%2Fo%2Fassets%252F-MKZSsJBtSP9L4sqIe_q%252F-MQHT0WI94AtFFksEfNI%252F-MQHVqbmmS2xijB2aqYh%252FAT%252B%252BGeneral.png%3Falt%3Dmedia%26token%3D78bac560-c23c-49ce-94c6-c3d8e041643f&#x26;width=768&#x26;dpr=4&#x26;quality=100&#x26;sign=983e38d6&#x26;sv=1" alt=""><figcaption></figcaption></figure>

| Name                                 | Meaning                                                                                                                                                                                       |
| ------------------------------------ | --------------------------------------------------------------------------------------------------------------------------------------------------------------------------------------------- |
| Clean AT++ Proposal on symbol change | If activated, proposal orders will be deleted after symbol (Instrument) change. If not selected proposal orders will not be deleted and stay in the chart until they were cancelled manually. |
| Recover AT++ in any case             | If activated, active strategies are saved, even if they do not have active trades or orders.                                                                                                  |
| Keep Strategy running on Flat        | When activated AT++ will remain active in the chart even when the position was closed.                                                                                                        |

## Entries <a href="#at-plus-plus-entries" id="at-plus-plus-entries"></a>

The AgenaTrader++ plusplus entries category allows you to edit the general [Entry Escorts](https://docs.agenatrader.com/create-your-own-trading-strategy/setup-escort#entryescorts-1) settings.

<figure><img src="https://docs.agenatrader.com/~gitbook/image?url=https%3A%2F%2F2805764894-files.gitbook.io%2F%7E%2Ffiles%2Fv0%2Fb%2Fgitbook-legacy-files%2Fo%2Fassets%252F-MKZSsJBtSP9L4sqIe_q%252F-MQHT0WI94AtFFksEfNI%252F-MQHVv2KHlP6IOFFB0A3%252FConfig-AT%252BEntries.png%3Falt%3Dmedia%26token%3D684b1880-5106-47bf-8c8b-964b714ed1dc&#x26;width=768&#x26;dpr=4&#x26;quality=100&#x26;sign=3c3662df&#x26;sv=1" alt=""><figcaption></figcaption></figure>

| Setting                               | Meaning                                                                                                                                                                                                                                                                                                                                                                                                                                                                                                                                                           |
| ------------------------------------- | ----------------------------------------------------------------------------------------------------------------------------------------------------------------------------------------------------------------------------------------------------------------------------------------------------------------------------------------------------------------------------------------------------------------------------------------------------------------------------------------------------------------------------------------------------------------- |
| Fixed Tick Distance                   | Sets distance in ticks from the calculated entry price to the actual order. Calculated entry prices are usually highs/lows of the periods. To avoid spoofing at these points the order will be placed n ticks away from the entry price.                                                                                                                                                                                                                                                                                                                          |
| Distance on ATR                       | Allows you to smooth distances in tick size e.g. between cheap stocks and Futures or Forex. As a result, a tick calculation will be performed based on the ATR(20).                                                                                                                                                                                                                                                                                                                                                                                               |
| Distance ATR Factor                   | Refers to the ATR factor used for the size calculation based on the ATR. 0.10 means that the distance in ticks will be set to 1/10th of the current ATR value. If a value is also entered in the **Fixed Tick Distance** cell, the distance will be measured based on the maximum of both values.                                                                                                                                                                                                                                                                 |
| Synthetic-Orders on MinStop Distance  | Allows you to place synthetic orders on the market. By enabling this you avoid problems with CFD brokers (e.g.: FXCM / XTB) if you are not able to place the entry as close in the market as you would like due to restrictions on the broker's pages.                                                                                                                                                                                                                                                                                                            |
| Auto Cancel invalid Orders            | Automatically removes the order at the end of the period if a candlestick breaches the initial stop and the entry order is not executed. The order will also be deleted if the validity note after n periods passes and the order is not executed. You will receive the following information in the Protocol tab: "Due to your settings in the Global Configuration/Entries/AutoCancelOrder, the order for instrument "xxx" was canceled". If you enter "0" for the option "Check validity of order after N Bars" then this functionality will not be activated. |
| Recalculate Order Size on Entry Order | If the order bar of the entry order is moved after it was created the order size is recalculated if necessary.                                                                                                                                                                                                                                                                                                                                                                                                                                                    |
| Show Counter Signals                  | Informs you of counter signals while your trade is running (functionality of AgenaTrader++). For example, if you are positioned long with the JoJo signal, then you will be informed of counter signals (not only for JoJo but also RubberBand etc.) in the message box in the Order Escort via the blinking status bar of the AgenaTrader.                                                                                                                                                                                                                       |
| Show Initial Risk Violation Popup     | If activated the "Initial Risk Violation Popup" will appear when the initial risk was increased.                                                                                                                                                                                                                                                                                                                                                                                                                                                                  |
| Throw strategy alerts                 | If active, the AT++ strategy will send email and mobile notification every time signal appears.                                                                                                                                                                                                                                                                                                                                                                                                                                                                   |
| Check Validity of Order after N Bars  | Displays number of bars (n) after which you will receive a note in the log tab if the entry order has not been executed or if the initial stop has been breached. If you enter “0” then you will not receive these notes. **Please note!** Proposal Orders will be automatically deleted if the close price (=periods end) breaches the stop price.                                                                                                                                                                                                               |

## Stops <a href="#at-plus-plus-stops" id="at-plus-plus-stops"></a>

The AgenaTrader++ plusplus entries tab allows you to edit the general [Stop Escort](https://docs.agenatrader.com/create-your-own-trading-strategy/setup-escort#stopescort) settings.

<figure><img src="https://docs.agenatrader.com/~gitbook/image?url=https%3A%2F%2F2805764894-files.gitbook.io%2F%7E%2Ffiles%2Fv0%2Fb%2Fgitbook-legacy-files%2Fo%2Fassets%252F-MKZSsJBtSP9L4sqIe_q%252F-MQHT0WI94AtFFksEfNI%252F-MQHVzq0JWJ9RF73xnnw%252FConfig-AT%252BStops.png%3Falt%3Dmedia%26token%3Dd77d1a9e-f69e-4e60-be0d-da6e8daa5650&#x26;width=768&#x26;dpr=4&#x26;quality=100&#x26;sign=2ee059fa&#x26;sv=1" alt=""><figcaption></figcaption></figure>

| Function                            | Meaning                                                                                                                                                                                                                                                                                                                             |
| ----------------------------------- | ----------------------------------------------------------------------------------------------------------------------------------------------------------------------------------------------------------------------------------------------------------------------------------------------------------------------------------- |
| Fixed Tick Distance                 | Sets distance in ticks from the calculated stop price to the actual order. Calculated stop prices are usually highs/lows of the periods. To avoid spoofing at these points the order will be placed n ticks away from the entry price.                                                                                              |
| Distance ATR Factor                 | Refers to the ATR factor used for the size calculation based on the ATR. 0.10 means that the distance in ticks will be set to 1/10th of the current ATR value. If a value is also entered in the **Fixed Tick Distance** cell, the distance will be measured based on the maximum of both values.                                   |
| Distance on ATR                     | Allows you to smooth distances in tick size e.g. between cheap stocks and Futures or Forex. As a result, a tick calculation will be performed based on the ATR(20).                                                                                                                                                                 |
| Synthetic-Order on MinStop Distance | Allows you to place [Synthetic orders](https://docs.agenatrader.com/main/chart-area/order-escort#Synthetic_orders) on the market. By enabling this you avoid problems with CFD brokers (e.g.: FXCM / XTB) if you are not able to place the stop as close in the market as you would like due to restrictions on the broker's pages. |

## Targets <a href="#at-plus-plus-targets" id="at-plus-plus-targets"></a>

The AgenaTrader++ plusplus targets allows you to edit the general [Target Escort](https://docs.agenatrader.com/create-your-own-trading-strategy/setup-escort#targetescorts) settings.

<figure><img src="https://docs.agenatrader.com/~gitbook/image?url=https%3A%2F%2F2805764894-files.gitbook.io%2F%7E%2Ffiles%2Fv0%2Fb%2Fgitbook-legacy-files%2Fo%2Fassets%252F-MKZSsJBtSP9L4sqIe_q%252F-MQHT0WI94AtFFksEfNI%252F-MQHW2LJ5ce-cFr2FaxG%252FConfig-AT%252BTargets.png%3Falt%3Dmedia%26token%3Daf10e749-86af-475e-b28e-433bfd84bf8d&#x26;width=768&#x26;dpr=4&#x26;quality=100&#x26;sign=2adbc36b&#x26;sv=1" alt=""><figcaption></figcaption></figure>

| Function            | Meaning                                                                                                                                                                                                                                                                                           |
| ------------------- | ------------------------------------------------------------------------------------------------------------------------------------------------------------------------------------------------------------------------------------------------------------------------------------------------- |
| Fixed Tick Distance | Sets distance in ticks from the calculated target price to the actual order. Calculated target prices are usually highs/lows of the periods. To avoid spoofing at these points the order will be placed n ticks away from the entry price.                                                        |
| Distance on ATR     | Allows you to smooth distances in tick size e.g. between cheap stocks and Futures or Forex. As a result, a tick calculation will be performed based on the ATR(20).                                                                                                                               |
| Distance ATR Factor | Refers to the ATR factor used for the size calculation based on the ATR. 0.10 means that the distance in ticks will be set to 1/10th of the current ATR value. If a value is also entered in the **Fixed Tick Distance** cell, the distance will be measured based on the maximum of both values. |

## Order Rounding <a href="#at-plus-plus-order-rounding" id="at-plus-plus-order-rounding"></a>

The **Order Rounding category** allows you to enter general settings related to order size and risk management.

<figure><img src="https://docs.agenatrader.com/~gitbook/image?url=https%3A%2F%2F2805764894-files.gitbook.io%2F%7E%2Ffiles%2Fv0%2Fb%2Fgitbook-legacy-files%2Fo%2Fassets%252F-MKZSsJBtSP9L4sqIe_q%252F-MQHT0WI94AtFFksEfNI%252F-MQHW6QQmAjtGcIAQQVm%252Forder%2520rounding.png%3Falt%3Dmedia%26token%3D8879475a-7c0f-4d6a-a3cc-bc5b2477dec4&#x26;width=768&#x26;dpr=4&#x26;quality=100&#x26;sign=20162c1f&#x26;sv=1" alt=""><figcaption></figcaption></figure>

| Block: Order Rounding Criteria |                                                                                                                                                                                                                                                                                                                                                                                                                                                                                                                                                                                                                                                                                                                                                                                                                                                                                                                                                                                                                                                                                                                                                                                                                                                                                                           |
| ------------------------------ | --------------------------------------------------------------------------------------------------------------------------------------------------------------------------------------------------------------------------------------------------------------------------------------------------------------------------------------------------------------------------------------------------------------------------------------------------------------------------------------------------------------------------------------------------------------------------------------------------------------------------------------------------------------------------------------------------------------------------------------------------------------------------------------------------------------------------------------------------------------------------------------------------------------------------------------------------------------------------------------------------------------------------------------------------------------------------------------------------------------------------------------------------------------------------------------------------------------------------------------------------------------------------------------------------------- |
| Round Order Size to            | Sets the next valid value to which an order size can be rounded. Basic calculations of position size determine odd-lots, i.e. lots that are not evenly divisible (for example, 100 Stocks, 10000 currency units etc.). It is recommended to round them to the tick size value for better execution. **The illustrated example above is to be interpreted in the following way:** If the calculated order size is smaller than 300, then it will be rounded to the nearest 20. If the order size is above 300, then AgenaTrader will round to the nearest 100. Thus, 277 is rounded to 280 and 323 is rounded to 300, whereas 365 is rounded to 400. It may occur that the predefined risk per trade is slightly exceeded. This will be displayed by a red background in the Hard/SoftRisk fields within the [Order Escort](https://docs.agenatrader.com/main/chart-area/order-escort). ![ConfigEscort Hard SoftRisk](https://docs.agenatrader.com/~gitbook/image?url=https%3A%2F%2F2805764894-files.gitbook.io%2F%7E%2Ffiles%2Fv0%2Fb%2Fgitbook-legacy-files%2Fo%2Fassets%252F-MKZSsJBtSP9L4sqIe_q%252F-MQHT0WI94AtFFksEfNI%252F-MQHW9OPIPuG6ctehJDs%252FconfigEscort_Hard_SoftRisk.png%3Falt%3Dmedia%26token%3D1686dc88-a4f2-4a89-900c-eb265293cf8a\&width=300\&dpr=4\&quality=100\&sign=3c307762\&sv=1) |
| Switch off Risk Management     | Deactivates the risk management for the particular asset class. See the [account settings](https://docs.agenatrader.com/main/chart-area/order-escort#Order_Escort__Account) for more information. In this case only the default order size will be used.                                                                                                                                                                                                                                                                                                                                                                                                                                                                                                                                                                                                                                                                                                                                                                                                                                                                                                                                                                                                                                                  |

## Risk Management <a href="#at-plus-plus-risk-management" id="at-plus-plus-risk-management"></a>

This feature allows you to adjust settings related not only to the replay/simulation account but also to the AgenaTrader++ versions.

The risk parameters can be created for each account and asset type (Stocks, Futures, Indexes, CFD's, Currency and Options) separately. For each broker account available only asset type it supports.

<figure><img src="https://docs.agenatrader.com/~gitbook/image?url=https%3A%2F%2F2805764894-files.gitbook.io%2F%7E%2Ffiles%2Fv0%2Fb%2Fgitbook-legacy-files%2Fo%2Fassets%252F-MKZSsJBtSP9L4sqIe_q%252F-MQHT0WI94AtFFksEfNI%252F-MQHWCo86Re-QmHBTlj7%252FRiskManagement.png%3Falt%3Dmedia%26token%3D04b625ab-47bc-4c61-9be9-5ee78947ce61&#x26;width=768&#x26;dpr=4&#x26;quality=100&#x26;sign=66b88a0&#x26;sv=1" alt=""><figcaption></figcaption></figure>

| Block: Risk criteria                       | Meaning                                                                                                                                                                                                                                                                                                                                                                                                                                                                                                                                                                                                                                                                                                                                                                                                                                                                                                                                                                                                                                                                                                                                                                                                                            |
| ------------------------------------------ | ---------------------------------------------------------------------------------------------------------------------------------------------------------------------------------------------------------------------------------------------------------------------------------------------------------------------------------------------------------------------------------------------------------------------------------------------------------------------------------------------------------------------------------------------------------------------------------------------------------------------------------------------------------------------------------------------------------------------------------------------------------------------------------------------------------------------------------------------------------------------------------------------------------------------------------------------------------------------------------------------------------------------------------------------------------------------------------------------------------------------------------------------------------------------------------------------------------------------------------- |
| Risk Management Off                        | Deactivates the risk management for the particular asset type (stocks/EFTs, Forex, Futures). Moreover, the default size defined in the **Global Configuration** will be used for managing orders instead of the order size of all AgenaTrader++ orders. You can also assign the default order size to an individual instrument using the [Instrument Editor](https://docs.agenatrader.com/tools/instrument-escort). Furthermore, you have the possibility to activate the risk management for an account excluding certain asset types (stocks/EFTs, Forex, Futures). If, for example, you select the **Risk/trade** option for the MB trading account and check the **Switch Off Risk Management** checkbox in the [Futures tab](https://docs.agenatrader.com/tools/configuration-escort#discretionary-trading), the order size calculation for stocks and Forex will be based on the percentage of risk but for futures it will be based on the default order size. **Warning!** If the default order size is used for the order size calculation e.g. for Forex instruments, AgenaTrader will use the underlying base currency instead of the AgenaTrader++ PL currency, which can be adjusted in the **Global Configuration**. |
| Risk/Trade %                               | The percentage of an account / capital that you are prepared to place at risk during the trading. The order size calculation is based on the gap between the entry and stop order, the valuation of the instrument, the instrument / account currency pairs and the buying power. If this option is selected, the risk will remain the same but the order amount will vary. This method offers a reasonable order size setting when using a combination of equities and leveraged products (Forex, Futures, etc.).                                                                                                                                                                                                                                                                                                                                                                                                                                                                                                                                                                                                                                                                                                                 |
| Risk Amount                                | Sets the absolute value of the P\&L currency that you are prepared to risk per trade. The order size is adjusted to this amount.                                                                                                                                                                                                                                                                                                                                                                                                                                                                                                                                                                                                                                                                                                                                                                                                                                                                                                                                                                                                                                                                                                   |
| **Note:** Risk/Trade and Risk/Trade Amount | Slippage and spread will be taken into account in the order size calculation as well. The slippage is evaluated based on the spread, so that you effectively use the spread twice. This value increases the difference between entry and stop, based on which the position size (after the conversion of the PL currency) is then calculated.                                                                                                                                                                                                                                                                                                                                                                                                                                                                                                                                                                                                                                                                                                                                                                                                                                                                                      |
| Fixed Amount                               | Available only for Currencies and Stocks. There you can define for what amount you can place order size. For example, user set Fixed amount to 3000 EUR. If he place setup on EURUSD instrument it's order size will be 3000.                                                                                                                                                                                                                                                                                                                                                                                                                                                                                                                                                                                                                                                                                                                                                                                                                                                                                                                                                                                                      |
| Max. Invested %                            | If the **Risk/Trade** or **Risk/Trade Amount** options are selected, you can define the maximum amount of buying power to be invested in the trade by setting the **Max. invested %**. This may result in a decreasing of the **Risk / trade** and **Risk / trade amount**.                                                                                                                                                                                                                                                                                                                                                                                                                                                                                                                                                                                                                                                                                                                                                                                                                                                                                                                                                        |

| Block: Account criteria | Meaning                                                                                       |
| ----------------------- | --------------------------------------------------------------------------------------------- |
| Trading Free Period     | During this time no trades will be executed and active trades will be closed.                 |
| Daily Loss Limit        | Sets the maximum amount of loss allowed for trades per day on one account (in P\&L currency). |

{% hint style="info" %}
**Important!** Please find details on page [AT (Plus Plus): Risk Management](https://docs.agenatrader.com/create-your-own-trading-strategy/at-plusplus-manager#at-plus-plus-risk-management)
{% endhint %}


# Setup Builder

## <img src="/files/o057RyoNJYPlRj2IEuJh" alt="" data-size="line"> Setup Builder

Semi-automatism means that trade entries can occur either:

* based on a signal in a semi-automated environment or
* discretionarily.

Although you control the most important stages, the management of the trade can be left to AgenaTrader.

To benefit from fully functional setups, which thanks to their detected specific behavior will allow you to employ the most efficient stop and targets methodology, you should attempt to find replicable systematic approaches.

You can define, activate and deactivate fully functional setups via the **Setup Builder**.

**The Setup Builder consists of:**

1. **Analyzer session** management
2. **Activation tab**: allows you to activate and deactivate entries, stop and target methods
3. **Configuration tab**: allows you to create fully functional trade setups
4. **Parameter tab**: modifies various entry, stop and target methods
5. Hist. Periods AnalyserEscort and Hist. Periods HedgeEscort: these define the number of historical periods for which the signal should be displayed within the Analyzer Column column or the signals tab in the Hedge Escort. The number of periods that have passed since the signal was generated will be displayed in the brackets (\[]). The setup will not be suggested when you click on the row, but you can still place a discretionary entry. Even if you place a trade discretionarily, the trade management will still perform its functions.

<figure><img src="https://docs.agenatrader.com/~gitbook/image?url=https%3A%2F%2F2805764894-files.gitbook.io%2F%7E%2Ffiles%2Fv0%2Fb%2Fgitbook-legacy-files%2Fo%2Fassets%252F-MKZSsJBtSP9L4sqIe_q%252F-MQkex8D1n6xxtVa0DJS%252F-MQldAMv2YkXX7XuqVmL%252Factivation.png%3Falt%3Dmedia%26token%3Ddf5283c2-b86e-47a1-b84e-a1145144ec1a&#x26;width=768&#x26;dpr=4&#x26;quality=100&#x26;sign=454a3d42&#x26;sv=1" alt=""><figcaption></figcaption></figure>

The following image shows the StopSell order suggested by the SetupBuilder (AgenaTrader++) (the three green lines are [IfDone orders](https://docs.agenatrader.com/main/chart-area/untitled/chart-context-menu#ifdone-orders)):

<figure><img src="https://docs.agenatrader.com/~gitbook/image?url=https%3A%2F%2F2805764894-files.gitbook.io%2F%7E%2Ffiles%2Fv0%2Fb%2Fgitbook-legacy-files%2Fo%2Fassets%252F-MKZSsJBtSP9L4sqIe_q%252F-MQkex8D1n6xxtVa0DJS%252F-MQldF16KUXgKyRA_Ky2%252FSetup%2520Escort.jpg%3Falt%3Dmedia%26token%3D5c55bb23-3885-4713-8e75-f0f64f151f06&#x26;width=768&#x26;dpr=4&#x26;quality=100&#x26;sign=75572529&#x26;sv=1" alt=""><figcaption></figcaption></figure>

*AgenaTrader offers you several possibilities of manually managing the trade:*

* When the **Setup Builder** strategy is running, you can increase the position. The stop and targets will automatically be adjusted to the new position size.
* You can also start a setup without targets and add them later. To do this, right click on the chart and select Sell/Buy Limit. This automatically activates an AgenaTrader++ setup.
* The same principle can be applied to adding additional entries.

Warning! We strongly recommend not to add discretionary orders to AT++ setup and connect them OCO,ORO, IFdone connections. In another case you will get the warning on a chart **"Manual changes of the strategy might cause unexpected behavior and are at you own risk"**. In addition, you will get such message in the log: **"ATTENTION: You are about entering a manual order into a strategy. This might cause unexpected reactions and you take full responsibility for any misbehavior in case this order gets activated. You accept that the AgenaTrader-Support can't give you any advices or help on any misbehavior."**

## Analyzer Column <a href="#analyzer-column-column" id="analyzer-column-column"></a>

The **Analyzer Column** is a column that searches for signals for hundreds of instruments simultaneously. Once signals that have occurred meet the requirements of predefined parameters within the **Setup Builder**, the **Analyzer Column** will display them in the corresponding column.

If you make changes to the **Entry Escorts list** within the **Activation tab** of the **Setup Builder**, the scanner must be reloaded for the LCG or watch list.

*The Analyzer Column column is a part of the* [*scanner*](https://docs.agenatrader.com/main/chart-area/realtime-scanner) *and can be activated by adding the column in the:*

* Watchlist ([Main -> New -> Watch](https://docs.agenatrader.com/main/main-menu/watch-lists)) or
* List chart group ([Main -> New -> Chart container -> List chart group](https://docs.agenatrader.com/main/chart-area/chart-container/chart-container#Chart_Container__List_Chart_Group)).

The image below shows how the Analyzer Column column can be defined using the [Column editor for the scanner](https://docs.agenatrader.com/main/chart-area/realtime-scanner/scanner-settings#edit-columns):

<figure><img src="https://docs.agenatrader.com/~gitbook/image?url=https%3A%2F%2F2805764894-files.gitbook.io%2F%7E%2Ffiles%2Fv0%2Fb%2Fgitbook-legacy-files%2Fo%2Fassets%252F-MKZSsJBtSP9L4sqIe_q%252F-MQkex8D1n6xxtVa0DJS%252F-MQldd-OvlKji9o_n8Ck%252FAnalyzerEscort.png%3Falt%3Dmedia%26token%3D206866e8-8a09-43a3-914a-814cca37ccb7&#x26;width=768&#x26;dpr=4&#x26;quality=100&#x26;sign=d181b934&#x26;sv=1" alt=""><figcaption></figcaption></figure>

When defining the Analyzer Column parameters:

* Input the time frame in which signals should be scanned for;
* If you have several AnalyzerColumn columns within the scanner, we recommend that you change the header text so that the signals and the corresponding time frame can be recognized immediately.
* **Signal Direction:** Allows to set short or long signal direction. None parameter means that Analyzer Column column would display both direction signals.
* **Required bars count**: In order to make a condition to be properly recognized inside the Scanner and also in the chart (when this condition is used as an indicator), the parameter Bars required has to be set to the same value in chart and in the scanner.

The image below demonstrates how the Analyzer Column column looks within the scanner once applied to the chart:

<figure><img src="https://docs.agenatrader.com/~gitbook/image?url=https%3A%2F%2F2805764894-files.gitbook.io%2F%7E%2Ffiles%2Fv0%2Fb%2Fgitbook-legacy-files%2Fo%2Fassets%252F-MKZSsJBtSP9L4sqIe_q%252F-MQkex8D1n6xxtVa0DJS%252F-MQldiiVBMmCHPjwFUvG%252Fscanner.png%3Falt%3Dmedia%26token%3D377fdbbd-b62c-4626-8a15-85c26b3a967d&#x26;width=768&#x26;dpr=4&#x26;quality=100&#x26;sign=844747de&#x26;sv=1" alt=""><figcaption></figcaption></figure>

The Analyzer Column (AC) columns may have different colors:

| Color                   | Meaning                                                                                       |
| ----------------------- | --------------------------------------------------------------------------------------------- |
| Green                   | Indicates active long signal                                                                  |
| Light green             | Indicates past long signal                                                                    |
| Red                     | Indicates active short signal                                                                 |
| Light red               | Indicates past short signal                                                                   |
| Yellow or white         | Indicates that an instrument has already been scanned based on a newly occurred candle.       |
| Bluish green/light blue | Indicates insufficient historical data for estimation.                                        |
| Pink                    | Indicates that the exchange is closed, and scanning will recommence once exchange opens again |

There is a posibilitty to change color for each signal in Signal Builder:

<figure><img src="https://docs.agenatrader.com/~gitbook/image?url=https%3A%2F%2F2805764894-files.gitbook.io%2F%7E%2Ffiles%2Fv0%2Fb%2Fgitbook-legacy-files%2Fo%2Fassets%252F-MKZSsJBtSP9L4sqIe_q%252F-MQkex8D1n6xxtVa0DJS%252F-MQle1cF1SSwrUM1rl0L%252FCondition.png%3Falt%3Dmedia%26token%3D7f845010-b735-46f2-bb71-f0fb583086f6&#x26;width=768&#x26;dpr=4&#x26;quality=100&#x26;sign=6866b02&#x26;sv=1" alt=""><figcaption></figcaption></figure>

**Historical signals are handled as follows!**

In that case past signal would be displayed with color transparency 122 (out of 255).

The signals that should be scanned for within the Analyzer Column must be activated in the [**Setup Builder**](https://docs.agenatrader.com/create-your-own-trading-strategy/setup-escort) (**Activation tab**) and configured (**Configuration tab**).

Furthermore, you can also set individual parameters (see image):

<figure><img src="https://docs.agenatrader.com/~gitbook/image?url=https%3A%2F%2F2805764894-files.gitbook.io%2F%7E%2Ffiles%2Fv0%2Fb%2Fgitbook-legacy-files%2Fo%2Fassets%252F-MKZSsJBtSP9L4sqIe_q%252F-MQkex8D1n6xxtVa0DJS%252F-MQle8eBm-H9n56JaXS7%252FSetup%2520Escort.PNG%3Falt%3Dmedia%26token%3D5a249a52-0bd2-444c-9c2e-9843b9e56514&#x26;width=768&#x26;dpr=4&#x26;quality=100&#x26;sign=c40294fc&#x26;sv=1" alt=""><figcaption></figcaption></figure>

**Signals with numbers in \[] brackets**

<figure><img src="https://docs.agenatrader.com/~gitbook/image?url=https%3A%2F%2F2805764894-files.gitbook.io%2F%7E%2Ffiles%2Fv0%2Fb%2Fgitbook-legacy-files%2Fo%2Fassets%252F-MKZSsJBtSP9L4sqIe_q%252F-MQkex8D1n6xxtVa0DJS%252F-MQleCx4YP1FFCgoQ072%252FAnalyzerEscort_NumberInBrackets.png%3Falt%3Dmedia%26token%3D508033f8-6b7f-47a8-92fe-92cb5ec87cbc&#x26;width=768&#x26;dpr=4&#x26;quality=100&#x26;sign=5d5695fa&#x26;sv=1" alt=""><figcaption></figcaption></figure>

If you see a number in brackets then the signal has occurred in the past. The brackets show how many periods ago the signal occurred.

Please find further information about this in the [**Setup Builder: Activation tab**](https://docs.agenatrader.com/create-your-own-trading-strategy/setup-escort#Setup_Escort__Activation_tab) section.

**Signal accumulation** When several signals occur for the same instrument in the scanner then it is possible to view them by opening the drop-down list.

### AnalyzerColumn and List chart group <a href="#analyzercolumn-and-list-chart-group" id="analyzercolumn-and-list-chart-group"></a>

**If a signal for a** [**list chart group**](https://docs.agenatrader.com/main/chart-area/chart-container/chart-container#Chart_Container__List_Chart_Group) **is generated within the scanner you can submit the suggested setup to the market via:**

* double-clicking the signal if AT++ is not activated, which will place a suggested setup to the chart and simultaneously activate AgenaTrader++;
* left clicking the signal if AT++ is activated.

The suggested setup is calculated according to the predefined parameters in the Setup Builder.

If you confirm the entry order and open a trade, AgenaTrader++ remains active and will manage the setup in the background even if you close the instrument window. If you leave the chart without submitting a trade, AgenaTrader++ will stop and suggested orders will be deleted (but only if you activated the suggested setup by double-clicking).

<figure><img src="https://docs.agenatrader.com/~gitbook/image?url=https%3A%2F%2F2805764894-files.gitbook.io%2F%7E%2Ffiles%2Fv0%2Fb%2Fgitbook-legacy-files%2Fo%2Fassets%252F-MKZSsJBtSP9L4sqIe_q%252F-MQkex8D1n6xxtVa0DJS%252F-MQleHjr5VDZftnFdxUk%252FAnalyzerEscort_LCG.png%3Falt%3Dmedia%26token%3D0f85e35a-afff-4c49-84d0-5b68914c5bcf&#x26;width=768&#x26;dpr=4&#x26;quality=100&#x26;sign=fdaa1fd0&#x26;sv=1" alt=""><figcaption></figcaption></figure>

### Analyzer sessions <a href="#analyzer-sessions" id="analyzer-sessions"></a>

The Setup Builder allows you to place various Setup Builder: Analyzer sessions.

Analyzer sessions make it possible to achieve different performances for the same entry signal (setup) depending on market phases or asset classes (currencies, stocks, CFDs etc.). For example, a falling market has narrower stops than a steadily rising market.

To attach an Analyzer session to the **Analyzer Column column**:

1. Right click in the Analyzer Column column to bring up the context menu
2. Select the **Assign AnalyzerSession** menu item
3. Choose between the available layers that have been determined in the **Setup Builder** as analyzer sessions.

<figure><img src="https://docs.agenatrader.com/~gitbook/image?url=https%3A%2F%2F2805764894-files.gitbook.io%2F%7E%2Ffiles%2Fv0%2Fb%2Fgitbook-legacy-files%2Fo%2Fassets%252F-MKZSsJBtSP9L4sqIe_q%252F-MQkex8D1n6xxtVa0DJS%252F-MQleMIY0B1CW_mnZE59%252FAssignAnalyerSession.png%3Falt%3Dmedia%26token%3Df58559a0-b9d4-41d8-9b3e-de5dc431fa1c&#x26;width=768&#x26;dpr=4&#x26;quality=100&#x26;sign=33c83b5e&#x26;sv=1" alt=""><figcaption></figcaption></figure>

This will change the heading of the Analyzer Column column. Now all signals will be calculated according to the criteria selected for the Analyzer session.

<figure><img src="https://docs.agenatrader.com/~gitbook/image?url=https%3A%2F%2F2805764894-files.gitbook.io%2F%7E%2Ffiles%2Fv0%2Fb%2Fgitbook-legacy-files%2Fo%2Fassets%252F-MKZSsJBtSP9L4sqIe_q%252F-MQkex8D1n6xxtVa0DJS%252F-MQleT07vMGmWpnXXPBO%252FSetupEscort1.png%3Falt%3Dmedia%26token%3D3f95cf80-d57e-44f5-9cf0-2be4e8a5bdd6&#x26;width=768&#x26;dpr=4&#x26;quality=100&#x26;sign=499022fe&#x26;sv=1" alt=""><figcaption></figcaption></figure>

### Example <a href="#example" id="example"></a>

**Important note! The condition's criteria and the time frame of the Analyzer Column (AC) are crucial parameters for correct scanning.**

**Example**

1. Let's assume that there are two conditions, c1 and c2, without a fixed time frame (i.e. with "inherited time frame").
2. C1 and c2 are absolutely identical.
3. For each condition you use a particular scanner column in the AC within the following time frames:1 day for c1 and 1 week for c2.
4. Assume that you create a further condition: "Both" conditions c1 (1-day-fixed) and c2 (1-week-fixed) are connected with an "OR" relation.
5. This condition will be displayed in the 3rd column.

**The result depends on the time frame in which the 3rd column is scanned! There are two possibilities:** 1. You set 1 day as the main time frame for the AC: If the "CalculateOnBarClose" parameter = True, then the previous day (yesterday) and the current week will be used. 2. You set 1 week as the main time frame for the AC: If the "CalculateOnBarClose" parameter = True, then the last closed day (yesterday) and the last closed week (past week) will be used.

**The "CalculateOnBarClose" parameter is important. If the setting is "true", the time point of the last closed bar will be used as a basis for estimation of time series (for the column to be calculated). If the last bar close occured 10 minutes ago, then all time series will be calculated at this point in time. The same implies to the current day, current week etc.**

*Further questions asked by users:* В: I have a condition with the 1-day time frame and scan this in the AC with the main time frame of 1 hour. What will happen? О: The daily bar for the current day will be used. В: Does this mean that if is it set to "bar close" then my condition will be updated every hour? О: Yes.

## Analyzer <a href="#analyzer-sessions-1" id="analyzer-sessions-1"></a>

Setups can be defined differently for various market positions or asset classes. This makes it possible, for example, to define the same signal differently for Forex as for shares, or to adjust short and long setups to have different appearances.

<figure><img src="https://docs.agenatrader.com/~gitbook/image?url=https%3A%2F%2F2805764894-files.gitbook.io%2F%7E%2Ffiles%2Fv0%2Fb%2Fgitbook-legacy-files%2Fo%2Fassets%252F-MKZSsJBtSP9L4sqIe_q%252F-MQkex8D1n6xxtVa0DJS%252F-MQlebTyEPEbqFXDoG1T%252Factivation%2520%281%29.png%3Falt%3Dmedia%26token%3Deb1d3d8c-e30e-43f2-9a3b-60fd31bd0b9d&#x26;width=768&#x26;dpr=4&#x26;quality=100&#x26;sign=c8d7088a&#x26;sv=1" alt=""><figcaption></figcaption></figure>

### **Create a new analyzer session** <a href="#create-a-new-analyzer-session" id="create-a-new-analyzer-session"></a>

* Pre-condition: a standard session should already exist;
* To create new analyzer session just type name in input and click on **Add New Analyzer** button.
* All further analyzer sessions can be copied via **Copy Analyzer** button from the selected session and edited.
* Via **Remove Analyzer** button User may delete the selected session.

Attach analyzer sessions to a [**list chart group**](https://docs.agenatrader.com/main/chart-area/chart-container/chart-container#Chart_Container__List_Chart_Group) within the **Setup Builder: Analyzer Column** in order to be able to use them. Only [**signal setups**](https://docs.agenatrader.com/create-your-own-trading-strategy/setup-escort#Setup_Escort__Configuration_tab) originating from the AnalyzerColumn column will be shown in the list chart group with the corresponding analyzer session settings. If you set a **manual setup** in the chart within the same list chart group, the standard session will be calculated according to the settings.

## Activation tab <a href="#setup_escort__activation_tab" id="setup_escort__activation_tab"></a>

### General information <a href="#general-information" id="general-information"></a>

The **Activation tab** can be accessed by selecting the **Tools** main menu followed by the **Setup Builder** menu item. It displays the available entries, stops and targets within the system.

Check the corresponding checkboxes in the various lists to activate strategies. This makes them available for traders within the **Configuration tab**.

You can find further information as well as a description of EntryEscorts / StopEscorts & TargetEscorts in the [**Setup Builder: Parameters tab**](https://docs.agenatrader.com/create-your-own-trading-strategy/setup-escort#Setup_Escort__Parameters_tab).

<figure><img src="https://docs.agenatrader.com/~gitbook/image?url=https%3A%2F%2F2805764894-files.gitbook.io%2F%7E%2Ffiles%2Fv0%2Fb%2Fgitbook-legacy-files%2Fo%2Fassets%252F-MKZSsJBtSP9L4sqIe_q%252F-MQkex8D1n6xxtVa0DJS%252F-MQlemZHQOGeEgJZ3tAA%252FsetupEscortActivation.png%3Falt%3Dmedia%26token%3Dc2498de2-4e44-43cc-a6da-7632a19ffb4a&#x26;width=768&#x26;dpr=4&#x26;quality=100&#x26;sign=b8f6d2b4&#x26;sv=1" alt=""><figcaption></figcaption></figure>

In the **Activation** tab, you can now right-click on an Entry, Stop, or TargetEscort to access the **Copy** context menu. Selecting this option with a left-click opens an input box to assign a new name.&#x20;

This feature enables creating different setups under EntryEscorts from identical Conditions, and allows for more flexible use of StopEscorts. For instance, it is now possible to create multiple FixTick-Stops with varying tick settings.

<figure><img src="https://docs.agenatrader.com/~gitbook/image?url=https%3A%2F%2F2805764894-files.gitbook.io%2F%7E%2Ffiles%2Fv0%2Fb%2Fgitbook-legacy-files%2Fo%2Fassets%252F-MKZSsJBtSP9L4sqIe_q%252F-MQkex8D1n6xxtVa0DJS%252F-MQlerMms-IgeX0QMC0Q%252FCopy.png%3Falt%3Dmedia%26token%3Db1b4e6ed-b157-4316-a8f7-80dc44273a71&#x26;width=768&#x26;dpr=4&#x26;quality=100&#x26;sign=24746ed8&#x26;sv=1" alt=""><figcaption></figcaption></figure>

### EntryEscorts <a href="#entryescorts" id="entryescorts"></a>

EntryEscorts can be created using one of the following methods:

1\. Through available Escorts within AgenaTrader 2. Conditions: stops and targets defined within the [Signal Builder (en)](https://docs.agenatrader.com/create-your-own-trading-strategy/condition-escort) 3. Scripted Conditions: [self-programmed](https://docs.agenatrader.com/create-your-own-trading-strategy/scripting#Scripting__Programming_of_conditions) stops and targets.

### Stop- and Target Escorts <a href="#stop-and-target-escorts" id="stop-and-target-escorts"></a>

Entry, Stop, and Target Escorts can be created using one of these methods:

1\. Through available Escorts within AgenaTrader

<figure><img src="https://docs.agenatrader.com/~gitbook/image?url=https%3A%2F%2F2805764894-files.gitbook.io%2F%7E%2Ffiles%2Fv0%2Fb%2Fgitbook-legacy-files%2Fo%2Fassets%252F-MKZSsJBtSP9L4sqIe_q%252F-MQkex8D1n6xxtVa0DJS%252F-MQlevDst2clc288sp3o%252FSetupEscortStopAndTarget.png%3Falt%3Dmedia%26token%3D0dc9f187-a3a2-4b93-b155-f1edd4be33e8&#x26;width=768&#x26;dpr=4&#x26;quality=100&#x26;sign=3f1b450b&#x26;sv=1" alt=""><figcaption></figcaption></figure>

2\. Conditions: stops and targets defined within the [**Signal Builder**](https://docs.agenatrader.com/create-your-own-trading-strategy/condition-escort)[ ](https://docs.agenatrader.com/create-your-own-trading-strategy/condition-escort)3. Scripted Conditions: [**self-programmed**](https://docs.agenatrader.com/create-your-own-trading-strategy/scripting#Scripting__Programming_of_conditions) stops and targets.

## Configuration tab <a href="#setup_escort__configuration_tab" id="setup_escort__configuration_tab"></a>

### General information <a href="#general-information-1" id="general-information-1"></a>

The **Configuration tab** can be accessed by selecting the **Tools** main menu followed by the **Setup Builder** menu item. Within the **Configuration tab** you can define fully functional trading setups with just a click.

### Entry Escorts <a href="#entry-escorts" id="entry-escorts"></a>

The Entry Escorts section consists of the four following sectors:

<figure><img src="https://docs.agenatrader.com/~gitbook/image?url=https%3A%2F%2F2805764894-files.gitbook.io%2F%7E%2Ffiles%2Fv0%2Fb%2Fgitbook-legacy-files%2Fo%2Fassets%252F-MKZSsJBtSP9L4sqIe_q%252F-MQkex8D1n6xxtVa0DJS%252F-MQlez0bIGRc9Q8UB9pK%252Fconfiguarion.png%3Falt%3Dmedia%26token%3Da02a0d98-6e59-4bf1-b583-3ad116d3db80&#x26;width=768&#x26;dpr=4&#x26;quality=100&#x26;sign=490c50e0&#x26;sv=1" alt=""><figcaption></figcaption></figure>

**Added automatically after activation:** 1. Through available Escorts within AgenaTrader 2. Conditions: Stops and targets defined within the [Signal Builder (en)](https://docs.agenatrader.com/create-your-own-trading-strategy/condition-escort) 3. Scripted Conditions: [Self-programmed](https://docs.agenatrader.com/create-your-own-trading-strategy/scripting#Scripting__Programming_of_conditions) signals.

**Manually created setups:** 4. Manually created setups by users. Using the **New manual setup** button you can create a new setup. New entry setups may not be recognized by the **Analyzer Column** and are primarily designed to be discretionary ("Manual Mode") setups.

### Compiling setups <a href="#compiling-setups" id="compiling-setups"></a>

A setup is always based on the **Entry Escort's** entry signal.

By selecting the necessary options from the drop-down boxes you can create fully functional setups with:

* Initial Stop Escort
* HardTrail Stop Escort
* SoftTrail Stop Escort
* Target Escort

<figure><img src="https://docs.agenatrader.com/~gitbook/image?url=https%3A%2F%2F2805764894-files.gitbook.io%2F%7E%2Ffiles%2Fv0%2Fb%2Fgitbook-legacy-files%2Fo%2Fassets%252F-MKZSsJBtSP9L4sqIe_q%252F-MQkex8D1n6xxtVa0DJS%252F-MQlfAzmaFs0CMAxDamD%252Fconfig.png%3Falt%3Dmedia%26token%3D8437e349-626d-4fcc-bc2d-735d97a2bb28&#x26;width=768&#x26;dpr=4&#x26;quality=100&#x26;sign=26d92d8c&#x26;sv=1" alt=""><figcaption></figcaption></figure>

{% hint style="info" %}
**IMPORTANT NOTE**. The calculation of the SoftTrail Stop as well as move of the HardTrail Stop takes place only during the trading hours. If the market is closed, then this function will unavailable. Stop as well as move of the HardTrail Stop takes place only during the trading hours. If the market is closed, then this function will unavailable. SoftTrail Stop as well as move of the HardTrail Stop takes place only during the trading hours. If the market is closed, then this function will unavailable. Stop as well as move of the HardTrail Stop takes place only during the trading hours. If the market is closed, then this function will unavailable.
{% endhint %}

**A stop setup consists of three types of stops:**

* *Initial Stop Escort*:
  * Pertains to the stop strategy that is offered for the setup.
  * As long as no positions are opened, the initial stop can be shifted in any direction.
  * Each change in distance between stop and entry price will lead to the risk parameter being adjusted correspondingly (e.g. calculation of the order size).

Even if you have already started a strategy, you can shift the stop order in the direction of higher risk. After widening the distance between stop and entry price, the following popup will appear:

<figure><img src="https://docs.agenatrader.com/~gitbook/image?url=https%3A%2F%2F2805764894-files.gitbook.io%2F%7E%2Ffiles%2Fv0%2Fb%2Fgitbook-legacy-files%2Fo%2Fassets%252F-MKZSsJBtSP9L4sqIe_q%252F-MQkex8D1n6xxtVa0DJS%252F-MQlfXxU8W2CLwHb2-DQ%252Fviolationpopup.png%3Falt%3Dmedia%26token%3Dbe858eb6-1d10-4b4f-acc9-848efd638068&#x26;width=768&#x26;dpr=4&#x26;quality=100&#x26;sign=55513833&#x26;sv=1" alt=""><figcaption></figcaption></figure>

This protects you from undesired circumstances in case the stop order was shifted accidentally.

* *HardTrail Stop Escort*:
  * The HardTrail stop is always associated with the actual StopOrder as soon as the position has been opened. Meaning: once the HardTrail stop level is crossed, the entire position will be closed.
  * The starting point of the HardTrail StopEscorts is always the initial stop. Meaning: If the HardTrail stop is located further from the current market price than the initial stop, then the HardTrail stop will only be activated after reaching the initial stop. **IMPORTANT NOTE!** Some brokers charge a fee for changing/modifying the orders. If this is the case, we recommend you use a stop that rarely changes, such as Pivot StopEscort. Please see the [Setup Builder: Parameters tab](https://docs.agenatrader.com/create-your-own-trading-strategy/setup-escort#Setup_Escort__Parameters_tab) section for further information.
  * The HardTrail Stop Escort can be modified at any time during the trade by doing one of the following:
    * clicking on the red "X" of the trading bar, changing the position and then confirming this with the green check mark or
    * or changing this within the **Order Escort**.
* *SoftTrail Stop Escort*:
  * The SoftTrail stop is a specific type of stop that is not activated immediately after the stop marker has been crossed.
  * This stop remains passive and is only activated once the closing price crosses the current stop marker (for example SMA).
  * After this, the HardTrail stop will be placed below the low (or above the high) of the bar that has activated the SoftTrail.

The SoftTrail Stop Escort may be replaced or modified at any time during the trade.

{% hint style="info" %}
**NOTE:** The SoftStop cannot be reset automatically. This means that in a long trade, the SoftStop can only be set to higher prices, even if you change the SoftStopEscort and the new SoftStop would be at a lower price. However, it is possible to manually reset the SoftStop. First, activate the "Pause" checkbox for the SoftStopEscort in the OrderEscort, then manually change the price at which the SoftStop should be set. Afterwards, deactivate the "Pause" checkbox so that the SoftStop continues to be calculated correctly.
{% endhint %}

**Targets** AgenaTrader offers a variety of [target methods](https://docs.agenatrader.com/create-your-own-trading-strategy/setup-escort#Setup_Escort__Parameters_tab) and can manage up to 3 targets in one trade.

### Hard and Soft stop usage examples

The user can define, activate and deactivate fully functional trading setups via the Setup Builder.

For each setup, the user should adjust the hard and soft stops.

**Hard stops** are the stop methods that are applied to the stop orders. Basically, a hard stop is intended to be used for catastrophic scenarios. The HardTrail stop is always connected to the actual stop order as soon as the position is opened. This means that once the HardTrail stop level is crossed, the entire position is closed.

**Soft stops** do not close a trade immediately after being crossed by a closing price. Once the soft stop is crossed by the closing price, the hard stop is triggered and moved accordingly.

#### Example <a href="#example" id="example"></a>

We configure trading setup as on picture below:

<figure><img src="https://docs.agenatrader.com/~gitbook/image?url=https%3A%2F%2F2805764894-files.gitbook.io%2F%7E%2Ffiles%2Fv0%2Fb%2Fgitbook-legacy-files%2Fo%2Fassets%252F-MKZSsJBtSP9L4sqIe_q%252F-MQwPCScTa47vxWsw7R-%252F-MQwRx1H378TTaqbonUY%252Fconfiguration.png%3Falt%3Dmedia%26token%3Dcb350897-47cc-48fc-b87b-fec060f9a3d7&#x26;width=768&#x26;dpr=4&#x26;quality=100&#x26;sign=f92e5e00&#x26;sv=1" alt=""><figcaption></figcaption></figure>

* **Initial Stop Escort** is set as a Pivot Slow. It means stop use Swing (30) indicator as a stop.
* **HardTrail Stop** is set as Keltner Channel. This stop use Keltner lines as a stop (lower for a long and upper for the short position)
* **SoftTrail Stop** is set as SuperTrend. This stop uses SuperTrend indicator as a stop.
* **Target Escort** is set as No Target. It means we don't use targets in this setup

You can find more details about stop setups on the page [**Setup Builder: Stop Escorts**](https://docs.agenatrader.com/create-your-own-trading-strategy/setup-escort#stopescort).

First, stop starts at **Initial Stop** position (Pivot Slow). After the first bar was closed, stop automatically moves the same way as Keltner lower line (according to **HardTrail Stop** setting). On a chart, **HardTrail** **Stop** looks like a solid line. **SoftTrail** stop also starts after the first bar is closed. It moves similar to SuperTrend indicator (according to **SoftTrail Stop** settings). SoftTrail stop displayed as dot line on a chart.

<figure><img src="https://docs.agenatrader.com/~gitbook/image?url=https%3A%2F%2F2805764894-files.gitbook.io%2F%7E%2Ffiles%2Fv0%2Fb%2Fgitbook-legacy-files%2Fo%2Fassets%252F-MKZSsJBtSP9L4sqIe_q%252F-MQwPCScTa47vxWsw7R-%252F-MQwS-ufk6D821X11KjG%252Fchart.png%3Falt%3Dmedia%26token%3Dd30d5a9e-10e1-48c1-bcaf-f565c327b85e&#x26;width=768&#x26;dpr=4&#x26;quality=100&#x26;sign=1f28e5ce&#x26;sv=1" alt=""><figcaption></figcaption></figure>

In case User wants to switch off automated stop movements just configure trading setup as on picture below. After Stop will be placed according to Initial Stop settings and may be moved only manually by User.

<figure><img src="https://docs.agenatrader.com/~gitbook/image?url=https%3A%2F%2F2805764894-files.gitbook.io%2F%7E%2Ffiles%2Fv0%2Fb%2Fgitbook-legacy-files%2Fo%2Fassets%252F-MKZSsJBtSP9L4sqIe_q%252F-MQwPCScTa47vxWsw7R-%252F-MQwS4ORGEQLJvYRQjWH%252Fstop.png%3Falt%3Dmedia%26token%3D46c66c05-cd09-4460-b0ef-38eb07138284&#x26;width=768&#x26;dpr=4&#x26;quality=100&#x26;sign=1bcf9bed&#x26;sv=1" alt=""><figcaption></figcaption></figure>

{% hint style="warning" %}
**Attention!** Hard and soft stops are moved automatically according to your stop setups. You can find more details about stop setups on the page [**Setup Builder: Stop Escorts**](https://docs.agenatrader.com/create-your-own-trading-strategy/setup-escort#stopescort).
{% endhint %}

{% hint style="info" %}
**IMPORTANT NOTE**. SoftTrail stop is not able to be automatically reset. It means that in a long trade SoftTrail can only move to higher prices, even if you change the SoftTrail in Order Escort and the new SoftTrail Sopt should sit at a lower price. However there is a possibility to reset SoftTrail manually. To manage this please activate the "Stop" checkbox for the SoftTrail in OrderEscort and then manually change the price at which the SoftTrail should sit. Then deactivate the "Stop" and check if the SoftTrail is calculated again correctly.
{% endhint %}

### Manually created setups <a href="#manually-created-setups" id="manually-created-setups"></a>

The main characteristics of manually created setups are:

* Manually created setups are discretionary and therefore not recognized in the Analyzer Column column;
* They are primarily setups that can be visualized but not programmed;
* Manually created setups are used mainly for discretionary entries. Within the system they are named "Manual Mode".

<figure><img src="https://docs.agenatrader.com/~gitbook/image?url=https%3A%2F%2F2805764894-files.gitbook.io%2F%7E%2Ffiles%2Fv0%2Fb%2Fgitbook-legacy-files%2Fo%2Fassets%252F-MKZSsJBtSP9L4sqIe_q%252F-MQkex8D1n6xxtVa0DJS%252F-MQlfnps1W-mCX4kUbQR%252F2.png%3Falt%3Dmedia%26token%3D6b6ce577-86d9-4595-a9bb-ffd60f7854eb&#x26;width=768&#x26;dpr=4&#x26;quality=100&#x26;sign=fb29adfe&#x26;sv=1" alt=""><figcaption></figcaption></figure>

**To create a new manual setup:**

1. Select **Tools** from the main menu followed by the **Setup Builder** menu item.
2. Left click on the **Configuration tab**
3. Give the manual setup a name then click the **New Manual Setup** button. This will add the setup name to the list of entry strategies.
4. Select the newly created setup and configure its stops and targets according to your preferences.

Click the **Remove Manual Setup** button to delete the selected setup.

It is possible to use a signal setup for discretionary entries. To do so, select the signal setup and submit an order to the market. You can do this when you wish to apply the stop/target logic of the signal setup or when you need specific criteria to place stops and targets that cannot be recognized by the system (such as a minimal break in an indicator line)

## Parameters tab <a href="#setup_escort__parameters_tab" id="setup_escort__parameters_tab"></a>

#### General information <a href="#general-information-2" id="general-information-2"></a>

The **Parameters tab** can be accessed by clicking the **Tools** main menu and then selecting the **Setup Builder** menu item. Within the **Parameters tab** you can define various parameters for almost every entry stop and target strategy.

**PLEASE NOTE:** If you change some settings in the "Activation" or "Configuration"-Tab, those changes will not be visible immidiately in the Parameters-Tab. Please click in one of the boxes on the left side of the Parameters-Tab to refresh the Tab and receive the latest settings. in one of the boxes on the left side of the Parameters-Tab to refresh the Tab and receive the latest settings.

If you select an item from the EntryEscorts, StopEscorts or TargetEscorts sections, then the parameter box will become active:

<figure><img src="https://docs.agenatrader.com/~gitbook/image?url=https%3A%2F%2F2805764894-files.gitbook.io%2F%7E%2Ffiles%2Fv0%2Fb%2Fgitbook-legacy-files%2Fo%2Fassets%252F-MKZSsJBtSP9L4sqIe_q%252F-MQkex8D1n6xxtVa0DJS%252F-MQlfsPw3l-qbfEjTfUc%252FOrder%2520mode.png%3Falt%3Dmedia%26token%3D1bb6968f-5d57-4e7d-b79e-aed1148f5149&#x26;width=768&#x26;dpr=4&#x26;quality=100&#x26;sign=976679ea&#x26;sv=1" alt=""><figcaption></figcaption></figure>

If the checkbox **Exclude instruments** is checked, instruments within the text box WILL NOT BE taken into consideration for signal scanning. If the checkbox remains unchecked then the scanning will be performed ONLY for instruments within the text box. If you do not enter any instrument symbols into the text box, ALL instruments WILL BE scanned for this strategy.

### EntryEscorts <a href="#entryescorts-1" id="entryescorts-1"></a>

The Entry Escorts functionalities give you an idea of our very own LocationPointTrading (LPT). This is still in the development stage and is anticipated to be made available in 2017 (fee-based).

The Entry Escorts section includes several parameters for creating the entry conditions:

<figure><img src="https://docs.agenatrader.com/~gitbook/image?url=https%3A%2F%2F2805764894-files.gitbook.io%2F%7E%2Ffiles%2Fv0%2Fb%2Fgitbook-legacy-files%2Fo%2Fassets%252F-MKZSsJBtSP9L4sqIe_q%252F-MQkex8D1n6xxtVa0DJS%252F-MQlfwgJAptA6agCVvq9%252FEntryEscortEN.png%3Falt%3Dmedia%26token%3Dda2ae124-8a3d-4f06-b489-b09cba07e6b1&#x26;width=768&#x26;dpr=4&#x26;quality=100&#x26;sign=912d7992&#x26;sv=1" alt=""><figcaption></figcaption></figure>

| **Parameter**                | **Description**                                                                                                                                                                                                                                                                           |
| ---------------------------- | ----------------------------------------------------------------------------------------------------------------------------------------------------------------------------------------------------------------------------------------------------------------------------------------- |
| Automated                    | Here you can decide whether your setup should be executed automated, when it occurs.                                                                                                                                                                                                      |
| BreakEvenAfterN...           | Here you can determine, after how many risks in the black your stop should be set to BreakEven.                                                                                                                                                                                           |
| BreakEvenAfterNType          | Here you can determine, if BreakEven should be calculated after risks, ticks ATRs or percent.                                                                                                                                                                                             |
| BreakEvenTickDifference      | Here you can set the ammount of ticks above (+) or below (-) in a Long respectively Short position the stop should lie after reaching your preset BreakEvenRisks.                                                                                                                         |
| BreakEvenTickDifferenceType  | Here you can determine, if difference should be calculated after risks, ticks ATRs or percent.                                                                                                                                                                                            |
| OrderType                    | Here you can determine with which order type you would like to put your setup into the market.                                                                                                                                                                                            |
| SendSignalMail               | Here you can decide whether an email should be sent to you, when a condtion displays a signal.                                                                                                                                                                                            |
| SendSignalMobileNotification | Here you can determine whether a notification is sent to your mobile phone, when a signal, based on one of your conditions, appears.                                                                                                                                                      |
| Show in Dynamic Scanner      | Here you can decide whether the setup should be displayed in Dynamic Scanner as soon as it appears.                                                                                                                                                                                       |
| SignalSound                  | When you acticvate one of the soundfiles, you will hear the signal as soon as there is a hit in AnalyzerColumn-column (scanner). Please note that signal is only emitted when SoundAlerts are activated in scanner.                                                                       |
| SpecificRiskAmount           | When entering a certain amount of money here, the risk settings in Account tab in ConfigurationEcort are overwritten. Please note: RiskPercent has a higher priority than RiskAmount. When a certain RiskPercent is set in Account tab in ConfigurationEscort, it gets a higher priortiy. |
| SpecificRiskPercent          | When entering a certain percentage here, the risk settings in Account Tab in ConfigurationEscort are overwritten. Please note: RiskPercent has a higher priority than RiskAmount.                                                                                                         |
| ExecutionSound               | When you activate one of the soundfiles, you will hear the signal as soon as entry is executed.                                                                                                                                                                                           |
| OrderMode                    | Here you can determine whether the order should be direct or synthetic.                                                                                                                                                                                                                   |
| SendExecutionMail            | When set to True, an email will be sent to you, when order is executed. In order to make this work, you need to enter an email adress in Geneal tab in ConfigurationEscort.                                                                                                               |

### StopEscort <a href="#stopescort" id="stopescort"></a>

The Stop Escorts section includes several parameters for creating the entry conditions.

Please find below the parameters of **BarByBar** as an example:

<figure><img src="https://docs.agenatrader.com/~gitbook/image?url=https%3A%2F%2F2805764894-files.gitbook.io%2F%7E%2Ffiles%2Fv0%2Fb%2Fgitbook-legacy-files%2Fo%2Fassets%252F-MKZSsJBtSP9L4sqIe_q%252F-MQkex8D1n6xxtVa0DJS%252F-MQlg2Z4HHhMDz78aOSX%252FStopEscort.png%3Falt%3Dmedia%26token%3Dff8cce32-8e89-42e0-a14a-f5cbdd812a1c&#x26;width=768&#x26;dpr=4&#x26;quality=100&#x26;sign=d12a912d&#x26;sv=1" alt=""><figcaption></figcaption></figure>

| Parameter                | Description                                                                                                                                   |
| ------------------------ | --------------------------------------------------------------------------------------------------------------------------------------------- |
| StopDeviation Ticks      | With this settings you can determine, how many ticks above respectively below the exact position of the order should be placed.               |
| WaitBarsBeforeFirstTrail | Here you can determine how many bars AgenaTrader should wait at the beginning of a trade, until HardStop takes over automated stopp trailing. |
| ExecutionSound           | Here you can choose sound which you want to hear when stop is executed.                                                                       |
| OrderMode                | Here you can choose whether the order should ba direct or synthetic.                                                                          |
| SendExecutionMail        | Here you can determine whether you want to get an email notification when stop is executed.                                                   |
| BarsBackHardTrail        | Here you can determine, how many bars back HardTrail should be trailed.                                                                       |
| BarsBackInitialStop      | Here you can determine, how many bars back InitialStop should be trailed.                                                                     |
| BarsBackSoftTrail        | Here you can determine, how many bars back SoftTrail should be trailed.                                                                       |

### TargetEscorts <a href="#targetescorts" id="targetescorts"></a>

The Stop Escorts section includes several parameters for creating the target conditions.

Please find below the parameters of **MultipleRisk3Level** as an example:

<figure><img src="https://docs.agenatrader.com/~gitbook/image?url=https%3A%2F%2F2805764894-files.gitbook.io%2F%7E%2Ffiles%2Fv0%2Fb%2Fgitbook-legacy-files%2Fo%2Fassets%252F-MKZSsJBtSP9L4sqIe_q%252F-MQkex8D1n6xxtVa0DJS%252F-MQlg6gSIy5p_JFXtjDl%252FTargetEscortEN.png%3Falt%3Dmedia%26token%3Db9709def-06ec-4ca2-a38e-c0da5a67ef02&#x26;width=768&#x26;dpr=4&#x26;quality=100&#x26;sign=fca2a3af&#x26;sv=1" alt=""><figcaption></figcaption></figure>

| Parameter               | Description                                                                                       |
| ----------------------- | ------------------------------------------------------------------------------------------------- |
| ExectionSound           | Here you can choose sound which you want to hear when target is filled.                           |
| OrderMode               | Here you can choose whether the order should ba direct or synthetic.                              |
| SendExecutionMail       | Here you can determine whether you want to get an email notification when stop is executed.       |
| ProfitPercentageTarget1 | Here you determine the percentage of position, that should be closed when reaching first target.  |
| ProfitPercentageTarget2 | Here you determine the percentage of position, that should be closed when reaching second target. |
| ProfitPercentageTarget3 | Here you determine the percentage of position, that should be closed when reaching third target.  |
| RisksToLevel1           | Here you determine how many risks should be taken up to first level.                              |
| RisksToLevel2           | Here you determine how many risks should be taken up to second level.                             |
| RisksToLevel3           | Here you determine how many risks should be taken up to third level.                              |

### Closing the remainder of an opened position with a trailing stop <a href="#closing-the-remainder-of-an-opened-position-with-a-trailing-stop" id="closing-the-remainder-of-an-opened-position-with-a-trailing-stop"></a>

The necessary settings are:

1. In the **Parameters tab** of the SetupBuilder, define the percent by which the opened position is to be decreased after execution of the 1st and the 2nd targets;
2. The remaining percentage (25%) of the position will be managed automatically by a trailing stop.

<figure><img src="https://docs.agenatrader.com/~gitbook/image?url=https%3A%2F%2F2805764894-files.gitbook.io%2F%7E%2Ffiles%2Fv0%2Fb%2Fgitbook-legacy-files%2Fo%2Fassets%252F-MKZSsJBtSP9L4sqIe_q%252F-MQkex8D1n6xxtVa0DJS%252F-MQlgAs52wfKJvnSB1eL%252Fhardtrail.png%3Falt%3Dmedia%26token%3D2dc6c6e6-0f48-4db9-b4d7-cca2b5c8e741&#x26;width=768&#x26;dpr=4&#x26;quality=100&#x26;sign=c84078da&#x26;sv=1" alt=""><figcaption></figcaption></figure>

Alternatively, you can adjust the order size in the [chart](https://docs.agenatrader.com/main/chart-area/untitled/chart-context-menu#Chart_Context_Menu__Chart_Trading) or using the [Order Escort](https://docs.agenatrader.com/main/chart-area/order-escort).

![](https://docs.agenatrader.com/~gitbook/image?url=https%3A%2F%2F2805764894-files.gitbook.io%2F%7E%2Ffiles%2Fv0%2Fb%2Fgitbook-legacy-files%2Fo%2Fassets%252F-MKZSsJBtSP9L4sqIe_q%252F-MQkex8D1n6xxtVa0DJS%252F-MQlgJJdmo_i9udvgCGx%252FTargetEscortSetupEscortTrailingStop3.png%3Falt%3Dmedia%26token%3D764c2b14-c6ec-4fb0-9036-44b2e0a942eb\&width=768\&dpr=4\&quality=100\&sign=c5dc01a8\&sv=1)![](https://docs.agenatrader.com/~gitbook/image?url=https%3A%2F%2F2805764894-files.gitbook.io%2F%7E%2Ffiles%2Fv0%2Fb%2Fgitbook-legacy-files%2Fo%2Fassets%252F-MKZSsJBtSP9L4sqIe_q%252F-MQkex8D1n6xxtVa0DJS%252F-MQlgFajAaWpChXjKN7A%252FTargetEscortSetupEscortTrailingStop4.png%3Falt%3Dmedia%26token%3Deff36ba1-fada-4b96-8d34-cf4bb9ab0725\&width=768\&dpr=4\&quality=100\&sign=7733621d\&sv=1)

## Stop Types <a href="#setup_escort__stop_escorts__en" id="setup_escort__stop_escorts__en"></a>

### Description of StopEscorts <a href="#description-of-stopescorts" id="description-of-stopescorts"></a>

The StopEscorts section contains stop setups. If you left click on one of the items, the parameter box will become active.

[**Initial StopEscort**](https://docs.agenatrader.com/create-your-own-trading-strategy/setup-escort#Initial_stop) section:

**InitialStopOnly**

Allows you to submit an initial stop to the market. Select this if you do not want to use [HardTrail StopEscort](https://docs.agenatrader.com/create-your-own-trading-strategy/setup-escort#Hard_Trail_stop) or [SoftTrail StopEscort](https://docs.agenatrader.com/create-your-own-trading-strategy/setup-escort#Soft_Trail).

**ATR**

Calculates the average true range for a stop.

![](https://docs.agenatrader.com/~gitbook/image?url=https%3A%2F%2F2805764894-files.gitbook.io%2F%7E%2Ffiles%2Fv0%2Fb%2Fgitbook-legacy-files%2Fo%2Fassets%252F-MKZSsJBtSP9L4sqIe_q%252F-MQkex8D1n6xxtVa0DJS%252F-MQlgSOiNo8R15-80DJR%252FATR.jpg%3Falt%3Dmedia%26token%3D39c5d463-fae4-49ec-a904-ffbf1aee4db4\&width=768\&dpr=4\&quality=100\&sign=8725cdfa\&sv=1)

**BarByBar**

Places a stop behind the lows or highs of the previous x bars.

![](https://docs.agenatrader.com/~gitbook/image?url=https%3A%2F%2F2805764894-files.gitbook.io%2F%7E%2Ffiles%2Fv0%2Fb%2Fgitbook-legacy-files%2Fo%2Fassets%252F-MKZSsJBtSP9L4sqIe_q%252F-MQkex8D1n6xxtVa0DJS%252F-MQlgWQC6oG96bLygklF%252FBarByBar.jpg%3Falt%3Dmedia%26token%3D6268b82c-a952-4872-a897-527e73ef1e34\&width=768\&dpr=4\&quality=100\&sign=c460a265\&sv=1)

**BollingerBands**

Uses the upper or lower line of the Bollinger band as a stop.

![](https://docs.agenatrader.com/~gitbook/image?url=https%3A%2F%2F2805764894-files.gitbook.io%2F%7E%2Ffiles%2Fv0%2Fb%2Fgitbook-legacy-files%2Fo%2Fassets%252F-MKZSsJBtSP9L4sqIe_q%252F-MQkex8D1n6xxtVa0DJS%252F-MQlg_Tl52olFgUBdJvm%252FBollinger.jpg%3Falt%3Dmedia%26token%3Da8fdf2c2-a794-4e29-828f-56da247431cf\&width=768\&dpr=4\&quality=100\&sign=a31a05cd\&sv=1)

**EightTrail**

Uses the SMA8 line as a stop.

![](https://docs.agenatrader.com/~gitbook/image?url=https%3A%2F%2F2805764894-files.gitbook.io%2F%7E%2Ffiles%2Fv0%2Fb%2Fgitbook-legacy-files%2Fo%2Fassets%252F-MKZSsJBtSP9L4sqIe_q%252F-MQkex8D1n6xxtVa0DJS%252F-MQlgeSAqc23mr868ID8%252FEightTrail.jpg%3Falt%3Dmedia%26token%3D90991f2e-e020-4a38-9cb7-be610dfd33c6\&width=768\&dpr=4\&quality=100\&sign=ca370c97\&sv=1)

**FixTick**

Ensures that a fixed number of ticks behind the closing price of the most recently closed candle are attached to the stop. You can see the minimum tick size for each instrument in the **Instrument Editor**. **Example.** 1. Let's assume that the tick size for AUDCAD is 0.00001. 2. here we calculate the pipettes (1 pip = 10 pipettes) 3. BUT the tick size for USDJPY is 0.001

![](https://docs.agenatrader.com/~gitbook/image?url=https%3A%2F%2F2805764894-files.gitbook.io%2F%7E%2Ffiles%2Fv0%2Fb%2Fgitbook-legacy-files%2Fo%2Fassets%252F-MKZSsJBtSP9L4sqIe_q%252F-MQkex8D1n6xxtVa0DJS%252F-MQlhFeCoxmfBKOp_hVn%252FInstruments_tick1.png%3Falt%3Dmedia%26token%3D84029898-133a-4564-b53b-f00a7598bf01\&width=768\&dpr=4\&quality=100\&sign=d1be1e27\&sv=1)![](https://docs.agenatrader.com/~gitbook/image?url=https%3A%2F%2F2805764894-files.gitbook.io%2F%7E%2Ffiles%2Fv0%2Fb%2Fgitbook-legacy-files%2Fo%2Fassets%252F-MKZSsJBtSP9L4sqIe_q%252F-MQkex8D1n6xxtVa0DJS%252F-MQlhQOx_QMexK2gqglA%252FInstruments_tick2.png%3Falt%3Dmedia%26token%3D3918d873-d4de-420c-b22d-0e36e49ac372\&width=768\&dpr=4\&quality=100\&sign=28175677\&sv=1)

4\. We will assume that in the SetupBuilder we set the Fix Tick = 5 5. This implies that if the AUDCAD entry price is 0.99000, the stop price will amount to 0.99005 6. If the USDJPY entry price is 120.50, the stop price will amount to 120.505.

**GannHighLow:**

Places a stop above the highest high or the lowest low of the previous X candlestick. If the subsequent candlesticks do not create a lower low or a higher high than the previous, the stop will remain on the current position. Only after a new low or high occurs will the stop be placed behind the highest high or lowest low of the last x candle.

**InitialRisk**

Places a stop according to the distance between an entry and a stop (initial risk). The stop will be adjusted every time the candle is closed according to the initial risk amount.

**OutsideBar**

Places a stop behind the outside bars. The stop will only move when the outside bar is crossed by the closing price.

<figure><img src="https://docs.agenatrader.com/~gitbook/image?url=https%3A%2F%2F2805764894-files.gitbook.io%2F%7E%2Ffiles%2Fv0%2Fb%2Fgitbook-legacy-files%2Fo%2Fassets%252F-MKZSsJBtSP9L4sqIe_q%252F-MQkex8D1n6xxtVa0DJS%252F-MQlhUu9QkrPFbrYWz3w%252FOutsideBar.jpg%3Falt%3Dmedia%26token%3D3a3cd0d4-ab10-4bef-9ccd-26849c05de0f&#x26;width=768&#x26;dpr=4&#x26;quality=100&#x26;sign=e8f69fe0&#x26;sv=1" alt=""><figcaption></figcaption></figure>

**ParabolicSAR**

Uses the parabolic SAR as a stop.

<figure><img src="https://docs.agenatrader.com/~gitbook/image?url=https%3A%2F%2F2805764894-files.gitbook.io%2F%7E%2Ffiles%2Fv0%2Fb%2Fgitbook-legacy-files%2Fo%2Fassets%252F-MKZSsJBtSP9L4sqIe_q%252F-MQkex8D1n6xxtVa0DJS%252F-MQlhYfE0oVClWqSkdIB%252FparabolicBar.jpg%3Falt%3Dmedia%26token%3D7daa2416-4868-4032-adb9-2efdef4c6cff&#x26;width=768&#x26;dpr=4&#x26;quality=100&#x26;sign=8b46c96d&#x26;sv=1" alt=""><figcaption></figcaption></figure>

**PivotFast**

Places a stop after small lows or highs based on the 123-counting mechanism. We recommend that you keep the PivotFast parameter inputs small. The picture illustrates that the PivotFast parameter is set to 5:

<figure><img src="https://docs.agenatrader.com/~gitbook/image?url=https%3A%2F%2F2805764894-files.gitbook.io%2F%7E%2Ffiles%2Fv0%2Fb%2Fgitbook-legacy-files%2Fo%2Fassets%252F-MKZSsJBtSP9L4sqIe_q%252F-MQkex8D1n6xxtVa0DJS%252F-MQlhbecywRAS82aYLAX%252FPivotFast.jpg%3Falt%3Dmedia%26token%3Dbbf56e4f-90fb-4847-b519-ecdf0f8cd785&#x26;width=768&#x26;dpr=4&#x26;quality=100&#x26;sign=de8dbf72&#x26;sv=1" alt=""><figcaption></figcaption></figure>

**PivotMedium**

Places a stop after medium lows or highs based on the 123-counting mechanism. We recommend that you keep the PivotFast parameter inputs medium. The picture illustrates that the PivotFast parameter is set to 13:

<figure><img src="https://docs.agenatrader.com/~gitbook/image?url=https%3A%2F%2F2805764894-files.gitbook.io%2F%7E%2Ffiles%2Fv0%2Fb%2Fgitbook-legacy-files%2Fo%2Fassets%252F-MKZSsJBtSP9L4sqIe_q%252F-MQkex8D1n6xxtVa0DJS%252F-MQlhg4vyzTUAIriMBpV%252FPivotMedium.jpg%3Falt%3Dmedia%26token%3D9a9b0af5-466d-48e9-bd58-3f73b890557c&#x26;width=768&#x26;dpr=4&#x26;quality=100&#x26;sign=e74dfeb5&#x26;sv=1" alt=""><figcaption></figcaption></figure>

**PivotSlow**

Places a stop after large lows or highs based on the 123-counting mechanism. We recommend that you keep the PivotFast parameter inputs large. The picture illustrates that the PivotFast parameter is set to 30:

<figure><img src="https://docs.agenatrader.com/~gitbook/image?url=https%3A%2F%2F2805764894-files.gitbook.io%2F%7E%2Ffiles%2Fv0%2Fb%2Fgitbook-legacy-files%2Fo%2Fassets%252F-MKZSsJBtSP9L4sqIe_q%252F-MQkex8D1n6xxtVa0DJS%252F-MQlhkPtRcMoQLnscrvl%252FPivotSlow.jpg%3Falt%3Dmedia%26token%3Df4ec1755-532c-407e-a612-b39c56a0efc4&#x26;width=768&#x26;dpr=4&#x26;quality=100&#x26;sign=ba30338d&#x26;sv=1" alt=""><figcaption></figcaption></figure>

**TwentyTrail**

Uses the SMA20 line as a stop.

<figure><img src="https://docs.agenatrader.com/~gitbook/image?url=https%3A%2F%2F2805764894-files.gitbook.io%2F%7E%2Ffiles%2Fv0%2Fb%2Fgitbook-legacy-files%2Fo%2Fassets%252F-MKZSsJBtSP9L4sqIe_q%252F-MQkex8D1n6xxtVa0DJS%252F-MQlhp0M0EXoNYf_eg9U%252FTwentyTrail.jpg%3Falt%3Dmedia%26token%3Dde1e9ef9-dbc3-4219-a5bf-df70302e1104&#x26;width=768&#x26;dpr=4&#x26;quality=100&#x26;sign=be45c40a&#x26;sv=1" alt=""><figcaption></figcaption></figure>

**SuperTrend**

Uses the super trend indicator as a stop

<figure><img src="https://docs.agenatrader.com/~gitbook/image?url=https%3A%2F%2F2805764894-files.gitbook.io%2F%7E%2Ffiles%2Fv0%2Fb%2Fgitbook-legacy-files%2Fo%2Fassets%252F-MKZSsJBtSP9L4sqIe_q%252F-MQkex8D1n6xxtVa0DJS%252F-MQlhsuxhbVhomVHXSkv%252FSuperTrend.jpg%3Falt%3Dmedia%26token%3D6c9da878-9365-4836-bcf5-57ccdb71e78f&#x26;width=768&#x26;dpr=4&#x26;quality=100&#x26;sign=5792caa7&#x26;sv=1" alt=""><figcaption></figcaption></figure>

**DonnchianChannel**

The upper line is used as stop for short positions and the lower line as stop for long positions.

<figure><img src="https://docs.agenatrader.com/~gitbook/image?url=https%3A%2F%2F2805764894-files.gitbook.io%2F%7E%2Ffiles%2Fv0%2Fb%2Fgitbook-legacy-files%2Fo%2Fassets%252F-MKZSsJBtSP9L4sqIe_q%252F-MQkex8D1n6xxtVa0DJS%252F-MQlhx6EP4HS6Wh2121v%252FDonchianChannel.jpg%3Falt%3Dmedia%26token%3Dbdf03e5c-5931-417a-921c-669dbe886696&#x26;width=768&#x26;dpr=4&#x26;quality=100&#x26;sign=4361753a&#x26;sv=1" alt=""><figcaption></figcaption></figure>

**KeltnerChannel**

The upper line is used as stop for short positions and the lower line as stop for long positions.

<figure><img src="https://docs.agenatrader.com/~gitbook/image?url=https%3A%2F%2F2805764894-files.gitbook.io%2F%7E%2Ffiles%2Fv0%2Fb%2Fgitbook-legacy-files%2Fo%2Fassets%252F-MKZSsJBtSP9L4sqIe_q%252F-MQkex8D1n6xxtVa0DJS%252F-MQli0ecWH1Gj5heOB9W%252FKeltnerChannel.jpg%3Falt%3Dmedia%26token%3D51f2c7fd-69db-480f-8907-705379c72d1a&#x26;width=768&#x26;dpr=4&#x26;quality=100&#x26;sign=57571b20&#x26;sv=1" alt=""><figcaption></figcaption></figure>

### StopEscorts parameters <a href="#stopescorts_parameters" id="stopescorts_parameters"></a>

* For ATR, FixTick and InitialRisk-Stops the option "CalculateOnPriceChange" is available. If this option is set to 'True', the Stop is recalculated with each Tick coming in. That means that the stop is following the movement of each tick. When you set this option to 'False', the StopEscort will wait for the candle to close to recalculate itself and there won't be any intra-candle movement of the stop.
* BarByBar includes the following settings:
  * BarsBackHardTrail
  * BarsBackInitialStop
  * BarsBackSoftTrail

This shows how many of the previous bars are used for the stop calculation. Meaning of numbers: "1" - stop is placed behind the last closed period; "2" - stop is placed behind the bar located further than the last two closed candlesticks.

* EightTrail and TwentyTrail
  * BarByBarStart setting: if set to "false", then the SMA (simple moving average) trailing stop will not immediately be submitted from the start.

**Example.** 1. Assume that your stop entry is below (long) or above (short) the SMA trailing stop. 2. The SMA can only be used as a stop when the price has moved above it (in a long position) or below it (in a short position). 3. Using this setting, you can apply a BarByBar stop up to this point (the settings for the standard BarByBar stop will be applied) or a simulated SMA.

The image below demonstrates an example for a long position:

<figure><img src="https://docs.agenatrader.com/~gitbook/image?url=https%3A%2F%2F2805764894-files.gitbook.io%2F%7E%2Ffiles%2Fv0%2Fb%2Fgitbook-legacy-files%2Fo%2Fassets%252F-MKZSsJBtSP9L4sqIe_q%252F-MQkex8D1n6xxtVa0DJS%252F-MQli6OjmgaPDJhBa6Wg%252FStopEscorts11_eng.png%3Falt%3Dmedia%26token%3D755e07c8-0e40-4c1b-9635-567a83789f16&#x26;width=768&#x26;dpr=4&#x26;quality=100&#x26;sign=21d0bbc8&#x26;sv=1" alt=""><figcaption></figcaption></figure>

* GannHighLow
  * HighLowsBack setting: shows the number of highs or lows back in the history that are taken into account for the stop calculation.
* InitialRisk
  * Risk Factor setting: sets a multiplicator for the initial risk
* OutsideBar includes the following settings:
  * BarsBackHardTrail
  * BarsBackInitialStop
  * BarsBackSoftTrail

This shows how many of the previous bars are used for the stop calculation. Meaning of numbers: "0" - last closed period; "1" - stop is placed behind the last closed period; "2" - stop is placed behind the bar that is located the furthest from the last two closed periods and so on.

* PivotFast
  * Default setting: the PivotFast parameter = 5.
* PivotMedium
  * Default setting: the PivotMedium parameter = 13.
* PivotSlow
  * Default setting: the PivotSlow parameter = 30.

## Target Escorts <a href="#setup_escort__target_escorts__en" id="setup_escort__target_escorts__en"></a>

### Description of TargetEscorts <a href="#description_of_targetescorts" id="description_of_targetescorts"></a>

This section includes a detailed description of the TargetEscorts.

* FixTick1Level: places one target with a fixed tick distance
  * ProfitPercentageTarget1: a percentage of the entry order being filled when the first target was reached.
* FixTick2Level: places two targets with a fixed tick distance
  * ProfitPercentageTarget1 and 2 : a percentage of the entry order being filled when the first and second target was reached.
* FixTick3Level: places three targets with a fixed tick distance
  * ProfitPercentageTarget1, 2 and 3: a percentage of the entry order being filled when the first, second and third target was reached.

**Important Note!**

**If Multi-Target Setups are used, AgenaTrader must remain connected to the broker to ensure that the setup runs appropriately, as the ORO order links can not be managed via the brokers API. If the connection to the broker is not running, an unwanted counterposition could be opened. This pertains to all broker APIs.**

<figure><img src="https://docs.agenatrader.com/~gitbook/image?url=https%3A%2F%2F2805764894-files.gitbook.io%2F%7E%2Ffiles%2Fv0%2Fb%2Fgitbook-legacy-files%2Fo%2Fassets%252F-MKZSsJBtSP9L4sqIe_q%252F-MQkex8D1n6xxtVa0DJS%252F-MQliCHJvxFCcfeJGVfX%252FFixLevel%25203.png%3Falt%3Dmedia%26token%3Db4480ee3-97c9-4581-9b0f-0a7b4d4adf06&#x26;width=768&#x26;dpr=4&#x26;quality=100&#x26;sign=86a8219f&#x26;sv=1" alt=""><figcaption></figcaption></figure>

**Example FixTick3Level**

<figure><img src="https://docs.agenatrader.com/~gitbook/image?url=https%3A%2F%2F2805764894-files.gitbook.io%2F%7E%2Ffiles%2Fv0%2Fb%2Fgitbook-legacy-files%2Fo%2Fassets%252F-MKZSsJBtSP9L4sqIe_q%252F-MQkex8D1n6xxtVa0DJS%252F-MQliH0Iua0tVgHVUE6m%252Ftargetescorts_example.png%3Falt%3Dmedia%26token%3D3d7b859d-7f07-4ab3-bb43-92e1e00b802c&#x26;width=768&#x26;dpr=4&#x26;quality=100&#x26;sign=279b7938&#x26;sv=1" alt=""><figcaption></figcaption></figure>

**The following target setups are available:**

* MultipleRisk1Level: places a target on the price level that corresponds to the distance between the stop and entry (R or 1R) as adjusted by a multiplier.

<figure><img src="https://docs.agenatrader.com/~gitbook/image?url=https%3A%2F%2F2805764894-files.gitbook.io%2F%7E%2Ffiles%2Fv0%2Fb%2Fgitbook-legacy-files%2Fo%2Fassets%252F-MKZSsJBtSP9L4sqIe_q%252F-MQkex8D1n6xxtVa0DJS%252F-MQliKsXBaFjmMp_fnRl%252FRisk%281%29.jpg%3Falt%3Dmedia%26token%3D8e1e7bd9-1e96-43b1-a214-6d164fa104a6&#x26;width=768&#x26;dpr=4&#x26;quality=100&#x26;sign=857478ef&#x26;sv=1" alt=""><figcaption></figcaption></figure>

* MultipleRisk2Levels: sets TWO targets on the price level that corresponds to the distance between the stop and entry (R or 1R) as adjusted by the R multiplier (different for each target). Additionally, you can set the value allocation between both targets.

<figure><img src="https://docs.agenatrader.com/~gitbook/image?url=https%3A%2F%2F2805764894-files.gitbook.io%2F%7E%2Ffiles%2Fv0%2Fb%2Fgitbook-legacy-files%2Fo%2Fassets%252F-MKZSsJBtSP9L4sqIe_q%252F-MQkex8D1n6xxtVa0DJS%252F-MQliOYdhIVc7SOuIyw4%252FRisk%282%29.jpg%3Falt%3Dmedia%26token%3De8f17409-4bd6-4c43-a6ef-3e818084bf60&#x26;width=768&#x26;dpr=4&#x26;quality=100&#x26;sign=e57dac66&#x26;sv=1" alt=""><figcaption></figcaption></figure>

* MultipleRisk3Levels: sets THREE targets on the price level that corresponds to the distance between the stop and entry (R or 1R) as adjusted by the R multiplier (different for each target).
* NoTarget: does not place a target. This method can be used if you prefer to submit only trailing stops.
* Pivot1Level: uses the next pivot level as a target.

<figure><img src="https://docs.agenatrader.com/~gitbook/image?url=https%3A%2F%2F2805764894-files.gitbook.io%2F%7E%2Ffiles%2Fv0%2Fb%2Fgitbook-legacy-files%2Fo%2Fassets%252F-MKZSsJBtSP9L4sqIe_q%252F-MQkex8D1n6xxtVa0DJS%252F-MQliSZKR0_WYyHyAaSS%252FRisk%283%29.jpg%3Falt%3Dmedia%26token%3Dce413a38-3278-4a9e-afe6-53d1c243527e&#x26;width=768&#x26;dpr=4&#x26;quality=100&#x26;sign=bc21491&#x26;sv=1" alt=""><figcaption></figcaption></figure>

* Pivot2Levels: uses the next two pivot levels as targets.

<figure><img src="https://docs.agenatrader.com/~gitbook/image?url=https%3A%2F%2F2805764894-files.gitbook.io%2F%7E%2Ffiles%2Fv0%2Fb%2Fgitbook-legacy-files%2Fo%2Fassets%252F-MKZSsJBtSP9L4sqIe_q%252F-MQkex8D1n6xxtVa0DJS%252F-MQliXp2TTo1XwKJeyP4%252FRisk%284%29.jpg%3Falt%3Dmedia%26token%3D92b9754f-e9b3-4d7a-8a39-f18bd468af07&#x26;width=768&#x26;dpr=4&#x26;quality=100&#x26;sign=c2ad43eb&#x26;sv=1" alt=""><figcaption></figcaption></figure>

* Pivot3Levels: uses the next three pivot levels as targets.

**NOTE!** The search for pivot levels is limited to the number of candles loaded within the chart.

<figure><img src="https://docs.agenatrader.com/~gitbook/image?url=https%3A%2F%2F2805764894-files.gitbook.io%2F%7E%2Ffiles%2Fv0%2Fb%2Fgitbook-legacy-files%2Fo%2Fassets%252F-MKZSsJBtSP9L4sqIe_q%252F-MQkex8D1n6xxtVa0DJS%252F-MQliaiu_KECrYinWrzg%252FtargetEscortCandles.png%3Falt%3Dmedia%26token%3D3e81d3d4-86bb-4fe0-a2ea-de533f96d06c&#x26;width=768&#x26;dpr=4&#x26;quality=100&#x26;sign=75ab286&#x26;sv=1" alt=""><figcaption></figcaption></figure>

### TargetEscorts parameters <a href="#targetescorts_parameters" id="targetescorts_parameters"></a>

* MultipleRisk1Level
  * Parameter RisksToLevel1 defines the R multiplier for calculation of the target price level.
* MultipleRisk2Levels
  * Parameter ProfitPercentageTarget1 sets the percent by which the opened position will be decreased after execution of the 1st target.
  * Parameter ProfitPercentageTarget2 sets the percent by which the opened position will be decreased after execution of the 2nd target.
  * Parameter RisksToLevel1 defines the R multiplier for calculation of the 1st target price level.
  * Parameter RisksToLevel2 defines the R multiplier for calculation of the 2nd target price level.
* MultipleRisk3Levels
  * Parameter ProfitPercentageTarget1 sets the percent by which the running position will be decreased after execution of the 1st target.
  * Parameter ProfitPercentageTarget2 sets the percent by which the running position will be decreased after execution of the 2nd target.
  * Parameter ProfitPercentageTarget3 sets the percent by which the running position will be decreased after execution of the 3rd target.
  * Parameter RisksToLevel1 defines the R multiplier for calculation of the 1st target price level.
  * Parameter RisksToLevel2 defines the R multiplier for calculation of the 2nd target price level.
  * Parameter RisksToLevel2 defines the R multiplier for calculation of the 3rd target price level.
* Pivot1Level
  * Parameter MinRisksToFirstTarget defines the minimal R multiplier for calculation of the 1st target price level. If the calculated 1st target level does not reach a pivot level then the next closest pivot level will be used for the target.
  * ProfitPercentageTarget1: leaves the remaining amount opened if less than 100% for this parameter has been selected.
* Pivot2Levels
  * Parameter MinRisksBetweenTargets defines the R multiplier between the 1st and 2nd targets. If no further pivot level is available then the R multiplier will be used for calculation of the 2nd target.
  * Parameter MinRisksToFirstTarget defines the minimal R multiplier for calculation of the 1st target price level. If the calculated 1st target level does not reach a pivot level then the next closest pivot level will be used for the target.
  * Parameter ProfitPercentageTarget1 sets the percent by which the opened position will be decreased after execution of the 1st target.
  * Parameter ProfitPercentageTarget2 sets the percent by which the opened position will be decreased after execution of the 2nd target.
* Pivot3Levels
  * Parameter MinRisksBetweenTargets defines the R multiplier between the 1st and 2nd targets. If no further pivot level is available then the R multiplier will be used for calculation of the 2nd target.
  * Parameter MinRisksToFirstTarget defines the minimal R multiplier for calculation of the 1st target price level. If the calculated 1st target level does not reach a pivot level then the next closest pivot level will be used for the target.
  * Parameter ProfitPercentageTarget1 sets the percent by which the opened position will be decreased after execution of the 1st target.
  * Parameter ProfitPercentageTarget2 sets the percent by which the opened position will be decreased after execution of the 2nd target.
  * ПParameter ProfitPercentageTarget3 sets the percent by which the opened position will be decreased after execution of the 3rd target.

**Example for Pivot2Levels**

If there is not enough historical data to find appropriate pivot levels, or should the pivot levels be placed in "all time high" areas, AgenaTrader will use the distance "MinRisksBetweenTargets" for the next target. The following image demonstrates this example:

<figure><img src="https://docs.agenatrader.com/~gitbook/image?url=https%3A%2F%2F2805764894-files.gitbook.io%2F%7E%2Ffiles%2Fv0%2Fb%2Fgitbook-legacy-files%2Fo%2Fassets%252F-MKZSsJBtSP9L4sqIe_q%252F-MQkex8D1n6xxtVa0DJS%252F-MQlif2peUNxS7BjXFDE%252FTargetEscortPivot2L2.png%3Falt%3Dmedia%26token%3D0459e071-4cc2-4cba-8239-93190e90a290&#x26;width=768&#x26;dpr=4&#x26;quality=100&#x26;sign=ce5f113&#x26;sv=1" alt=""><figcaption></figcaption></figure>

## Trade tab <a href="#setup_escort__trade_tab" id="setup_escort__trade_tab"></a>

The **Trade tab** consists of:

* Trade box
* Strategy box

<figure><img src="https://docs.agenatrader.com/~gitbook/image?url=https%3A%2F%2F2805764894-files.gitbook.io%2F%7E%2Ffiles%2Fv0%2Fb%2Fgitbook-legacy-files%2Fo%2Fassets%252F-MKZSsJBtSP9L4sqIe_q%252F-MQkex8D1n6xxtVa0DJS%252F-MQlikPmSljRlsfcMjOF%252FOrderEscort_trading_pad1.png%3Falt%3Dmedia%26token%3Da0155971-f2f0-4e50-8cd1-118369a478c8&#x26;width=768&#x26;dpr=4&#x26;quality=100&#x26;sign=bf6a4bee&#x26;sv=1" alt=""><figcaption></figcaption></figure>

### Trade box <a href="#trade_box" id="trade_box"></a>

The **Trade box** displays relevant information on the actual trade parameters such as: entry price, stops, order and position size, and the current risk.

<figure><img src="https://docs.agenatrader.com/~gitbook/image?url=https%3A%2F%2F2805764894-files.gitbook.io%2F%7E%2Ffiles%2Fv0%2Fb%2Fgitbook-legacy-files%2Fo%2Fassets%252F-MKZSsJBtSP9L4sqIe_q%252F-MQkex8D1n6xxtVa0DJS%252F-MQlio6kznkp2WcBZg_P%252FOrderEscort_tradeBox.png%3Falt%3Dmedia%26token%3Dcc02df89-1018-4fb1-84b9-2be3340257bc&#x26;width=768&#x26;dpr=4&#x26;quality=100&#x26;sign=9c14f8d8&#x26;sv=1" alt=""><figcaption></figcaption></figure>

**Manual mode**

When the manual mode is activated, this will allow you to place discretionary trades and input corrections to the automatic setups of AgenaTrader++ (plusplus).

This can basically be done in 3 steps:

* Check the **Manual Mode** checkbox by left click (the background color of the **Order Escort** will still be grey at this point)
* Select the **Buy** or **Sell** option
* Select parameters for the entry, initial stop, hard trail stop, soft trail stop and target.

*The advantage of manual mode is that you can set your own setup and submit trades, but AgenaTrader++ will continue to fully monitor your risk and automatically manage your trades.*

<figure><img src="https://docs.agenatrader.com/~gitbook/image?url=https%3A%2F%2F2805764894-files.gitbook.io%2F%7E%2Ffiles%2Fv0%2Fb%2Fgitbook-legacy-files%2Fo%2Fassets%252F-MKZSsJBtSP9L4sqIe_q%252F-MQkex8D1n6xxtVa0DJS%252F-MQliry2p7voZXn_FyK3%252FOrderEscort_ManualMode.png%3Falt%3Dmedia%26token%3D4e6c490b-b1d6-4fd0-bf5e-0a590aff2ade&#x26;width=768&#x26;dpr=4&#x26;quality=100&#x26;sign=214a2cb5&#x26;sv=1" alt=""><figcaption></figcaption></figure>

If you do not want to rely on the automatic entries, you can trade exclusively in manual mode. The only difference from the fully automated mode is that entries based on signals will not be suggested.

You can also bring up the Setup Builder window and define the manual mode setup within the **Configuration tab**.

<figure><img src="https://docs.agenatrader.com/~gitbook/image?url=https%3A%2F%2F2805764894-files.gitbook.io%2F%7E%2Ffiles%2Fv0%2Fb%2Fgitbook-legacy-files%2Fo%2Fassets%252F-MKZSsJBtSP9L4sqIe_q%252F-MQkex8D1n6xxtVa0DJS%252F-MQlixZThFCEjP9nw57I%252FBlockTrade.png%3Falt%3Dmedia%26token%3D315d8206-8313-4305-8a41-8118d3ac604d&#x26;width=768&#x26;dpr=4&#x26;quality=100&#x26;sign=4f9f4bc3&#x26;sv=1" alt=""><figcaption></figcaption></figure>

**Entry price**

The **Entry price** field contains the suggested entry price. As long as the order has not been submitted to the market, the entry price can be changed.

<figure><img src="https://docs.agenatrader.com/~gitbook/image?url=https%3A%2F%2F2805764894-files.gitbook.io%2F%7E%2Ffiles%2Fv0%2Fb%2Fgitbook-legacy-files%2Fo%2Fassets%252F-MKZSsJBtSP9L4sqIe_q%252F-MQkex8D1n6xxtVa0DJS%252F-MQlj0VWR5ppc636qWBc%252FOrderEscort_EntryPrice.png%3Falt%3Dmedia%26token%3D26d9b17f-b02a-420d-93eb-f21454b2d063&#x26;width=768&#x26;dpr=4&#x26;quality=100&#x26;sign=3973446a&#x26;sv=1" alt=""><figcaption></figcaption></figure>

You can edit the price level in one of the following ways:

* Move the chart trader bar for the entry order directly on the chart
* Enter a new price manually inside the **Entry price** field
* Increase or decrease the price level tick by tick to the next high or low using the up and down arrow keys.
* Use the drop-down list to select a price from among the 30 possible price levels in both directions.

**Order type**

There are two possible order types: buy or sell order. You will only be able to select one of these order types if the manual mode is activated. This function is not available for automatically generated, signal-based trade suggestions.

<figure><img src="https://docs.agenatrader.com/~gitbook/image?url=https%3A%2F%2F2805764894-files.gitbook.io%2F%7E%2Ffiles%2Fv0%2Fb%2Fgitbook-legacy-files%2Fo%2Fassets%252F-MKZSsJBtSP9L4sqIe_q%252F-MQkex8D1n6xxtVa0DJS%252F-MQlj5s6lh8lbV1kjcY1%252FOrderEscort_OrderType.png%3Falt%3Dmedia%26token%3D92dc34b5-ffe4-42ba-adc7-445d54e84a47&#x26;width=768&#x26;dpr=4&#x26;quality=100&#x26;sign=9ff2bebb&#x26;sv=1" alt=""><figcaption></figcaption></figure>

**$ button**

Left clicking on the **"$"** button will reset a setup regardless of the setup type (manual or signal-based). All parameters will be reverted to their default settings.

<figure><img src="https://docs.agenatrader.com/~gitbook/image?url=https%3A%2F%2F2805764894-files.gitbook.io%2F%7E%2Ffiles%2Fv0%2Fb%2Fgitbook-legacy-files%2Fo%2Fassets%252F-MKZSsJBtSP9L4sqIe_q%252F-MQkex8D1n6xxtVa0DJS%252F-MQljBIj8Zca1s0wibgT%252FOrderEscort_%2524Button.png%3Falt%3Dmedia%26token%3D0772ae9a-1c62-4d11-8288-b20c4862e8bb&#x26;width=768&#x26;dpr=4&#x26;quality=100&#x26;sign=8a07a5fd&#x26;sv=1" alt=""><figcaption></figcaption></figure>

**Order size**

The **Order size** field displays the proposed order size that has been calculated using risk parameters.

*The* [*order size*](https://docs.agenatrader.com/create-your-own-trading-strategy/risk-and-money-management) *is based on the following parameters:*

* the difference between entry price and hard stop
* the absolute risk
* the initial risk
* the currency conversion factor (if account currency is different from the currency of the traded instrument)

The suggested order size is always rounded to the next possible whole number. The rounding settings can be changed within the [Global Configuration](https://docs.agenatrader.com/tools/configuration-escort).

<figure><img src="https://docs.agenatrader.com/~gitbook/image?url=https%3A%2F%2F2805764894-files.gitbook.io%2F%7E%2Ffiles%2Fv0%2Fb%2Fgitbook-legacy-files%2Fo%2Fassets%252F-MKZSsJBtSP9L4sqIe_q%252F-MQkex8D1n6xxtVa0DJS%252F-MQljRM5aX98e3j7jNEF%252FOrderEscort_OrderSize1.png%3Falt%3Dmedia%26token%3D76db9079-a293-416f-a73d-5a199c020a88&#x26;width=768&#x26;dpr=4&#x26;quality=100&#x26;sign=b4916f36&#x26;sv=1" alt=""><figcaption></figcaption></figure>

**Setting the order size above the suggested level (can only be done from within the Order Escort)** If you wish to set the order size above the proposed level, manually enter the desired order size or change the amount using the up and down arrow keys. Once entered, the background color will change to red and will no longer be adjusted if the stop or entry orders are edited.

<figure><img src="https://docs.agenatrader.com/~gitbook/image?url=https%3A%2F%2F2805764894-files.gitbook.io%2F%7E%2Ffiles%2Fv0%2Fb%2Fgitbook-legacy-files%2Fo%2Fassets%252F-MKZSsJBtSP9L4sqIe_q%252F-MQkex8D1n6xxtVa0DJS%252F-MQljUtmznsNdKrWUSsD%252FOrderEscort_OrderSize2.png%3Falt%3Dmedia%26token%3D7f7f3d23-7d4f-4ae3-9fda-ff18d308164f&#x26;width=768&#x26;dpr=4&#x26;quality=100&#x26;sign=466b14d4&#x26;sv=1" alt=""><figcaption></figcaption></figure>

If you want AgenaTrader++ (plusplus) to calculate the order size automatically according to the risk-specific criteria, double click in this field and move the entry / stop line inside the chart.

**Position size**

The position size displays the size of the running positions and corresponds to the order size.

For automatically suggested trades in which the order size is set above the proposed size, the position size will be calculated as: *Position size = initially proposed position size + order amount set above the proposed size.*

**HardStop / HardRisk**

**HardStop**

The **H-Trail** field displays the price level at which the trade will be 100% secured, i.e. the price of the [Initial stop](https://docs.agenatrader.com/create-your-own-trading-strategy/setup-escort#Initial_stop) and [HardTrail stop](https://docs.agenatrader.com/create-your-own-trading-strategy/setup-escort#Hard_Trail_stop).

You can edit the price level in one of the following ways:

* Move the chart trader bar for the initial stop order (hard trail stop order) directly on the chart
* Enter a new price manually inside the **H-Trail** field
* Increase or decrease the price level tick by tick to the next high or low using the up and down arrow keys
* Use the drop-down list to select a price among the 30 possible price levels in both directions.

<figure><img src="https://docs.agenatrader.com/~gitbook/image?url=https%3A%2F%2F2805764894-files.gitbook.io%2F%7E%2Ffiles%2Fv0%2Fb%2Fgitbook-legacy-files%2Fo%2Fassets%252F-MKZSsJBtSP9L4sqIe_q%252F-MQkex8D1n6xxtVa0DJS%252F-MQljbV4sHEdo3wJ8nn0%252FOrderEscort_HardStop.png%3Falt%3Dmedia%26token%3Dac783ea5-959d-4035-8020-3046db0ebc56&#x26;width=768&#x26;dpr=4&#x26;quality=100&#x26;sign=42ec7902&#x26;sv=1" alt=""><figcaption></figcaption></figure>

**HardRisk**

The **H-Risk** field displays the absolute value that is at risk during the trading (in P\&L currency).

*Meaning of the background color on the "H-Risk" field:*

* red: a negative risk exists for the current trade;
* green: the trade is at the positive risk level.

**Positive risk level** means that the hard stop is above the entry price for long positions and below the entry price for short positions.

The **hard risk** already accounts for potential slippage and spread costs (see [calculation](https://docs.agenatrader.com/create-your-own-trading-strategy/at-plusplus-manager#at-plus-plus-risk-management) of spread + slippage = 2x spread). This may impact the risk negatively or positively depending on the order execution time. If the background color changes to red, then the setup is breaking the risk parameters. This can happen due to [lot size rounding](https://docs.agenatrader.com/create-your-own-trading-strategy/at-plusplus-manager#at-plus-plus-order-rounding). If rounding is not the primary cause for this, we recommend that you inspect the trade suggestion in more detail.

<figure><img src="https://docs.agenatrader.com/~gitbook/image?url=https%3A%2F%2F2805764894-files.gitbook.io%2F%7E%2Ffiles%2Fv0%2Fb%2Fgitbook-legacy-files%2Fo%2Fassets%252F-MKZSsJBtSP9L4sqIe_q%252F-MQkex8D1n6xxtVa0DJS%252F-MQljgIFqmoOnSi9NlBU%252FOrderEscort_HardRisk.png%3Falt%3Dmedia%26token%3D34a317fe-84f9-4648-a45e-f74ee31beb3f&#x26;width=768&#x26;dpr=4&#x26;quality=100&#x26;sign=99795d15&#x26;sv=1" alt=""><figcaption></figcaption></figure>

**Soft Stop / Soft Risk**

**SoftStop**

The **Soft Stop** is the actual stop price of the [**Soft Trail**](https://docs.agenatrader.com/create-your-own-trading-strategy/setup-escort#Soft_Trail) **stop**.

**Soft Risk** The **Soft Risk** is calculated the same way as the **Hard Risk**, but it is based on the **Soft Stop**. The **Soft Risk** is merely a reference value, since in the case that the soft stop is broken, the actual risk only materializes due to the **Hard Stop** order being executed.

The **Soft Stop**/**Soft Risk** and **Hard Stop**/**Hard Risk** are equal until the position is opened.

<figure><img src="https://docs.agenatrader.com/~gitbook/image?url=https%3A%2F%2F2805764894-files.gitbook.io%2F%7E%2Ffiles%2Fv0%2Fb%2Fgitbook-legacy-files%2Fo%2Fassets%252F-MKZSsJBtSP9L4sqIe_q%252F-MQkex8D1n6xxtVa0DJS%252F-MQljl0rIeIZzoh6nAaa%252FOrderEscort_SoftStop.png%3Falt%3Dmedia%26token%3D0e99638d-8ac0-4656-bc87-70bcbb906ef4&#x26;width=768&#x26;dpr=4&#x26;quality=100&#x26;sign=3f842ad4&#x26;sv=1" alt=""><figcaption></figcaption></figure>

Once an order is submitted the **Soft Stop**/**Soft Risk** values will deviate from the **Hard Stop**/**Hard Risk** values.

<figure><img src="https://docs.agenatrader.com/~gitbook/image?url=https%3A%2F%2F2805764894-files.gitbook.io%2F%7E%2Ffiles%2Fv0%2Fb%2Fgitbook-legacy-files%2Fo%2Fassets%252F-MKZSsJBtSP9L4sqIe_q%252F-MQkex8D1n6xxtVa0DJS%252F-MQljou0d0oG7kf4s_6R%252FOrderEscort_SoftRisk.png%3Falt%3Dmedia%26token%3D047f8a28-bdc8-44fc-9027-6743560574ef&#x26;width=768&#x26;dpr=4&#x26;quality=100&#x26;sign=531f49b9&#x26;sv=1" alt=""><figcaption></figcaption></figure>

### Strategy box <a href="#strategy_box" id="strategy_box"></a>

The strategy box suggests a setup based on selected or calculated [entry signals](https://docs.agenatrader.com/create-your-own-trading-strategy/setup-escort#entryescorts).

You can change the strategy parameters:

1. Before placing the trade on the market: to edit [stop and target methods](https://docs.agenatrader.com/create-your-own-trading-strategy/setup-escort#Setup_Escort__Activation_tab) inside the **Order Escort**;
2. When the trade is running: to adjust the soft trail stop and the hard trail stop as well as targets (until the first target has been met).

<figure><img src="https://docs.agenatrader.com/~gitbook/image?url=https%3A%2F%2F2805764894-files.gitbook.io%2F%7E%2Ffiles%2Fv0%2Fb%2Fgitbook-legacy-files%2Fo%2Fassets%252F-MKZSsJBtSP9L4sqIe_q%252F-MQkex8D1n6xxtVa0DJS%252F-MQljtZNavpl2pl4lAb2%252Fstrategy_box_main.png%3Falt%3Dmedia%26token%3Dd9a5a6a3-536b-4b4b-8ee0-a0dc2dd044b2&#x26;width=768&#x26;dpr=4&#x26;quality=100&#x26;sign=3041dad8&#x26;sv=1" alt=""><figcaption></figcaption></figure>

**Entry**

Once in manual trade mode (semi-automated discretionary trading) the EntryEscort will allow you to select the strategy setup.

<figure><img src="https://docs.agenatrader.com/~gitbook/image?url=https%3A%2F%2F2805764894-files.gitbook.io%2F%7E%2Ffiles%2Fv0%2Fb%2Fgitbook-legacy-files%2Fo%2Fassets%252F-MKZSsJBtSP9L4sqIe_q%252F-MQkex8D1n6xxtVa0DJS%252F-MQljxWH2U-c0JLBTFMc%252Fstrategy_box_manualEntry.png%3Falt%3Dmedia%26token%3D340a318b-bed3-49d8-8ab8-c61b31ef892c&#x26;width=768&#x26;dpr=4&#x26;quality=100&#x26;sign=572adf6c&#x26;sv=1" alt=""><figcaption></figcaption></figure>

Manual mode will display the pre-initialized Entry Escort with the appropriate **Stop and Target Escorts**, which you can use to keep AgenaTrader's stop / target logic. If the [Entry Escort](https://docs.agenatrader.com/create-your-own-trading-strategy/setup-escort#Setup_Escort__Activation_tab) has been suggested a trade in accordance with the [Stop and Target Escort](https://docs.agenatrader.com/create-your-own-trading-strategy/setup-escort#Setup_Escort__Activation_tab) signals, then entries in this field cannot be changed.

**Initial stop**

The initial stop is calculated using the [initial stop](https://docs.agenatrader.com/create-your-own-trading-strategy/setup-escort#Setup_Escort__Parameters_tab) method. The image below shows the initial stop based on an ATR (average true range) stop. If the **Hard Trail** stop is responsible for the stop order in the running trade, AgenaTrader will simultaneously display the **Hard Trail** stop and the initial stop order (PivotSlow).

<figure><img src="https://docs.agenatrader.com/~gitbook/image?url=https%3A%2F%2F2805764894-files.gitbook.io%2F%7E%2Ffiles%2Fv0%2Fb%2Fgitbook-legacy-files%2Fo%2Fassets%252F-MKZSsJBtSP9L4sqIe_q%252F-MQkex8D1n6xxtVa0DJS%252F-MQlk1jn62FIvn1EUXp_%252Finitial_stop_custom.png%3Falt%3Dmedia%26token%3D7e3509e2-35f1-40e0-920c-84d14cecb194&#x26;width=768&#x26;dpr=4&#x26;quality=100&#x26;sign=dff0d977&#x26;sv=1" alt=""><figcaption></figcaption></figure>

The calculated order size is based on:

* the initial stop
* the defined risk

Thus, the initial stop should be placed within close distance to the Hard Trail stop.

If you wish to change the initial stop calculations, please read more about this in the [**Risk and Money management**](https://docs.agenatrader.com/create-your-own-trading-strategy/risk-and-money-management) section.

**Hard Trail stop**

**Hard stops** and **Hard Trail stops** are the [stop methods](https://docs.agenatrader.com/create-your-own-trading-strategy/setup-escort#Setup_Escort__Configuration_tab) that are applied to the stop orders. Basically, a **Hard Stop** is intended to be used for catastrophic scenarios. The **Soft Stop** should retain the corresponding setup logic.

<figure><img src="https://docs.agenatrader.com/~gitbook/image?url=https%3A%2F%2F2805764894-files.gitbook.io%2F%7E%2Ffiles%2Fv0%2Fb%2Fgitbook-legacy-files%2Fo%2Fassets%252F-MKZSsJBtSP9L4sqIe_q%252F-MQkex8D1n6xxtVa0DJS%252F-MQlk7SQm9NhM94Lqw66%252FHardTrailStop_eng.png%3Falt%3Dmedia%26token%3Dfec517fd-545a-4f96-82e0-6966cc4a4db0&#x26;width=768&#x26;dpr=4&#x26;quality=100&#x26;sign=5851dcd3&#x26;sv=1" alt=""><figcaption></figcaption></figure>

**Hard Stop and Soft Stop are connected to each other by the following logic.**

If the closing price has crossed a **Soft Stop**, then **Hard Stop** will react and move:

* below the low of the candle that caused the crossing of the **Soft Stop** (in a long position) or
* above the high of the candle that caused the crossing of the **Soft Stop** (in a short position).

If the crossing of the **Soft Stop** was faked, then the stop will not be triggered, but if the break is confirmed and the price move is sustainable, then the **Hard stop** will be triggered and the trade closed.

You can replace the **Hard Trail Stop** during the trade in one of these two ways:

* via the Order Escort
* by pressing the red "X" box within the chart trader bar, moving it and then confirming the new hard trail stop by left clicking on the checkmark symbol.

It is also possible to overrule the **Hard Trail Stop** for the current period. AT++ will continue to perform the calculations for the stop price level and set it at the end of the period.

**Soft Trail**

This is a [stop](https://docs.agenatrader.com/create-your-own-trading-strategy/setup-escort#Setup_Escort__Parameters_tab) that does not close a trade immediately after the stop is crossed by a closing price.

Once the **Soft Stop** is crossed by the closing price, the **Hard Stop** will be triggered and moved:

* below the low of the candle that caused the crossing of the **Soft Stop** (in a long position) or
* above the high of the candle that caused the crossing of the **Soft Stop** (in a short position).

You can replace the **Soft Stop** during the trade in one of these two ways:

* via the Order Escort
* by pressing the red "X" box within the chart trader bar, moving it and then confirming the new hard trail stop by left clicking on the checkmark symbol.

Furthermore, **Soft Trail stops** stops must be triggered faster than **Hard Trail stops**, therefore they cannot be placed at the same level.

**Targets**

You can select various [target strategies](https://docs.agenatrader.com/create-your-own-trading-strategy/setup-escort#Setup_Escort__Parameters_tab) within the **Target** field.

<figure><img src="https://docs.agenatrader.com/~gitbook/image?url=https%3A%2F%2F2805764894-files.gitbook.io%2F%7E%2Ffiles%2Fv0%2Fb%2Fgitbook-legacy-files%2Fo%2Fassets%252F-MKZSsJBtSP9L4sqIe_q%252F-MQkex8D1n6xxtVa0DJS%252F-MQlkDqjBHS8zOMJteQv%252FTargets.jpg%3Falt%3Dmedia%26token%3Dfdd37520-6c04-42a3-8c17-e103e6f11d6c&#x26;width=768&#x26;dpr=4&#x26;quality=100&#x26;sign=f431d07e&#x26;sv=1" alt=""><figcaption></figcaption></figure>

**Freeze**

If you check the **Freeze** checkbox, then suggested orders will no longer be placed on the chart when a signal occurs.

**Initial risk (% field)**

To access the initial risk account settings, select the **Tools** main menu followed by the **Global Configuration** menu item. In this window, select the **General** and **Account tabs**. The **Risk/Trade** option allows you to set the percentage of the account that you wish to risk during the trade.

The order size calculation is based on:

* the gap between the entry and stop order,
* the valuation of the instrument,
* the instrument/account currency pairs,
* and the buying power.

If you place an order with the deviating [risk and money management settings](https://docs.agenatrader.com/create-your-own-trading-strategy/risk-and-money-management) in the **Global Configuration**, it will be "overruled" (order size is set above the proposed level).

<figure><img src="https://docs.agenatrader.com/~gitbook/image?url=https%3A%2F%2F2805764894-files.gitbook.io%2F%7E%2Ffiles%2Fv0%2Fb%2Fgitbook-legacy-files%2Fo%2Fassets%252F-MKZSsJBtSP9L4sqIe_q%252F-MQkex8D1n6xxtVa0DJS%252F-MQlkHzA_JYnv21kbwXI%252FRiskManagement.png%3Falt%3Dmedia%26token%3D95d3922d-98c6-464f-81af-2e4bd36bdc49&#x26;width=768&#x26;dpr=4&#x26;quality=100&#x26;sign=d021f4cb&#x26;sv=1" alt=""><figcaption></figcaption></figure>

**Halt**

If you check the **Halt** checkbox, the **Hard Trail stop** / **Soft Trail stop** will no longer be triggered at the appropriate level.

This is also true for situations in which the **Soft Trail stop** is crossed by the closing price.

<figure><img src="https://docs.agenatrader.com/~gitbook/image?url=https%3A%2F%2F2805764894-files.gitbook.io%2F%7E%2Ffiles%2Fv0%2Fb%2Fgitbook-legacy-files%2Fo%2Fassets%252F-MKZSsJBtSP9L4sqIe_q%252F-MQkex8D1n6xxtVa0DJS%252F-MQlkM4RikVOmJPoGOFH%252FStrategy_Escort_Halt.png%3Falt%3Dmedia%26token%3D3880cc9f-b228-4915-9bb6-cad5904a0f6f&#x26;width=768&#x26;dpr=4&#x26;quality=100&#x26;sign=4d25d12d&#x26;sv=1" alt=""><figcaption></figcaption></figure>

{% hint style="info" %}
**Important!** If you activate checkbox halt for **Hard Trail stop** settings for BreakEvenAfterN... will be disabled. Please find additional information about BreakEvenAfterN... on page [**Setup Builder: Parameters tab**](https://docs.agenatrader.com/create-your-own-trading-strategy/setup-escort#Setup_Escort__Parameters_tab)
{% endhint %}


# Signal Builder

**Signal Builder** allows you to create complex scans for trading signals with just a click.

This tool enables you to combine several different conditions with each other without any previous programming experience.

<figure><img src="/files/eKuD3swv3d7EZlQZ6EUN" alt=""><figcaption></figcaption></figure>

*The Signal Builder has two modes:*

* **Signal Builder: Simple mode**: allows you to perform basic logical **"AND"** concatenations. This is a part of the basic trading platform;
* **Signal Builder: Advanced mode**: is available when using the AgenaTrader++ (Andromeda version) platform. Allows more complex combinations such as **"AND/OR/XOR"** as well as the creation of expressions in brackets. The complexity is comparable to real programming but much more understandable, allowing you to create conditions with just a few clicks.

## Simple mode <a href="#simple-mode" id="simple-mode"></a>

To access the **Signal Builder**, select **Tools** from the main menu followed by the **Signal Builder** menu item.

Within the **Signal Builder window** each condition can be defined as a long (signal in the scanner is green-colored) or short (signal in the scanner is red-colored) signal.

<figure><img src="https://docs.agenatrader.com/~gitbook/image?url=https%3A%2F%2F2805764894-files.gitbook.io%2F%7E%2Ffiles%2Fv0%2Fb%2Fgitbook-legacy-files%2Fo%2Fassets%252F-MKZSsJBtSP9L4sqIe_q%252F-MQHWF5WxWJEmttyqWZG%252F-MQI-8-eOgf3Bw7hh4C-%252FconditionEscortLongShort.png%3Falt%3Dmedia%26token%3D7ea96a42-146d-47ef-aab5-8d5cd9e6131a&#x26;width=768&#x26;dpr=4&#x26;quality=100&#x26;sign=64ab3525&#x26;sv=1" alt=""><figcaption></figcaption></figure>

You can create a condition for the entry, stop or target. This will determine in which column within the **Setup Builder** your condition will be shown.

<figure><img src="https://docs.agenatrader.com/~gitbook/image?url=https%3A%2F%2F2805764894-files.gitbook.io%2F%7E%2Ffiles%2Fv0%2Fb%2Fgitbook-legacy-files%2Fo%2Fassets%252F-MKZSsJBtSP9L4sqIe_q%252F-MQHWF5WxWJEmttyqWZG%252F-MQI-CY-j9HjQnkhIagm%252FconditionEscortEntryExit.png%3Falt%3Dmedia%26token%3D1032ee7b-a036-443d-9395-4a73debe0d80&#x26;width=768&#x26;dpr=4&#x26;quality=100&#x26;sign=f9f7c536&#x26;sv=1" alt=""><figcaption></figcaption></figure>

In addition, you may select the priority for your condition. The higher condition ranking means it will display first according to lower-ranking conditions in Analyzer Column.

<figure><img src="https://docs.agenatrader.com/~gitbook/image?url=https%3A%2F%2F2805764894-files.gitbook.io%2F%7E%2Ffiles%2Fv0%2Fb%2Fgitbook-legacy-files%2Fo%2Fassets%252F-MKZSsJBtSP9L4sqIe_q%252F-MQHWF5WxWJEmttyqWZG%252F-MQI-I7pKnsw0c_NogmQ%252FRanking.png%3Falt%3Dmedia%26token%3Dc28b2841-4d1d-49bf-8b9a-3d25397ba837&#x26;width=768&#x26;dpr=4&#x26;quality=100&#x26;sign=37a64b27&#x26;sv=1" alt=""><figcaption></figcaption></figure>

As overview enhancement it is possible to create a description for each condition and a category. Conditions with a category can be found within the specified category. Conditions without category can be found under "No Category".

<figure><img src="https://docs.agenatrader.com/~gitbook/image?url=https%3A%2F%2F2805764894-files.gitbook.io%2F%7E%2Ffiles%2Fv0%2Fb%2Fgitbook-legacy-files%2Fo%2Fassets%252F-MKZSsJBtSP9L4sqIe_q%252F-MQHWF5WxWJEmttyqWZG%252F-MQI-M1e2XMHjV7GwEO6%252FNew%2520Condition.png%3Falt%3Dmedia%26token%3D1a4fae42-e2f3-481b-b649-60f95ea05149&#x26;width=768&#x26;dpr=4&#x26;quality=100&#x26;sign=cc9ef4dc&#x26;sv=1" alt=""><figcaption></figcaption></figure>

Conditions can be customized similarly to the signal indicators. The difference is that various components can be rearranged internally. To create a condition, drag and drop the elements onto the desired pane.

<figure><img src="https://docs.agenatrader.com/~gitbook/image?url=https%3A%2F%2F2805764894-files.gitbook.io%2F%7E%2Ffiles%2Fv0%2Fb%2Fgitbook-legacy-files%2Fo%2Fassets%252F-MKZSsJBtSP9L4sqIe_q%252F-MQHWF5WxWJEmttyqWZG%252F-MQI-UgA3Z7P34NdoqNw%252FConditionBlockEN.png%3Falt%3Dmedia%26token%3Daf6541b2-49ff-44ee-9d3e-d7e343cc32a5&#x26;width=768&#x26;dpr=4&#x26;quality=100&#x26;sign=5c5127b0&#x26;sv=1" alt=""><figcaption></figcaption></figure>

**Color Settings**

To set color for each feature please activate checkbox.

<figure><img src="https://docs.agenatrader.com/~gitbook/image?url=https%3A%2F%2F2805764894-files.gitbook.io%2F%7E%2Ffiles%2Fv0%2Fb%2Fgitbook-legacy-files%2Fo%2Fassets%252F-MKZSsJBtSP9L4sqIe_q%252F-MQHWF5WxWJEmttyqWZG%252F-MQI1_Vdaf2yyfrnPZ7f%252FColor_settings.png%3Falt%3Dmedia%26token%3D82781fd7-bbb2-4c76-8645-833f861cbef6&#x26;width=768&#x26;dpr=4&#x26;quality=100&#x26;sign=56ca9c0f&#x26;sv=1" alt=""><figcaption></figcaption></figure>

| Name    | Meaning                                                                                               |
| ------- | ----------------------------------------------------------------------------------------------------- |
| Arrow   | Allows to set up color and size of arrow under signal bar (visible when you put condition on a chart) |
| Bar     | Color of signal bar (visible when you put condition on a chart)                                       |
| Text    | Color of text under arrow (visible when you put condition on a chart)                                 |
| Scanner | Color of signal in Analyzer Column                                                                    |

Example:

<figure><img src="https://docs.agenatrader.com/~gitbook/image?url=https%3A%2F%2F2805764894-files.gitbook.io%2F%7E%2Ffiles%2Fv0%2Fb%2Fgitbook-legacy-files%2Fo%2Fassets%252F-MKZSsJBtSP9L4sqIe_q%252F-MQHWF5WxWJEmttyqWZG%252F-MQI1eW7XRLutbF-HgI7%252FColor.png%3Falt%3Dmedia%26token%3D2ac99eb9-2b83-42a9-923e-647782e24333&#x26;width=768&#x26;dpr=4&#x26;quality=100&#x26;sign=2850464b&#x26;sv=1" alt=""><figcaption></figcaption></figure>

**Component box**

The box at the top left contains the list of components that can be compared with each other:

* Data episodes: open, high, low, close, volume
* [Chart Toolbar: Indicators](https://docs.agenatrader.com/main/chart-area/untitled/indicators): includes standard indicators
* [Programmed indicators](https://docs.agenatrader.com/create-your-own-trading-strategy/scripting#Scripting__Programming_of_indicators): includes indicators which are programmed by users themselves.
* [Conditions](https://docs.agenatrader.com/create-your-own-trading-strategy/condition-escort): this is a complex signal combination of different indicators created within the Signal Builder
* [Programmed conditions](https://docs.agenatrader.com/create-your-own-trading-strategy/scripting#Scripting__Programming_of_conditions): includes your programmed signals
* Cumulates Indexes: includes cumulates indexes:
* Value: includes values that can be compared with each other
* Simple calculation
* [Advanced calculation](https://docs.agenatrader.com/create-your-own-trading-strategy/condition-escort#advanced-mode)

**Compare boxes**

Using these boxes you can compare (Compare box 1 and Compare box 2) components with each other logically. For example, you can compare the values of an indicator with other values and also combine different components within different time frames. For example, RSI(14) 5 minutes is bigger than RSI(10) 1 minute.

Whether or not these comparisons make sense or create any value depends on the user.

The **Operator bar** between the Compare box 1 and Compare box 2 displays the following operands:

| Logical operator              | Example 1      | Example 2      | Example 3      |
| ----------------------------- | -------------- | -------------- | -------------- |
| ">" greater than              | 2 > 1 correct  | 3 > 3 false    |                |
| "<" smaller than              | 1 < 2 correct  | 2 < 1 false    |                |
| ">=" greater than or equal to | 2 >= 1 correct | 2 >= 2 correct |                |
| "<=" smaller than or equal to | 1 <= 2 correct | 2 <= 1 false   | 2 <= 2 correct |
| "==" equal to                 | 2 == 2 correct | 2 == 3 false   |                |
| "!=" not equal to             | 1 != 2 correct | 2 != 2 false   |                |

"cr-a": cross above, means that the price crosses the indicator from bottom to top. "cr-b": cross below, means that the price crosses the indicator from top to bottom.

If you select ![Cra1](https://docs.agenatrader.com/~gitbook/image?url=https%3A%2F%2F2805764894-files.gitbook.io%2F%7E%2Ffiles%2Fv0%2Fb%2Fgitbook-legacy-files%2Fo%2Fassets%252F-MKZSsJBtSP9L4sqIe_q%252F-MQHWF5WxWJEmttyqWZG%252F-MQI25zNkgZ_9MJR1q39%252Fcra1.png%3Falt%3Dmedia%26token%3D61c411f7-8699-4100-b22d-27bd0a684c3a\&width=300\&dpr=4\&quality=100\&sign=9341bb05\&sv=1) from the operator bar, a numerical input choice ![Cra](https://docs.agenatrader.com/~gitbook/image?url=https%3A%2F%2F2805764894-files.gitbook.io%2F%7E%2Ffiles%2Fv0%2Fb%2Fgitbook-legacy-files%2Fo%2Fassets%252F-MKZSsJBtSP9L4sqIe_q%252F-MQHWF5WxWJEmttyqWZG%252F-MQI29DIZyfv7AOG99vj%252Fcra.png%3Falt%3Dmedia%26token%3D58143963-a1cd-451a-8966-618bf4cc4492\&width=300\&dpr=4\&quality=100\&sign=56dff272\&sv=1) will appear. In this cell, define within how many historical periods the comparison must be true. Then confirm the selection by clicking the **ENTER** button. The image below shows an example of a condition that is true when the closing price in the 5-minute time frame crosses the 5 minute SMA(14) line from bottom to top within the last two periods.

<figure><img src="https://docs.agenatrader.com/~gitbook/image?url=https%3A%2F%2F2805764894-files.gitbook.io%2F%7E%2Ffiles%2Fv0%2Fb%2Fgitbook-legacy-files%2Fo%2Fassets%252F-MKZSsJBtSP9L4sqIe_q%252F-MQHWF5WxWJEmttyqWZG%252F-MQI2D7zTD6dZmuFk2MS%252Fcra2.png%3Falt%3Dmedia%26token%3Dc8907a2f-70cf-4495-a34a-f9817ca9ea56&#x26;width=768&#x26;dpr=4&#x26;quality=100&#x26;sign=8a828e6b&#x26;sv=1" alt=""><figcaption></figcaption></figure>

If you select a component from the comparison box, you can use the arrow buttons to shift it up and down. Click the **Delete** button to remove it from the box.

<figure><img src="https://docs.agenatrader.com/~gitbook/image?url=https%3A%2F%2F2805764894-files.gitbook.io%2F%7E%2Ffiles%2Fv0%2Fb%2Fgitbook-legacy-files%2Fo%2Fassets%252F-MKZSsJBtSP9L4sqIe_q%252F-MQHWF5WxWJEmttyqWZG%252F-MQI2O1ND73sni5Q5VP8%252FConditionRemove.png%3Falt%3Dmedia%26token%3D35d50be7-c557-4b91-ab1d-d022fb1fcf24&#x26;width=768&#x26;dpr=4&#x26;quality=100&#x26;sign=836ae54e&#x26;sv=1" alt=""><figcaption></figcaption></figure>

### Parameter box <a href="#parameter-box" id="parameter-box"></a>

If you activate a component from the compare box 1 or compare box 2 by left clicking on it, parameter inputs will be displayed within the parameter box. You can change or edit them here.

***Time frame** section* If you enter the explicit time frame for a condition, it will be used permanently for this condition. If you do not select any time frame, then AgenaTrader will use the time frame from the scanner column or a chart, depending on the instrument.

<figure><img src="https://docs.agenatrader.com/~gitbook/image?url=https%3A%2F%2F2805764894-files.gitbook.io%2F%7E%2Ffiles%2Fv0%2Fb%2Fgitbook-legacy-files%2Fo%2Fassets%252F-MKZSsJBtSP9L4sqIe_q%252F-MQHWF5WxWJEmttyqWZG%252F-MQI2Ry-mLb0IfMrm8he%252FTimeFrame.png%3Falt%3Dmedia%26token%3D527ab02d-7c14-45dc-9d69-a8ac4208c51a&#x26;width=768&#x26;dpr=4&#x26;quality=100&#x26;sign=afd30cf7&#x26;sv=1" alt=""><figcaption></figcaption></figure>

The user can also create a condition that will become active during the specified time period. For example, a condition that would be triggered from 11 am until 4 pm.

The calculation should look as follows:

<figure><img src="https://docs.agenatrader.com/~gitbook/image?url=https%3A%2F%2F2805764894-files.gitbook.io%2F%7E%2Ffiles%2Fv0%2Fb%2Fgitbook-legacy-files%2Fo%2Fassets%252F-MKZSsJBtSP9L4sqIe_q%252F-MQHWF5WxWJEmttyqWZG%252F-MQI2Wa0RoMTB5JJwLEL%252FFeature-10529-TimeOfDay.png%3Falt%3Dmedia%26token%3D0c5e0bb3-3520-4e4d-aad2-f9fbc841f79e&#x26;width=768&#x26;dpr=4&#x26;quality=100&#x26;sign=2a5da46a&#x26;sv=1" alt=""><figcaption></figcaption></figure>

**BarTimeOfDay** value signifies the current bar time.

**Month Of Year** value signifies the current bar month. ​

In addition, the user can create a condition that will become active during the specified day of week. For example, a condition that would be triggered each Friday.

The calculation should look as follows:

<figure><img src="https://docs.agenatrader.com/~gitbook/image?url=https%3A%2F%2F2805764894-files.gitbook.io%2F%7E%2Ffiles%2Fv0%2Fb%2Fgitbook-legacy-files%2Fo%2Fassets%252F-MKZSsJBtSP9L4sqIe_q%252F-MQHWF5WxWJEmttyqWZG%252F-MQI2aFXxd1fmKSE92pr%252FConditionFrideay.jpg%3Falt%3Dmedia%26token%3Dd7a8b6bc-d611-4bca-9361-38a62f317f27&#x26;width=768&#x26;dpr=4&#x26;quality=100&#x26;sign=3847d89d&#x26;sv=1" alt=""><figcaption></figcaption></figure>

**BarDayOfWeek** value signifies the current bar day.

***Series and output values** section* Within the series input tab you can choose whether an indicator has multiple lines.

It is also possible to assign one of the following value types to the selected parameter:

* Type: Boolean -> might be 'true' or 'false'. Cound be compared only with another boolean value.
* Type: DateTime -> Type contains date & time. Might be compared only with another date & time.
* Type: Byte -> Number. Integer value ([see Wikipedia](http://en.wikipedia.org/wiki/Integer)) in range from 0 to 255. Might be compared with any other number.
* Type: Double -> Number. Decimal value. Might be compared with any other number.
* Type: Single -> Number. Decimal value. There is a difference between Single and Double in precision. Might be compared with any other number.
* Type: SByte -> Number. Integer value in range from -127 to 127. Might be compared with any other number.
* Type: Int32 -> Number. Integer value in range from -2147483648 to 2147483647. Might be compared with any other numbe

<figure><img src="https://docs.agenatrader.com/~gitbook/image?url=https%3A%2F%2F2805764894-files.gitbook.io%2F%7E%2Ffiles%2Fv0%2Fb%2Fgitbook-legacy-files%2Fo%2Fassets%252F-MKZSsJBtSP9L4sqIe_q%252F-MQHWF5WxWJEmttyqWZG%252F-MQI2dr9n6-nN3mXPqsK%252FSeries.png%3Falt%3Dmedia%26token%3D94589f3b-9eb8-423d-b5b4-737dcf2bbd03&#x26;width=768&#x26;dpr=4&#x26;quality=100&#x26;sign=58dbdd48&#x26;sv=1" alt=""><figcaption></figcaption></figure>

***Verify** button* This button is used to allow AgenaTrader to verify if the syntax is correct.

***Apply** or **OK** buttons* Once the Syntax validity has been verified and saved, click **OK** to close the dialog box.

The result of the condition is one of the following:

* True: the comparisons have succeeded;
* False: the comparisons have failed.

To save the condition you must enter a name.

### Simple calculation <a href="#signal-builder-simple-calculation" id="signal-builder-simple-calculation"></a>

The Signal Builder’s simple calculation pad allows you to perform simple calculations for a condition. A simple calculation can be recognized by the **“C:”** marking within the **Signal Builder** window.

<figure><img src="https://docs.agenatrader.com/~gitbook/image?url=https%3A%2F%2F2805764894-files.gitbook.io%2F%7E%2Ffiles%2Fv0%2Fb%2Fgitbook-legacy-files%2Fo%2Fassets%252F-MKZSsJBtSP9L4sqIe_q%252F-MQHWF5WxWJEmttyqWZG%252F-MQI2j4Jom317_8tB0yr%252FSimple%2520calculation.png%3Falt%3Dmedia%26token%3D4737e609-f3be-4df0-9986-858665dbc005&#x26;width=768&#x26;dpr=4&#x26;quality=100&#x26;sign=2eaf8d9f&#x26;sv=1" alt=""><figcaption></figcaption></figure>

It is possible to add, subtract, multiply or divide several different operands (indicators, values, data episodes etc.).

<figure><img src="https://docs.agenatrader.com/~gitbook/image?url=https%3A%2F%2F2805764894-files.gitbook.io%2F%7E%2Ffiles%2Fv0%2Fb%2Fgitbook-legacy-files%2Fo%2Fassets%252F-MKZSsJBtSP9L4sqIe_q%252F-MQHWF5WxWJEmttyqWZG%252F-MQI2mmXyC3xN_4HeRnR%252FSimpleSMA.png%3Falt%3Dmedia%26token%3D9c107666-86f8-4090-8929-58f1e1f1b782&#x26;width=768&#x26;dpr=4&#x26;quality=100&#x26;sign=7181b45c&#x26;sv=1" alt=""><figcaption></figcaption></figure>

## Advanced mode <a href="#advanced-mode" id="advanced-mode"></a>

This function is only available with the AgenaTrader Andromeda or higher versions of the trading platform.

### Advanced calculation <a href="#signal-builder-advanced-calculation" id="signal-builder-advanced-calculation"></a>

As well as the simple calculation pad you can also use the Signal Builder‘s advanced calculation pad. In addition to the basic operators, the advanced calculation pad allows you to use the module operator "%" for creating more complex expressions.

An advanced calculation can be recognized by the **Advanced calculation** text within the **Signal Builder** window.

<figure><img src="https://docs.agenatrader.com/~gitbook/image?url=https%3A%2F%2F2805764894-files.gitbook.io%2F%7E%2Ffiles%2Fv0%2Fb%2Fgitbook-legacy-files%2Fo%2Fassets%252F-MKZSsJBtSP9L4sqIe_q%252F-MQHWF5WxWJEmttyqWZG%252F-MQI2tB8xPAn4a9dkwsr%252FCondition%2520Escort.PNG%3Falt%3Dmedia%26token%3Dfe4b20fe-4630-4d99-b418-36a64ab8f332&#x26;width=768&#x26;dpr=4&#x26;quality=100&#x26;sign=85078e4&#x26;sv=1" alt=""><figcaption></figcaption></figure>

Please see the [Simple calculation video](https://www.youtube.com/watch?v=b68a2GsGTT0) for further information.

### Creating conditions in advanced mode <a href="#creating-conditions-in-advanced-mode" id="creating-conditions-in-advanced-mode"></a>

The advanced mode allows you to create AND/OR/XOR conditions with expressions in brackets and logical comparisons. This can be performed by adding the logical operations with a simple click and therefore does not really require any prior programming knowledge.

You will be able to create new conditions or adapt existing conditions from the simple mode.

If you click the advanced button within the [simple mode](https://docs.agenatrader.com/create-your-own-trading-strategy/condition-escort#simple-mode) dialog, then the comparison boxes will display the following:

<figure><img src="https://docs.agenatrader.com/~gitbook/image?url=https%3A%2F%2F2805764894-files.gitbook.io%2F%7E%2Ffiles%2Fv0%2Fb%2Fgitbook-legacy-files%2Fo%2Fassets%252F-MKZSsJBtSP9L4sqIe_q%252F-MQHWF5WxWJEmttyqWZG%252F-MQI34m3W_E76Bhk9sAd%252FAdvancedMode1.png%3Falt%3Dmedia%26token%3D62f9bdd3-7a61-4b41-beb9-3b3fe0eba781&#x26;width=768&#x26;dpr=4&#x26;quality=100&#x26;sign=715bd717&#x26;sv=1" alt=""><figcaption></figcaption></figure>

On the right side of the second comparison box you can see the logical link operator with the following options:

<figure><img src="https://docs.agenatrader.com/~gitbook/image?url=https%3A%2F%2F2805764894-files.gitbook.io%2F%7E%2Ffiles%2Fv0%2Fb%2Fgitbook-legacy-files%2Fo%2Fassets%252F-MKZSsJBtSP9L4sqIe_q%252F-MQHWF5WxWJEmttyqWZG%252F-MQI38tc4HnkVCXb8k_5%252FAdvancedMode2.png%3Falt%3Dmedia%26token%3D1dce6703-5d15-4a56-9e58-5104b8cb359a&#x26;width=768&#x26;dpr=4&#x26;quality=100&#x26;sign=3b4ac2cd&#x26;sv=1" alt=""><figcaption></figcaption></figure>

*The meaning of the logical connectors:*

* AND -> A and B
* OR -> either A or B, **or both**
* XOR -> either A or B, but **not both**

The first and the second box also display brackets:

<figure><img src="https://docs.agenatrader.com/~gitbook/image?url=https%3A%2F%2F2805764894-files.gitbook.io%2F%7E%2Ffiles%2Fv0%2Fb%2Fgitbook-legacy-files%2Fo%2Fassets%252F-MKZSsJBtSP9L4sqIe_q%252F-MQHWF5WxWJEmttyqWZG%252F-MQI3CHfuKm-TnRbBq_m%252FAdvancedMode3.png%3Falt%3Dmedia%26token%3D6b0ebe78-29d1-4d76-a6f4-c8d2c4e6ec92&#x26;width=768&#x26;dpr=4&#x26;quality=100&#x26;sign=5f575d3&#x26;sv=1" alt=""><figcaption></figcaption></figure>

The final advanced condition is completely different from the condition created in the simple mode, and could look like the condition in the image below:

<figure><img src="https://docs.agenatrader.com/~gitbook/image?url=https%3A%2F%2F2805764894-files.gitbook.io%2F%7E%2Ffiles%2Fv0%2Fb%2Fgitbook-legacy-files%2Fo%2Fassets%252F-MKZSsJBtSP9L4sqIe_q%252F-MQHWF5WxWJEmttyqWZG%252F-MQI3JwEwaXY3xNPEYbH%252FAdvancedMode4.png%3Falt%3Dmedia%26token%3D25359fc2-e850-41f7-9210-4eee5eb3a724&#x26;width=768&#x26;dpr=4&#x26;quality=100&#x26;sign=8e81c930&#x26;sv=1" alt=""><figcaption></figcaption></figure>

However, it still remains to be proven whether this condition makes any sense or not.

Please see the [Simple calculation video](https://www.youtube.com/watch?v=b68a2GsGTT0) for further information.

## Using conditions <a href="#condition_escort__using_conditions" id="condition_escort__using_conditions"></a>

Conditions that you have created yourself can be found:

* inside the scanner column (watchlist or list chart group)
* within the Setup Builder
* on the chart

### Scanner column (watchlist or list chart group) <a href="#scanner-column-watchlist-or-list-chart-group" id="scanner-column-watchlist-or-list-chart-group"></a>

To add a new condition to a scanner column:

1. Right click within the scanner and select the **Edit columns** menu item;
2. Find the condition inside the list, then select it by left clicking;
3. Click the **New** button followed by the **OK** or **Apply** button.

Once you add the condition to the scanner, AgenaTrader will scan for a signal and will display inside the corresponding column whether the condition is met:

* a long signal will be marked with a green „1“;
* a short signal will be marked with a red „1“.

<figure><img src="https://docs.agenatrader.com/~gitbook/image?url=https%3A%2F%2F2805764894-files.gitbook.io%2F%7E%2Ffiles%2Fv0%2Fb%2Fgitbook-legacy-files%2Fo%2Fassets%252F-MKZSsJBtSP9L4sqIe_q%252F-MQHWF5WxWJEmttyqWZG%252F-MQI3OrQx9qcbjofmqsG%252FConditionEscortEN.png%3Falt%3Dmedia%26token%3De6361add-6e98-4183-9afa-851ca463cb36&#x26;width=768&#x26;dpr=4&#x26;quality=100&#x26;sign=648d8b58&#x26;sv=1" alt=""><figcaption></figcaption></figure>

### Setup Builder window <a href="#setup-builder-window" id="setup-builder-window"></a>

Depending on whether the condition is an entry, stop or target condition, the SetupBuilder displays it in the appropriate section.

<figure><img src="https://docs.agenatrader.com/~gitbook/image?url=https%3A%2F%2F2805764894-files.gitbook.io%2F%7E%2Ffiles%2Fv0%2Fb%2Fgitbook-legacy-files%2Fo%2Fassets%252F-MKZSsJBtSP9L4sqIe_q%252F-MQHWF5WxWJEmttyqWZG%252F-MQI3ZaQWu3G1oHTfsfM%252Fcond.png%3Falt%3Dmedia%26token%3D94370815-ad7b-45c6-ab4b-c53275882c41&#x26;width=768&#x26;dpr=4&#x26;quality=100&#x26;sign=59cbcf9&#x26;sv=1" alt=""><figcaption></figcaption></figure>

### Chart <a href="#chart" id="chart"></a>

AgenaTrader displays a condition on the chart in the following way:

* "0" indicates that a condition has not been met;
* "1" indicates that a condition has been met.

<figure><img src="https://docs.agenatrader.com/~gitbook/image?url=https%3A%2F%2F2805764894-files.gitbook.io%2F%7E%2Ffiles%2Fv0%2Fb%2Fgitbook-legacy-files%2Fo%2Fassets%252F-MKZSsJBtSP9L4sqIe_q%252F-MQHWF5WxWJEmttyqWZG%252F-MQI3k-BJar17g1xUFtY%252FSignalCondEscEN.png%3Falt%3Dmedia%26token%3Dda170d1b-3a5f-4990-990e-9cbaa6e34377&#x26;width=768&#x26;dpr=4&#x26;quality=100&#x26;sign=269a6122&#x26;sv=1" alt=""><figcaption></figcaption></figure>

### Default Conditions <a href="#condition_escort__default_conditions" id="condition_escort__default_conditions"></a>

**\_52PeriodHighBreakOut**

Detect signals if price exceeds its 52-period high

<figure><img src="https://docs.agenatrader.com/~gitbook/image?url=https%3A%2F%2F2805764894-files.gitbook.io%2F%7E%2Ffiles%2Fv0%2Fb%2Fgitbook-legacy-files%2Fo%2Fassets%252F-MKZSsJBtSP9L4sqIe_q%252F-MPEMqmdUyHHflGKXIqg%252F-MPEQWlxOzwOQggDcDC3%252F52PeriodHighBreakOut.png%3Falt%3Dmedia%26token%3D4a4f720f-3328-4e27-9997-807ac2236595&#x26;width=768&#x26;dpr=4&#x26;quality=100&#x26;sign=ca058673&#x26;sv=1" alt=""><figcaption></figcaption></figure>

**\_52PeriodLowBreakOut**

Detect signals if price falls below its 52-period low

<figure><img src="https://docs.agenatrader.com/~gitbook/image?url=https%3A%2F%2F2805764894-files.gitbook.io%2F%7E%2Ffiles%2Fv0%2Fb%2Fgitbook-legacy-files%2Fo%2Fassets%252F-MKZSsJBtSP9L4sqIe_q%252F-MPEMqmdUyHHflGKXIqg%252F-MPEQbV_rhyJ9dueILTT%252F52PeriodLowBreakOut.png%3Falt%3Dmedia%26token%3D27b22649-62cf-41d6-bb88-e7e9e64f7864&#x26;width=768&#x26;dpr=4&#x26;quality=100&#x26;sign=3706c076&#x26;sv=1" alt=""><figcaption></figcaption></figure>

**LargeSizeBodyGreen**

Detect rising candles with large body-range

<figure><img src="https://docs.agenatrader.com/~gitbook/image?url=https%3A%2F%2F2805764894-files.gitbook.io%2F%7E%2Ffiles%2Fv0%2Fb%2Fgitbook-legacy-files%2Fo%2Fassets%252F-MKZSsJBtSP9L4sqIe_q%252F-MPEMqmdUyHHflGKXIqg%252F-MPEQgy7zF_rjrw2tcxz%252FLargeSizeBodyGreen.png%3Falt%3Dmedia%26token%3Dc544f3c0-818e-40c5-8002-98029549ca09&#x26;width=768&#x26;dpr=4&#x26;quality=100&#x26;sign=7c3acdcd&#x26;sv=1" alt=""><figcaption></figcaption></figure>

**LargeSizeBodyRed**

Detect falling candles with large body-range

<figure><img src="https://docs.agenatrader.com/~gitbook/image?url=https%3A%2F%2F2805764894-files.gitbook.io%2F%7E%2Ffiles%2Fv0%2Fb%2Fgitbook-legacy-files%2Fo%2Fassets%252F-MKZSsJBtSP9L4sqIe_q%252F-MPEMqmdUyHHflGKXIqg%252F-MPEQlTS5SqcBg1DR3Ql%252FLargeSizeBodyRed.png%3Falt%3Dmedia%26token%3D1b7023c7-ae37-41a7-98b3-a1dd7983aa04&#x26;width=768&#x26;dpr=4&#x26;quality=100&#x26;sign=3035c242&#x26;sv=1" alt=""><figcaption></figcaption></figure>

**MediumSizeBodyGreen**

Detect rising candles with medium body-range

<figure><img src="https://docs.agenatrader.com/~gitbook/image?url=https%3A%2F%2F2805764894-files.gitbook.io%2F%7E%2Ffiles%2Fv0%2Fb%2Fgitbook-legacy-files%2Fo%2Fassets%252F-MKZSsJBtSP9L4sqIe_q%252F-MPEMqmdUyHHflGKXIqg%252F-MPEQtUNep1V2G8FnPCc%252FMediumSizeBodyGreen.png%3Falt%3Dmedia%26token%3D8bfcd612-349c-421f-974e-1b52db97a262&#x26;width=768&#x26;dpr=4&#x26;quality=100&#x26;sign=2c04f5c0&#x26;sv=1" alt=""><figcaption></figcaption></figure>

**MediumSizeBodyRed**

Detect falling candles with medium body-range

<figure><img src="https://docs.agenatrader.com/~gitbook/image?url=https%3A%2F%2F2805764894-files.gitbook.io%2F%7E%2Ffiles%2Fv0%2Fb%2Fgitbook-legacy-files%2Fo%2Fassets%252F-MKZSsJBtSP9L4sqIe_q%252F-MPEMqmdUyHHflGKXIqg%252F-MPEQyNv9H_6BrZRlRcy%252FMediumSizeBodyRed.png%3Falt%3Dmedia%26token%3D1607356b-36d1-4c37-bfc6-aa34c61940ab&#x26;width=768&#x26;dpr=4&#x26;quality=100&#x26;sign=99f8055a&#x26;sv=1" alt=""><figcaption></figcaption></figure>

**SmallSizeBodyGreen**

Detect rising candles with small body-range

<figure><img src="https://docs.agenatrader.com/~gitbook/image?url=https%3A%2F%2F2805764894-files.gitbook.io%2F%7E%2Ffiles%2Fv0%2Fb%2Fgitbook-legacy-files%2Fo%2Fassets%252F-MKZSsJBtSP9L4sqIe_q%252F-MPEMqmdUyHHflGKXIqg%252F-MPER1XsSKzra3AoPYBA%252FSmallSizeBodyGreen.png%3Falt%3Dmedia%26token%3Dd8f732b6-8fc2-404e-af6f-a1bb3ad0bf4d&#x26;width=768&#x26;dpr=4&#x26;quality=100&#x26;sign=e14e88b0&#x26;sv=1" alt=""><figcaption></figcaption></figure>

**SmallSizeBodyRed**

Detect falling candles with small body-range

<figure><img src="https://docs.agenatrader.com/~gitbook/image?url=https%3A%2F%2F2805764894-files.gitbook.io%2F%7E%2Ffiles%2Fv0%2Fb%2Fgitbook-legacy-files%2Fo%2Fassets%252F-MKZSsJBtSP9L4sqIe_q%252F-MPEMqmdUyHHflGKXIqg%252F-MPER6oyTDnEerACvs5S%252FSmallSizeBodyRed.png%3Falt%3Dmedia%26token%3D15a1ae73-3976-42a4-ab18-e1cd7c71c3c5&#x26;width=768&#x26;dpr=4&#x26;quality=100&#x26;sign=8edd0b07&#x26;sv=1" alt=""><figcaption></figcaption></figure>

**BB\_RSI\_3Bars long**

Price moves outside (below) Bollinger Bands + RSI is very low (less than 30) + long Three-Bar Reversal is detected

<figure><img src="https://docs.agenatrader.com/~gitbook/image?url=https%3A%2F%2F2805764894-files.gitbook.io%2F%7E%2Ffiles%2Fv0%2Fb%2Fgitbook-legacy-files%2Fo%2Fassets%252F-MKZSsJBtSP9L4sqIe_q%252F-MPEMqmdUyHHflGKXIqg%252F-MPERBYTzPbddHarzZ_A%252FBB_RSI_3Bars%2520long.png%3Falt%3Dmedia%26token%3D6927c304-0139-4e78-aca1-3c90bd98dff6&#x26;width=768&#x26;dpr=4&#x26;quality=100&#x26;sign=83dd3cb1&#x26;sv=1" alt=""><figcaption></figcaption></figure>

**BB\_RSI\_3Bars short**

Price moves outside (above) Bollinger Bands + RSI is very high (higher than 50) + short Three-Bar Reversal detected

<figure><img src="https://docs.agenatrader.com/~gitbook/image?url=https%3A%2F%2F2805764894-files.gitbook.io%2F%7E%2Ffiles%2Fv0%2Fb%2Fgitbook-legacy-files%2Fo%2Fassets%252F-MKZSsJBtSP9L4sqIe_q%252F-MPEMqmdUyHHflGKXIqg%252F-MPERGk6yH6ID1kugbWq%252FBB_RSI_3Bars%2520short.png%3Falt%3Dmedia%26token%3Dc656f09b-31f4-43bf-a71e-bfc54b28f6ca&#x26;width=768&#x26;dpr=4&#x26;quality=100&#x26;sign=cef87cc6&#x26;sv=1" alt=""><figcaption></figcaption></figure>

**BB\_RSI\_Long:**

Price moves outside (below) Bollinger Bands + RSI is very low (less than 30) + LongReversalBar detected

<figure><img src="https://docs.agenatrader.com/~gitbook/image?url=https%3A%2F%2F2805764894-files.gitbook.io%2F%7E%2Ffiles%2Fv0%2Fb%2Fgitbook-legacy-files%2Fo%2Fassets%252F-MKZSsJBtSP9L4sqIe_q%252F-MPEMqmdUyHHflGKXIqg%252F-MPERLgDIK09tsQCuPEr%252FBB_RSI_Long.png%3Falt%3Dmedia%26token%3Dd639e02a-f714-4595-9ff7-e68f67161e85&#x26;width=768&#x26;dpr=4&#x26;quality=100&#x26;sign=4ab8a4a2&#x26;sv=1" alt=""><figcaption></figcaption></figure>

**BB\_RSI\_ short:**

Price moves outside (above) Bollinger Bands + RSI is very high (higher than 50) + ShortReversalBar detected

<figure><img src="https://docs.agenatrader.com/~gitbook/image?url=https%3A%2F%2F2805764894-files.gitbook.io%2F%7E%2Ffiles%2Fv0%2Fb%2Fgitbook-legacy-files%2Fo%2Fassets%252F-MKZSsJBtSP9L4sqIe_q%252F-MPEMqmdUyHHflGKXIqg%252F-MPERQo6Pqccq12e01Xd%252FBB_RSI_%2520short.png%3Falt%3Dmedia%26token%3Db027a874-05e2-4916-9f20-ea7b53b4d71a&#x26;width=768&#x26;dpr=4&#x26;quality=100&#x26;sign=5e639458&#x26;sv=1" alt=""><figcaption></figcaption></figure>

**CloseBelowEMA34:**

Candle High is above EMA34 and closes below EMA34

<figure><img src="https://docs.agenatrader.com/~gitbook/image?url=https%3A%2F%2F2805764894-files.gitbook.io%2F%7E%2Ffiles%2Fv0%2Fb%2Fgitbook-legacy-files%2Fo%2Fassets%252F-MKZSsJBtSP9L4sqIe_q%252F-MRZ8j8gcQh4rNYI9IYE%252F-MRZkzpEMm5xf1tZmW_q%252FCloseBelowEMA34.png%3Falt%3Dmedia%26token%3D8dc10e1e-dabe-492a-b69c-a8e80784953a&#x26;width=768&#x26;dpr=4&#x26;quality=100&#x26;sign=7233329a&#x26;sv=1" alt=""><figcaption></figcaption></figure>

**CloseBelowEMA34\_increased\_volume:**

Candle High is above EMA34 and closes below EMA34 + unusual high volume

<figure><img src="https://docs.agenatrader.com/~gitbook/image?url=https%3A%2F%2F2805764894-files.gitbook.io%2F%7E%2Ffiles%2Fv0%2Fb%2Fgitbook-legacy-files%2Fo%2Fassets%252F-MKZSsJBtSP9L4sqIe_q%252F-MPEMqmdUyHHflGKXIqg%252F-MPERa6aGwc5lXpjjq2s%252FCloseBelowEMA34_increased_volume.png%3Falt%3Dmedia%26token%3D1fac61da-a0a5-4831-a614-565fcd14b6bc&#x26;width=768&#x26;dpr=4&#x26;quality=100&#x26;sign=bbe4f902&#x26;sv=1" alt=""><figcaption></figcaption></figure>

**DownGap**

Detect down gaps

<figure><img src="https://docs.agenatrader.com/~gitbook/image?url=https%3A%2F%2F2805764894-files.gitbook.io%2F%7E%2Ffiles%2Fv0%2Fb%2Fgitbook-legacy-files%2Fo%2Fassets%252F-MKZSsJBtSP9L4sqIe_q%252F-MPEMqmdUyHHflGKXIqg%252F-MPERf2h79sWPsCmmD4j%252FDownGap.png%3Falt%3Dmedia%26token%3D7ed580b4-6e44-4aee-9c24-4b0995ac42b1&#x26;width=768&#x26;dpr=4&#x26;quality=100&#x26;sign=c015bfc9&#x26;sv=1" alt=""><figcaption></figcaption></figure>

**UpGap**

Detect up gaps

<figure><img src="https://docs.agenatrader.com/~gitbook/image?url=https%3A%2F%2F2805764894-files.gitbook.io%2F%7E%2Ffiles%2Fv0%2Fb%2Fgitbook-legacy-files%2Fo%2Fassets%252F-MKZSsJBtSP9L4sqIe_q%252F-MPEMqmdUyHHflGKXIqg%252F-MPERjxZEHGwYagRFI0J%252FUpGap.png%3Falt%3Dmedia%26token%3D47a7674f-511d-4c8e-8513-47e31c4013f7&#x26;width=768&#x26;dpr=4&#x26;quality=100&#x26;sign=3916722&#x26;sv=1" alt=""><figcaption></figcaption></figure>

**CrossBelowPivotPoint**

Candle High is above Pivot Point (PP) and closes below the PivotPoint (PP)

<figure><img src="https://docs.agenatrader.com/~gitbook/image?url=https%3A%2F%2F2805764894-files.gitbook.io%2F%7E%2Ffiles%2Fv0%2Fb%2Fgitbook-legacy-files%2Fo%2Fassets%252F-MKZSsJBtSP9L4sqIe_q%252F-MPEMqmdUyHHflGKXIqg%252F-MPERq5ZbaAEEtU64jC6%252FCrossBelowPivotPoint.png%3Falt%3Dmedia%26token%3D09bfada7-fb98-4658-b8fb-32e5815dd473&#x26;width=768&#x26;dpr=4&#x26;quality=100&#x26;sign=a4d9cf56&#x26;sv=1" alt=""><figcaption></figcaption></figure>

**CrossOverPivotPoint**

Candle High is below Pivot Point (PP) and closes above the PivotPoint (PP)

<figure><img src="https://docs.agenatrader.com/~gitbook/image?url=https%3A%2F%2F2805764894-files.gitbook.io%2F%7E%2Ffiles%2Fv0%2Fb%2Fgitbook-legacy-files%2Fo%2Fassets%252F-MKZSsJBtSP9L4sqIe_q%252F-MPEMqmdUyHHflGKXIqg%252F-MPERvqbemGKFdB31DUM%252FCrossOverPivotPoint.png%3Falt%3Dmedia%26token%3Df660107d-c19c-4481-8171-6dee0700a802&#x26;width=768&#x26;dpr=4&#x26;quality=100&#x26;sign=52edd7c9&#x26;sv=1" alt=""><figcaption></figcaption></figure>

**PriceInResistanceArea**

Detects charts where the price is near a resistance area (with SupportResistanceArea indicator)

<figure><img src="https://docs.agenatrader.com/~gitbook/image?url=https%3A%2F%2F2805764894-files.gitbook.io%2F%7E%2Ffiles%2Fv0%2Fb%2Fgitbook-legacy-files%2Fo%2Fassets%252F-MKZSsJBtSP9L4sqIe_q%252F-MPEMqmdUyHHflGKXIqg%252F-MPES-cvF3x-NAa-iT64%252FPriceInResistanceArea.png%3Falt%3Dmedia%26token%3D8e4aea9f-abc0-483b-949d-d9e47973a5bb&#x26;width=768&#x26;dpr=4&#x26;quality=100&#x26;sign=ebec7dd5&#x26;sv=1" alt=""><figcaption></figcaption></figure>

**PriceInSupportArea**

Detects charts where the price is near a support area (with SupportResistanceArea indicator)

<figure><img src="https://docs.agenatrader.com/~gitbook/image?url=https%3A%2F%2F2805764894-files.gitbook.io%2F%7E%2Ffiles%2Fv0%2Fb%2Fgitbook-legacy-files%2Fo%2Fassets%252F-MKZSsJBtSP9L4sqIe_q%252F-MPEMqmdUyHHflGKXIqg%252F-MPES4REpT2WOgkWy4iW%252FPriceInSupportArea.png%3Falt%3Dmedia%26token%3Dd82850e6-fb15-4144-8c10-a8ee4ca17198&#x26;width=768&#x26;dpr=4&#x26;quality=100&#x26;sign=e3c92634&#x26;sv=1" alt=""><figcaption></figcaption></figure>

**UnusualHighVolume**

Detects unusual high volume

<figure><img src="https://docs.agenatrader.com/~gitbook/image?url=https%3A%2F%2F2805764894-files.gitbook.io%2F%7E%2Ffiles%2Fv0%2Fb%2Fgitbook-legacy-files%2Fo%2Fassets%252F-MKZSsJBtSP9L4sqIe_q%252F-MPEMqmdUyHHflGKXIqg%252F-MPESAOmC_OODuZiFUjl%252FUnusualHighVolume.png%3Falt%3Dmedia%26token%3Dd003d18a-519d-4daf-8182-af8e75b1e83a&#x26;width=768&#x26;dpr=4&#x26;quality=100&#x26;sign=1d6c58e4&#x26;sv=1" alt=""><figcaption></figcaption></figure>

**UnusualLowVolume**

Detects unusual Low volume

<figure><img src="https://docs.agenatrader.com/~gitbook/image?url=https%3A%2F%2F2805764894-files.gitbook.io%2F%7E%2Ffiles%2Fv0%2Fb%2Fgitbook-legacy-files%2Fo%2Fassets%252F-MKZSsJBtSP9L4sqIe_q%252F-MPEMqmdUyHHflGKXIqg%252F-MPESFuHGAC2ym1ZI1p1%252FUnusualLowVolume.png%3Falt%3Dmedia%26token%3D859abb41-ca7b-4b05-9d17-9b1c873dd17d&#x26;width=768&#x26;dpr=4&#x26;quality=100&#x26;sign=94601628&#x26;sv=1" alt=""><figcaption></figcaption></figure>

### &#x20; <a href="#condition_escort__default_conditions-1" id="condition_escort__default_conditions-1"></a>


# Risk and Money management

Risk and Money management

Risk and money management ensures that the risk as well as allocated resources are controlled in each opened trade.

*Risk and money management deals with the following questions:*

* At which price level should I place an entry?
* What is the acceptable level of risk for the trade?
* How do I secure my position with a stop price in the best possible way?
* Which currency should the be instrument traded in?
* Which currency is my account held in?
* What is the currency for the risk calculation?
* What is the current price of currency pairs for the instrument/risk calculation?
* What spread does the instrument have?
* What average slippage does the instrument have?
* Taking all of these factors into consideration, how large should the order size be?
* Is the calculated order size even or odd (odd lots can lead to disadvantageous price setting by the market maker and bad execution)?

The most important part of risk management is understanding when is the optimal time to place an entry order and exit a trade, as well as how much risk can be accepted.

<figure><img src="https://docs.agenatrader.com/~gitbook/image?url=https%3A%2F%2F2805764894-files.gitbook.io%2F%7E%2Ffiles%2Fv0%2Fb%2Fgitbook-legacy-files%2Fo%2Fassets%252F-MKZSsJBtSP9L4sqIe_q%252F-MQlkXnxEvvGK-rs8ZpV%252F-MQln3YtakqdaRqyhuME%252FriskAndMoneyManagement.png%3Falt%3Dmedia%26token%3D6dc75475-4a33-4622-8290-ac73c26163ea&#x26;width=768&#x26;dpr=4&#x26;quality=100&#x26;sign=afc584c8&#x26;sv=1" alt=""><figcaption></figcaption></figure>

The difference between entry and initial stop shows the amount of money which may be lost during the trade.

The order size amount is calculated according to the following steps:

#### Step 1. Placing an entry order. <a href="#step_1-._placing_an_entry_order" id="step_1-._placing_an_entry_order"></a>

First of all, it is important to find a suitable entry point for submitting an order.

*An entry signal can occur:*

1. due to fully-automated setup
2. based on a signal in a semi-automated environment
3. discretionarily.

The generated signal should not necessarily be identified with an immediate entry order. This order can be moved away from the suggested price level. For example, you can program an order to only be submitted after an outbreak through the high or low of the current candlestick or an outbreak from the Pivot pattern, etc.

#### Step 2. Placing a stop order. <a href="#step_2-._placing_a_stop_order" id="step_2-._placing_a_stop_order"></a>

Once the entry order is set, the next step is to determine where to exit the trade if the price moves in an undesired direction. Be careful with fixed stops (e.g. 15 ticks after the entry). This kind of stop can lead to a situation in which you awkwardly exit the market from different positions without the possibility of removing the stops or adjusting the risk. Stops should comply with the relevant market-related points.

#### Step 3. Calculating the distance between entry and initial stop. <a href="#step_3-._calculating_the_distance_between_entry_and_initial_stop" id="step_3-._calculating_the_distance_between_entry_and_initial_stop"></a>

Calculates the number of cents/points/ticks/pips that will be at risk during the trade.

#### Step 4. Involved currencies. <a href="#step_4-._involved_currencies" id="step_4-._involved_currencies"></a>

It is important to know which currency the risk for a traded instrument is calculated in. Usually the currency for risk calculations corresponds to the account currency. However, it is also possible to have accounts with different currencies. In order to have a clear overview of the risk you should define one currency to be used for risk calculation.

<figure><img src="https://docs.agenatrader.com/~gitbook/image?url=https%3A%2F%2F2805764894-files.gitbook.io%2F%7E%2Ffiles%2Fv0%2Fb%2Fgitbook-legacy-files%2Fo%2Fassets%252F-MKZSsJBtSP9L4sqIe_q%252F-MQlkXnxEvvGK-rs8ZpV%252F-MQln7Oy7uzXB1uSPLrA%252Fconfig.png%3Falt%3Dmedia%26token%3Df3197a25-1d44-430b-bbed-31154e3c1328&#x26;width=768&#x26;dpr=4&#x26;quality=100&#x26;sign=c23fb10b&#x26;sv=1" alt=""><figcaption></figcaption></figure>

Select the **Tools** main menu followed by the **Global Configuration** menu item. This allows you to set the currency for risk measurement within the **General ->** [**Global Configuration: General**](https://docs.agenatrader.com/tools/configuration-escort#general). After confirming the settings, the values of all traded instruments will be converted into the chosen currency for risk calculation.

#### Step 5. Calculating the order size. <a href="#step_5-._calculating_the_order_size" id="step_5-._calculating_the_order_size"></a>

The account size is an important factor for calculating the order size. You should always adjust the risk to the account size in order to prevent a series of concurrent failed trades from exhausting your account. Of course, you can increase the risk if you have stable ongoing profits, but it is much more important to reduce the risk if the account size has decreased.

The following options for [calculating the order size](https://docs.agenatrader.com/create-your-own-trading-strategy/at-plusplus-manager#at-plus-plus-risk-management) are available:

<figure><img src="https://docs.agenatrader.com/~gitbook/image?url=https%3A%2F%2F2805764894-files.gitbook.io%2F%7E%2Ffiles%2Fv0%2Fb%2Fgitbook-legacy-files%2Fo%2Fassets%252F-MKZSsJBtSP9L4sqIe_q%252F-MQlkXnxEvvGK-rs8ZpV%252F-MQlnBocJUxCyEFrbGG5%252Frisk%2520management.png%3Falt%3Dmedia%26token%3Df6566354-ee85-4d10-8a79-e2ef22928d2f&#x26;width=768&#x26;dpr=4&#x26;quality=100&#x26;sign=73ef1c97&#x26;sv=1" alt=""><figcaption></figcaption></figure>

#### 1.1. Risk per trade defined by percentage'' <a href="#risk_per_trade_defined_by_percentage" id="risk_per_trade_defined_by_percentage"></a>

With this method, the order size is calculated as a percentage of the account Buying Power or Cash Value.

**Buying Power Example**

* Assume that you have 25.000.- EUR cash value on your account and the broker provides you with a margin/leverage of 4. This makes 100 000.- EUR for you to invest.
* Risk per trade is 0.15%. So, during the trade you will risk 150 EUR (the P\&L currency). The absolute value will change proportionally depending on whether the account size increases or decreases.
* If you select an entry price for a USD currency-based instrument at 11.93 and stop price at 11.75 then you have a difference of 18 cents. Add 1 cent for the spread and 2 cents for the slippage, and your total difference will amount to 21 cents.
* This difference will be converted to your base currency. Assuming that the EURUSD exchange rate is currently 1.423, then 21 cents/1.423 will result in 14.7575€ cents at risk (or 0.147575€).
* Now the evenly numbered order size will be determined by dividing 150 by 0.147575, resulting in 1016 purchased shares.

Applying this method of calculation, your risk will always remain the same but the corresponding amount will vary. Also note, that the resulting number of 1016 shares might be rounded up according to your rounding settings which are explained later in this article.

**Cash Value Example**

* Assume that you have 100.000.- EUR cash value on your account. When not using the bying power option no margin/leverage is applied and this leaves 100 000.- EUR for you to invest.
* Risk per trade is 0.15%. So, during the trade you will risk 150 EUR (the P\&L currency). The absolute value will change proportionally depending on whether the account size increases or decreases.
* If you select an entry price for a USD currency-based instrument at 11.93 and stop price at 11.75 then you have a difference of 18 cents. Add 1 cent for the spread and 2 cents for the slippage, and your total difference will amount to 21 cents.
* This difference will be converted to your base currency. Assuming that the EURUSD exchange rate is currently 1.423, then 21 cents/1.423 will result in 14.7575€ cents at risk (or 0.147575€).
* Now the evenly numbered order size will be determined by dividing 150 by 0.147575, resulting in 1016 purchased shares.

Applying this method of calculation, your risk will always remain the same but the corresponding amount will vary. Also note, that the resulting number of 1016 shares might be rounded up according to your rounding settings which are explained later in this article.

#### 1.2. Fixed value <a href="#fixed_value" id="fixed_value"></a>

This enables you to set a fixed risk per trade regardless of the account size.

**Example 1**

* Assume that you set your risk per trade fixed value to 300 EUR.
* If you select an entry price for a USD currency-based instrument at 11.93 and stop price at 11.75 then you have a difference of 18 cents. Add 1 cent for the spread and 2 cents for the slippage, and your total difference will amount to 21 cents.
* This difference will be converted to your base currency. Assuming that the EURUSD exchange rate is currently 1.423, then 21 cents/1.423 will result in 14.7575€ cents at risk (or 0.147575€).
* Now the evenly numbered order size will be determined by dividing 300 by 0.147575, resulting in 2032 purchased shares.//

With this option the amount of risk will have always the same size. Also note, that the resulting number of 2032 shares might be rounded up according to your rounding settings which are explained later in this article.

**WARNING!** The risk may vary in this case, meaning that losses are not really controllable. Since the risk remains constant, the changes in the account size will not be taken into consideration.

*3.Max. Investment per trade defined by percentage* You can define a maximum percentage calculated on either the buying power or cash value of your account to determine the maximal investment per trade.

**Example: 2**

* Assume that your account cash value is 25.000 USD and you select calculated on cash value.
* Also assume that you chose 15% to be invested per trade.
* This means that a maximum of 3.750 USD is invested in one trade.

Pleae note that both the risk per trade and maximal investment per trade settings are considered in the order size calculations. When one of the paramters is reached the final order size is calculated. This could lead to either less investment per trade or less risk per trade. Also note, that small differences due to the rounding settings are possible. Rounding settings are explained later in this article.

#### Step 6. Setting limitation on losses <a href="#step_6-._setting_limitation_on_losses" id="step_6-._setting_limitation_on_losses"></a>

A trader may have on a trading account many opened positions at the same time, possibly generating both profits and losses. It is important that an overview and control of all positions is not get lost.

The function **Daily Loss Limit** allows setting of the maximal amount of loss on a trading account per day. The total sum of losses is reported in the Column **Daily PL** of the [**Account tab**](https://docs.agenatrader.com/create-your-own-trading-strategy/at-plusplus-manager#at-plus-plus-risk-management). As soon as a total loss exceeds the set limit the following popup will be shown:

<figure><img src="https://docs.agenatrader.com/~gitbook/image?url=https%3A%2F%2F2805764894-files.gitbook.io%2F%7E%2Ffiles%2Fv0%2Fb%2Fgitbook-legacy-files%2Fo%2Fassets%252F-MKZSsJBtSP9L4sqIe_q%252F-MQlkXnxEvvGK-rs8ZpV%252F-MQlnSdMdJD6jq_xTcLF%252FPopup_limit_loss.png%3Falt%3Dmedia%26token%3Decb32e5e-c941-4d3e-8996-97200c508e85&#x26;width=768&#x26;dpr=4&#x26;quality=100&#x26;sign=20f105b6&#x26;sv=1" alt=""><figcaption></figcaption></figure>

This popup offers two possibilities to a user:

1. The loss limit may be increased. To do this enter a new amount in the field **New Daily Loss Limit**, which should be higher than the previous limit. After pressing **OK** all positions on the current trading account will stay opened and trading will continue until the next loss limit is reached.
2. If you press the button **Flatten and block** then all positions on the account will be automatically closed and no trades will be allowed anymore.

#### Step 7. Round to lot sizes. <a href="#step_7-._round_to_lot_sizes" id="step_7-._round_to_lot_sizes"></a>

The position size calculations mentioned in step 5 calculate odd-numbered position sizes. But in some cases the exchanges will use metrics such as lots.

* For stocks, packets of 100 shares are usually implied
* For Forex, these are 100 000 currency units
* For the retail traders, sizes such as mini lots and micro lots (10 000 and 1 000 respectively) are also available.

Using the **Global Configuration ->** [**AT (Plus Plus): Order Rounding**](https://docs.agenatrader.com/create-your-own-trading-strategy/at-plusplus-manager#at-plus-plus-order-rounding) and also **Futures tabs** you can set the necessary parameters.

The following image shows one of the setups for calculation of the position size:

1. smaller than 300 will be rounded to the next 20;
2. bigger than 300 will be rounded to the next 100.

<figure><img src="https://docs.agenatrader.com/~gitbook/image?url=https%3A%2F%2F2805764894-files.gitbook.io%2F%7E%2Ffiles%2Fv0%2Fb%2Fgitbook-legacy-files%2Fo%2Fassets%252F-MKZSsJBtSP9L4sqIe_q%252F-MQlkXnxEvvGK-rs8ZpV%252F-MQlnXBthy4pTUxwlbNP%252FRound.png%3Falt%3Dmedia%26token%3D76d1e4ed-9f3a-4238-9bfc-f474e577a482&#x26;width=768&#x26;dpr=4&#x26;quality=100&#x26;sign=3ed6d515&#x26;sv=1" alt=""><figcaption></figcaption></figure>

This example implies that the odd-numbered position sizes will be recalculated in the following way:

* Risk per trade: 1016 -> 1000
* Fixed amount: 2032 -> 2000

Another example: a position with 283 shares will be rounded to 280. The decision if the order size is rounded up or down as based on regular mathematics. Values from 1-4 will be rounded down and values from 5 are rounded up.

**Important!** Sim account can have a minus value which means that trading with sim account exceeded account cash value.

**Important!** Please find details on page [AT (Plus Plus): Risk Management](https://docs.agenatrader.com/create-your-own-trading-strategy/at-plusplus-manager#at-plus-plus-risk-management)

## Increasing risk: widening the stops

**Increasing the risk by widening the range between the stop and initial order.** If you manually move the stop away from the initial order within the AT++ plusplus setup, you will receive a popup alerting you to the increase of risk.

The popup will present the the following options:

<figure><img src="https://docs.agenatrader.com/~gitbook/image?url=https%3A%2F%2F2805764894-files.gitbook.io%2F%7E%2Ffiles%2Fv0%2Fb%2Fgitbook-legacy-files%2Fo%2Fassets%252F-MKZSsJBtSP9L4sqIe_q%252F-MQlkXnxEvvGK-rs8ZpV%252F-MQlnoPyAIkksAnhpn5n%252FInitial%2520stops%2520popup.PNG%3Falt%3Dmedia%26token%3Da16f7a6a-a94f-4d9e-97ec-a767380f08b1&#x26;width=768&#x26;dpr=4&#x26;quality=100&#x26;sign=56344eaa&#x26;sv=1" alt=""><figcaption></figcaption></figure>

* Set back to initial risk: select this if the stop was moved by accident and you wish to return to the previous settings.
* Set new initial risk: sets the newly selected stop price as the new initial risk.
* Set new initial risk and halt the stop methods: sets the newly selected stop price as the new initial risk, but also locks the stop level in order to prevent further changes (activates the **Halt** box in the **Order Escort**).

The following image shows the widening of the range between the stop and initial order:

<figure><img src="https://docs.agenatrader.com/~gitbook/image?url=https%3A%2F%2F2805764894-files.gitbook.io%2F%7E%2Ffiles%2Fv0%2Fb%2Fgitbook-legacy-files%2Fo%2Fassets%252F-MKZSsJBtSP9L4sqIe_q%252F-MQlkXnxEvvGK-rs8ZpV%252F-MQlnsvPmBdJNfH6J-qv%252FriskAndMoneyManagementSL2.png%3Falt%3Dmedia%26token%3D7db506b1-b435-4d78-97f3-0244e33c60f9&#x26;width=768&#x26;dpr=4&#x26;quality=100&#x26;sign=c7f58ef4&#x26;sv=1" alt=""><figcaption></figcaption></figure>

Based on several requests from customers, we have now added the optional function to no longer have this window displayed.

When this window is opened, you can now directly activate the checkbox **“Don’t show anymore”** in order to disable this risk message in the future.

<figure><img src="https://docs.agenatrader.com/~gitbook/image?url=https%3A%2F%2F2805764894-files.gitbook.io%2F%7E%2Ffiles%2Fv0%2Fb%2Fgitbook-legacy-files%2Fo%2Fassets%252F-MKZSsJBtSP9L4sqIe_q%252F-MQlkXnxEvvGK-rs8ZpV%252F-MQlnxTmV1-2TerJqdfM%252FInitial%2520stops%2520popup%2520never.PNG%3Falt%3Dmedia%26token%3D043b0fd7-f0d1-45bb-8956-d66706e62683&#x26;width=768&#x26;dpr=4&#x26;quality=100&#x26;sign=36a05d7&#x26;sv=1" alt=""><figcaption></figcaption></figure>

It is also possible for you to deactivate the message in advance in the **Global Configuration.**

<figure><img src="https://docs.agenatrader.com/~gitbook/image?url=https%3A%2F%2F2805764894-files.gitbook.io%2F%7E%2Ffiles%2Fv0%2Fb%2Fgitbook-legacy-files%2Fo%2Fassets%252F-MKZSsJBtSP9L4sqIe_q%252F-MQlkXnxEvvGK-rs8ZpV%252F-MQlo-y_1Zqv4NjVola_%252FRISK.png%3Falt%3Dmedia%26token%3D86154643-ed3d-40a4-8c0a-f0eb03a89d1c&#x26;width=768&#x26;dpr=4&#x26;quality=100&#x26;sign=fcc86bde&#x26;sv=1" alt=""><figcaption></figcaption></figure>

<br>


# Strategy Manager

## Strategy Manager <a href="#strategy_escort_tab" id="strategy_escort_tab"></a>

The **Strategy Manager** allows you to start and manage your strategies independently from the charts. This enables the user to run several strategies simultaneously AgenaTrader is highly resource-efficient, meaning that your running strategies operate very efficiently. The active [strategies](https://docs.agenatrader.com/create-your-own-trading-strategy/scripting#Scripting__Programming_of_strategies) can be reviewed and managed within the **Strategy Manager**.

<figure><img src="/files/iiCnCiYvojH78pwDOFnH" alt=""><figcaption></figcaption></figure>

The **Strategy manager tab** contains the following columns:

| Column           | Meaning                                                                                                                                                                                                                                                                                                                                                                                                                                                                                                                                                                                                                                                                                                                                                                                                                                                                |
| ---------------- | ---------------------------------------------------------------------------------------------------------------------------------------------------------------------------------------------------------------------------------------------------------------------------------------------------------------------------------------------------------------------------------------------------------------------------------------------------------------------------------------------------------------------------------------------------------------------------------------------------------------------------------------------------------------------------------------------------------------------------------------------------------------------------------------------------------------------------------------------------------------------- |
| Name             | Name of the strategy                                                                                                                                                                                                                                                                                                                                                                                                                                                                                                                                                                                                                                                                                                                                                                                                                                                   |
| Symbol           | Instrument used for a strategy                                                                                                                                                                                                                                                                                                                                                                                                                                                                                                                                                                                                                                                                                                                                                                                                                                         |
| Time frame       | Time frame in which the strategy is running                                                                                                                                                                                                                                                                                                                                                                                                                                                                                                                                                                                                                                                                                                                                                                                                                            |
| Start Date\&Time | Point in time at which the strategy was started                                                                                                                                                                                                                                                                                                                                                                                                                                                                                                                                                                                                                                                                                                                                                                                                                        |
| Status           | [![Dot](https://docs.agenatrader.com/~gitbook/image?url=https%3A%2F%2Fagenatrader.com%2Fwiki%2Ftiki-download_file.php%3FfileId%3D22%26display\&width=300\&dpr=4\&quality=100\&sign=5ef5815b\&sv=1) ](https://agenatrader.com/wiki/tiki-download_file.php?fileId=22\&display)Active: the strategy is running and currently attached to one or multiple charts. The strategy will not be closed even when the chart is closed. [![Dot](https://docs.agenatrader.com/~gitbook/image?url=https%3A%2F%2Fagenatrader.com%2Fwiki%2Ftiki-download_file.php%3FfileId%3D22%26display\&width=300\&dpr=4\&quality=100\&sign=5ef5815b\&sv=1) ](https://agenatrader.com/wiki/tiki-download_file.php?fileId=22\&display)Background: the active strategy is not attached to any chart. This is a special feature of AgenaTrader that is not available in many other trading platforms. |
| Charts           | The amount of charts on which a strategy is active. The background status always corresponds to 0 charts. The amount increases if you open an additional chart for the same instrument and time frame.                                                                                                                                                                                                                                                                                                                                                                                                                                                                                                                                                                                                                                                                 |
| P\&L             | The Profit/Loss generated by the strategy so far                                                                                                                                                                                                                                                                                                                                                                                                                                                                                                                                                                                                                                                                                                                                                                                                                       |
| Analyzer Session | Select Analyzer session                                                                                                                                                                                                                                                                                                                                                                                                                                                                                                                                                                                                                                                                                                                                                                                                                                                |
| Stop             | Stop strategy                                                                                                                                                                                                                                                                                                                                                                                                                                                                                                                                                                                                                                                                                                                                                                                                                                                          |

Right click on a row inside the strategy manager tab to open the context menu:

<figure><img src="/files/w6aUlcQQdNMg0CRQ2PVT" alt=""><figcaption></figcaption></figure>

*Right click on a row inside the **Strategy manager tab** to open the context menu:*

* Open Chart: opens up a dialog window for opening a new chart

<figure><img src="/files/uYvgNvrmAaeDLZh7EjWy" alt=""><figcaption></figcaption></figure>

* Start strategy: allows to select and specify a [strategy](https://docs.agenatrader.com/main/chart-area/untitled/strategies)

<figure><img src="/files/HlLNYtk7YbXe2Oc2W4dN" alt=""><figcaption></figcaption></figure>

## **Strategy parameters** <a href="#strategy-parameters" id="strategy-parameters"></a>

| Name                 | Meaning                                                                                                                                                                                                                                                                                                            |
| -------------------- | ------------------------------------------------------------------------------------------------------------------------------------------------------------------------------------------------------------------------------------------------------------------------------------------------------------------ |
| Caption              | Displays a strategy's technical description. You can change these settings if required. For example, to display a shorter name for the strategy (MMR instead of MakeMeRichStrategy) input the following information: MakeMeRichStrategy -> MMR.++                                                                  |
| Required bars count  | Defines the number of periods after which the strategy will be calculated (adjusted). For example, SMA requires at least 20 periods (bars) to correctly calculate the moving average and consequently formulate accurate conclusions for the strategy calculation. It is especially important for the backtesting. |
| Input Series         | Allows you to select data series for strategy calculation. The standard setting is "close", which means that the strategy will be calculated based on the closing prices of a specific period.                                                                                                                     |
| Time-Frame           | Set time frames for the strategy.                                                                                                                                                                                                                                                                                  |
| Session              | This parameter allows user to select Analyzer Column session                                                                                                                                                                                                                                                       |
| Trading Options      | If true, strategy will work for option trading                                                                                                                                                                                                                                                                     |
| Close Trades on Stop | Means that strategy stop will close all running orders which are running under the strategy,                                                                                                                                                                                                                       |
| Is to recover        | If true, strategies are saved, even if they do not have active trades or orders.                                                                                                                                                                                                                                   |
| Log Orders           | If true, all placed orders will be saved in the Log.                                                                                                                                                                                                                                                               |
| Time in force        | Display how long order will be enabled in system unless it is executed (GTC - good till canceled; Day - enable for 1 day, GTD - good till date, IOC - immediate or cancel)                                                                                                                                         |

After clicking the **Select** button, the instrument or several instruments from the instrument list will be adopted by the **Strategy Manager** with the previously selected strategy.

* Stop: allows to stop (i.e. delete) one or several strategies, right click on the cell in the strategy manager tab and select the **Stop** option.

If a strategy is currently managing confirmed orders or running trades, the query box will ask you to confirm that you really wish to stop the chosen strategy.

<figure><img src="/files/iisqQlKIdKmFwsCix8Ti" alt=""><figcaption></figcaption></figure>

* Show PL Percent: dosplays the profit / loss in the Strategy Manager in percent
* Export to MS Excel: allows to save the rows from the Strategy Manager in a CSV file
* Connect with Chart: activates the connection to a single chart or single chart group. Once activated, move the mouse to a single chart or single chart group. The mouse indicator will change to a rectangle with an arrow. Click in the charting area again to connect the rows of the **Strategy Manager** to the chart (single chart or single chart group).

To load the chart, left click on the appropriate instruments in the **Strategy Manager**.

**The Strategy Manager shows two types of strategies:**

* Fully automated programmed strategies: these strategies must be explicitly started or stopped for an instrument or multiple instruments (e.g. from the Chart or the Strategy Manager).
* Semi-automated AgenaTrader++ strategies: the entries of these strategies are handled discretionarily and are managed by the trade management.

## Relationship between a list chart group and the Strategy Manager <a href="#relationship-between-a-list-chart-group-and-the-strategy-escort" id="relationship-between-a-list-chart-group-and-the-strategy-escort"></a>

(this pertains to semi-automated AT++ strategies)

The [Analyzer Column column](https://docs.agenatrader.com/create-your-own-trading-strategy/setup-escort#analyzer-escort-column) displays signals (signals are not strategies) that are driven by real-time events. If a signal-based AgenaTrader++ setup (necessary settings can be made in the [Setup Builder](https://docs.agenatrader.com/create-your-own-trading-strategy/setup-escort) is activated and executed, then the [strategy](https://docs.agenatrader.com/main/chart-area/untitled/strategies) takes over to control your position. If you click on an instrument from the list chart group when AgenaTrader++ is activated, then the corresponding row will be displayed in the **Strategy Manager** (though no trade will take place yet).

<figure><img src="https://docs.agenatrader.com/~gitbook/image?url=https%3A%2F%2F2805764894-files.gitbook.io%2F%7E%2Ffiles%2Fv0%2Fb%2Fgitbook-legacy-files%2Fo%2Fassets%252F-MKZSsJBtSP9L4sqIe_q%252F-MQlkXnxEvvGK-rs8ZpV%252F-MQlpPD5CnX6RyYOlHF4%252Fstrategie_escort_instrumentlist.png%3Falt%3Dmedia%26token%3Ddfb44637-ae32-40b6-b2ff-9921aa5a6b58&#x26;width=768&#x26;dpr=4&#x26;quality=100&#x26;sign=79814ad&#x26;sv=1" alt=""><figcaption></figcaption></figure>

Once you have entered a position (for example, short EURCAD) then the strategy will become active and start to manage your position. If you continue clicking within the list chart group you will see that the strategy is activated to manage the opened position. This applies to currently active trades as well as confirmed orders (not proposal orders) in the chart. In these cases the strategy shifts to the strategy manager and receives the status "Background".

<figure><img src="https://docs.agenatrader.com/~gitbook/image?url=https%3A%2F%2F2805764894-files.gitbook.io%2F%7E%2Ffiles%2Fv0%2Fb%2Fgitbook-legacy-files%2Fo%2Fassets%252F-MKZSsJBtSP9L4sqIe_q%252F-MQlkXnxEvvGK-rs8ZpV%252F-MQlpVGkEJWJOHeeFpac%252FStrategy%2520Escort.jpg%3Falt%3Dmedia%26token%3D8f110f0d-0952-4e88-b89e-9fb4aa327a1d&#x26;width=768&#x26;dpr=4&#x26;quality=100&#x26;sign=96d39f75&#x26;sv=1" alt=""><figcaption></figcaption></figure>

## Relationship between a tab chart group and the Strategy Manager <a href="#relationship-between-a-tab-chart-group-and-the-strategy-escort" id="relationship-between-a-tab-chart-group-and-the-strategy-escort"></a>

(this pertains to semi-automated AT++ strategies)

If you want the strategy for one or all instruments in the tab chart group to start as soon as AgenaTrader++ is opened, check the **Tab Chart Group Autosynchronization** checkbox in the **Global Configuration -> General ->** [**Chart**](https://docs.agenatrader.com/tools/configuration-escort#chart). If the **Tab Chart Group Autosynchronization** is not selected, then AT++ must be manually opened/closed for every instrument (the same applies to single chart groups and single charts).


# AgenaScript

AgenaScript is a programming language integrated into the trading platform AgenaTrader. The syntax of AgenaScript is derived from the programming language C#. Using AgenaScript enables you to implement all strategies, even if they are too complex for the Signal Builder. The spectrum extends from the programming of simple indicators to self-designed applications in which AgenaTrader plays only a supporting role. Practically all approaches that are also applicable in DotNet can be used: complex indicators, signal display, Excel export, evaluation, chart representation, sound, colors and many others.

[The AgenaScript help](https://script.agenatrader.com/) contains the following paragraphs:

**1. Trading bars and instruments** Describes in detail how to access single bars or candlesticks as well as various trading instruments using AgenaScript.

**2. Events** AgenaScript is event-oriented. Examples of events:

* A new candle occurs after the closing of the prior one within a particular time interval;
* New prices are delivered from your data provider;
* An order is executed and others

AgenaScript makes it easy for you to react to this information. The purpose of this section is to explain exactly how this works and which events can arise.

**3. Indicators and oscillators** Provides an extensive description of all indicators integrated in AgenaTrader. An introduction of the instruments is given to start off with, followed by the information about their use. A significant part of this section is devoted to the interpretation of signals, and several references for further information are also provided. Each indicator and oscillator can be used in your own AgenaScript. In this description you can also find the exact syntax, the meaning of parameters and a code example.

**4. Programming of strategies** AgenaScript allows you to create your own trading strategies and then trade them live on the market. In this paragraph you will find answers to the questions of which requirements are necessary and how to transfer orders to your broker and trade internally.

**5. Keywords** Like each programming language, AgenaTrader has a set of commands you can use to create your own scripts. You should become familiar with these keywords if you wish to create self-programmed indicators or entire trading systems.

**6. Drawing objects** All drawing objects that can be used on the chart are also available within AgenaScript. Drawing objects such as lines, arrows, rectangles, circles etc. can be automatically displayed at specified positions or removed from the chart again. Your possibilities are unlimited.

**7. Tips and tricks** Presents the solutions to unusual problems. In order to understand these complex examples, however, a good deal of programming experience is required. Advanced users can still find some useful information for programming ideas of their own.


# Scripting

## Agena indicator <a href="#agena-indicator" id="agena-indicator"></a>

[Agena indicator Help Guide](https://indicators.agenatrader.com/) provides extensive information about indicators integrated in AgenaTrader:

* Description of indicators and oscillators;
* Meaning of parameters;
* Use and interpretation of signals;
* Syntax and code examples;
* References.

## Scripting

### Scripting environment <a href="#scripting-environment" id="scripting-environment"></a>

AgenaTrader's programming environment is comparable to Visual Studio. It enables you to:

1. navigate the programming workspace using toolbars,
2. handle multiple components at the same time via the editor (top tab bar),
3. use the IntelliSense® functionality,
4. view a list of errors at the bottom of the screen.

<figure><img src="https://docs.agenatrader.com/~gitbook/image?url=https%3A%2F%2F2805764894-files.gitbook.io%2F%7E%2Ffiles%2Fv0%2Fb%2Fgitbook-legacy-files%2Fo%2Fassets%252F-MKZSsJBtSP9L4sqIe_q%252F-MQlkXnxEvvGK-rs8ZpV%252F-MQlpxlqigsDWQt-9Uk-%252Fscripting1.png%3Falt%3Dmedia%26token%3D548a2c98-6964-4e30-983f-0ae3dd767327&#x26;width=768&#x26;dpr=4&#x26;quality=100&#x26;sign=a5c09429&#x26;sv=1" alt=""><figcaption></figcaption></figure>

### Scripting toolbar <a href="#scripting_toolbar" id="scripting_toolbar"></a>

| Icon                                                                                                                                                                                                                                                                                                                                                                                                                       | Function                                                              |
| -------------------------------------------------------------------------------------------------------------------------------------------------------------------------------------------------------------------------------------------------------------------------------------------------------------------------------------------------------------------------------------------------------------------------- | --------------------------------------------------------------------- |
| ![Scrp](https://docs.agenatrader.com/~gitbook/image?url=https%3A%2F%2F2805764894-files.gitbook.io%2F%7E%2Ffiles%2Fv0%2Fb%2Fgitbook-legacy-files%2Fo%2Fassets%252F-MKZSsJBtSP9L4sqIe_q%252F-MQlkXnxEvvGK-rs8ZpV%252F-MQlq03NzUNjuDA3wIlj%252Fscrp.png%3Falt%3Dmedia%26token%3D087eb362-73e3-4f95-b58b-9458eb694423\&width=300\&dpr=4\&quality=100\&sign=ae338bf5\&sv=1)                                                     | Loads existing self-programmed indicators/strategies to the workspace |
| ![Scrp1](https://docs.agenatrader.com/~gitbook/image?url=https%3A%2F%2F2805764894-files.gitbook.io%2F%7E%2Ffiles%2Fv0%2Fb%2Fgitbook-legacy-files%2Fo%2Fassets%252F-MKZSsJBtSP9L4sqIe_q%252F-MQlkXnxEvvGK-rs8ZpV%252F-MQlq6whcIuzLGbQtaz5%252Fscrp1.png%3Falt%3Dmedia%26token%3De1b59d2b-2cd2-4505-be14-092fa52ffab2\&width=300\&dpr=4\&quality=100\&sign=f06bacdd\&sv=1)                                                   | Saves source code changes                                             |
| ![Scrp2](https://docs.agenatrader.com/~gitbook/image?url=https%3A%2F%2F2805764894-files.gitbook.io%2F%7E%2Ffiles%2Fv0%2Fb%2Fgitbook-legacy-files%2Fo%2Fassets%252F-MKZSsJBtSP9L4sqIe_q%252F-MQlkXnxEvvGK-rs8ZpV%252F-MQlqABqSCIsdTi9q-Hg%252Fscrp2.png%3Falt%3Dmedia%26token%3D29eb5648-059f-48e7-9226-0340f7f48386\&width=300\&dpr=4\&quality=100\&sign=f2690c37\&sv=1)                                                   | Cuts marked source code                                               |
| ![Scrp3](https://docs.agenatrader.com/~gitbook/image?url=https%3A%2F%2F2805764894-files.gitbook.io%2F%7E%2Ffiles%2Fv0%2Fb%2Fgitbook-legacy-files%2Fo%2Fassets%252F-MKZSsJBtSP9L4sqIe_q%252F-MQlkXnxEvvGK-rs8ZpV%252F-MQlqDMkQexNe3vcT_wA%252Fscrp3.png%3Falt%3Dmedia%26token%3D078152cc-feea-4c11-920d-dcd91dd3964a\&width=300\&dpr=4\&quality=100\&sign=51ed8104\&sv=1)                                                   | Copies marked source code                                             |
| <img src="https://docs.agenatrader.com/~gitbook/image?url=https%3A%2F%2F2805764894-files.gitbook.io%2F%7E%2Ffiles%2Fv0%2Fb%2Fgitbook-legacy-files%2Fo%2Fassets%252F-MKZSsJBtSP9L4sqIe_q%252F-MQlkXnxEvvGK-rs8ZpV%252F-MQlqGK4ZK36bD6mZnDL%252Fscrp4.png%3Falt%3Dmedia%26token%3Dc19a52bf-e597-4c21-8d65-79722ff6ccf8&#x26;width=300&#x26;dpr=4&#x26;quality=100&#x26;sign=6d07b151&#x26;sv=1" alt="" data-size="original"> | Pastes copied / cut source code                                       |
| ![Scrp5](https://docs.agenatrader.com/~gitbook/image?url=https%3A%2F%2F2805764894-files.gitbook.io%2F%7E%2Ffiles%2Fv0%2Fb%2Fgitbook-legacy-files%2Fo%2Fassets%252F-MKZSsJBtSP9L4sqIe_q%252F-MQlkXnxEvvGK-rs8ZpV%252F-MQlqKqBt8NubsI1Kbkc%252Fscrp5.png%3Falt%3Dmedia%26token%3Dec5c2635-145a-477a-bf3f-7e6c6c1d14ed\&width=300\&dpr=4\&quality=100\&sign=609cad35\&sv=1)                                                   | Enables comments on marked source code parts                          |
| ![Scrp6](https://docs.agenatrader.com/~gitbook/image?url=https%3A%2F%2F2805764894-files.gitbook.io%2F%7E%2Ffiles%2Fv0%2Fb%2Fgitbook-legacy-files%2Fo%2Fassets%252F-MKZSsJBtSP9L4sqIe_q%252F-MQlkXnxEvvGK-rs8ZpV%252F-MQlqOlD-0kij_4D-is9%252Fscrp6.png%3Falt%3Dmedia%26token%3D6c68b0a3-3cfb-4c8a-b543-9b70758b7b3e\&width=300\&dpr=4\&quality=100\&sign=a5a957ee\&sv=1)                                                   | Uncomments the selected lines                                         |
| ![Scrp7](https://docs.agenatrader.com/~gitbook/image?url=https%3A%2F%2F2805764894-files.gitbook.io%2F%7E%2Ffiles%2Fv0%2Fb%2Fgitbook-legacy-files%2Fo%2Fassets%252F-MKZSsJBtSP9L4sqIe_q%252F-MQlkXnxEvvGK-rs8ZpV%252F-MQlqRxihQl1b9w0R0I7%252Fscrp7.png%3Falt%3Dmedia%26token%3Dc7559894-1b36-4707-a95a-3f692e1a229c\&width=300\&dpr=4\&quality=100\&sign=73d785ca\&sv=1)                                                   | Cancels previous action(s)                                            |
| ![Scrp8](https://docs.agenatrader.com/~gitbook/image?url=https%3A%2F%2F2805764894-files.gitbook.io%2F%7E%2Ffiles%2Fv0%2Fb%2Fgitbook-legacy-files%2Fo%2Fassets%252F-MKZSsJBtSP9L4sqIe_q%252F-MQlkXnxEvvGK-rs8ZpV%252F-MQlqVklLPVISSLCuAjd%252Fscrp8.png%3Falt%3Dmedia%26token%3D17ef6c72-05cf-4634-9bf2-76eecbe2a264\&width=300\&dpr=4\&quality=100\&sign=fe1b9287\&sv=1)                                                   | Repeats cancelled action(s)                                           |
| ![Scrp9](https://docs.agenatrader.com/~gitbook/image?url=https%3A%2F%2F2805764894-files.gitbook.io%2F%7E%2Ffiles%2Fv0%2Fb%2Fgitbook-legacy-files%2Fo%2Fassets%252F-MKZSsJBtSP9L4sqIe_q%252F-MQlkXnxEvvGK-rs8ZpV%252F-MQlqZFOTEYlEWF84sf7%252Fscrp9.png%3Falt%3Dmedia%26token%3D83f8725a-a35a-4461-a5ad-03bea5ecc377\&width=300\&dpr=4\&quality=100\&sign=6056c75d\&sv=1)                                                   | Opens output window                                                   |
| ![Scrp10](https://docs.agenatrader.com/~gitbook/image?url=https%3A%2F%2F2805764894-files.gitbook.io%2F%7E%2Ffiles%2Fv0%2Fb%2Fgitbook-legacy-files%2Fo%2Fassets%252F-MKZSsJBtSP9L4sqIe_q%252F-MQlkXnxEvvGK-rs8ZpV%252F-MQlqbrfqfC9-r7-yzOB%252Fscrp10.png%3Falt%3Dmedia%26token%3D7066c2fa-2b7c-48d3-93e6-1455a13dadc1\&width=300\&dpr=4\&quality=100\&sign=95f196e4\&sv=1)                                                 | Opens reference popup                                                 |
| ![Scrp11](https://docs.agenatrader.com/~gitbook/image?url=https%3A%2F%2F2805764894-files.gitbook.io%2F%7E%2Ffiles%2Fv0%2Fb%2Fgitbook-legacy-files%2Fo%2Fassets%252F-MKZSsJBtSP9L4sqIe_q%252F-MQlkXnxEvvGK-rs8ZpV%252F-MQlqf8B3tT6z1PeOX7M%252Fscrp11.png%3Falt%3Dmedia%26token%3Db6b6a67e-6844-4309-89f4-e638b2cf645e\&width=300\&dpr=4\&quality=100\&sign=373e0a0a\&sv=1)                                                 | Compiles sources                                                      |
| ![Scrp12](https://docs.agenatrader.com/~gitbook/image?url=https%3A%2F%2F2805764894-files.gitbook.io%2F%7E%2Ffiles%2Fv0%2Fb%2Fgitbook-legacy-files%2Fo%2Fassets%252F-MKZSsJBtSP9L4sqIe_q%252F-MQlkXnxEvvGK-rs8ZpV%252F-MQlqjrsOTxbsfvbT6UK%252Fscrp12.png%3Falt%3Dmedia%26token%3D42c6e355-1a4d-4462-9aa5-b8f99e0f77e1\&width=300\&dpr=4\&quality=100\&sign=ef44149\&sv=1)                                                  | Searches for a text within source code                                |
| ![Scrp13](https://docs.agenatrader.com/~gitbook/image?url=https%3A%2F%2F2805764894-files.gitbook.io%2F%7E%2Ffiles%2Fv0%2Fb%2Fgitbook-legacy-files%2Fo%2Fassets%252F-MKZSsJBtSP9L4sqIe_q%252F-MQlkXnxEvvGK-rs8ZpV%252F-MQlqo3oWOgOKGAA1fnz%252Fscrp13.png%3Falt%3Dmedia%26token%3D22686626-8671-4421-ad1f-bcbdec439085\&width=300\&dpr=4\&quality=100\&sign=7a169f30\&sv=1)                                                 | Find/Replace                                                          |
| ![Scrp14](https://docs.agenatrader.com/~gitbook/image?url=https%3A%2F%2F2805764894-files.gitbook.io%2F%7E%2Ffiles%2Fv0%2Fb%2Fgitbook-legacy-files%2Fo%2Fassets%252F-MKZSsJBtSP9L4sqIe_q%252F-MQlkXnxEvvGK-rs8ZpV%252F-MQlqriX1AtOOYf8GIbu%252Fscrp14.png%3Falt%3Dmedia%26token%3D1f1b2a3d-2e27-4da0-828b-206f53cc8382\&width=300\&dpr=4\&quality=100\&sign=98802149\&sv=1)                                                 | Opens list of errors                                                  |
| ![Scrp15](https://docs.agenatrader.com/~gitbook/image?url=https%3A%2F%2F2805764894-files.gitbook.io%2F%7E%2Ffiles%2Fv0%2Fb%2Fgitbook-legacy-files%2Fo%2Fassets%252F-MKZSsJBtSP9L4sqIe_q%252F-MQlkXnxEvvGK-rs8ZpV%252F-MQlqwaIw9d4kcZMAwgj%252Fscrp15.png%3Falt%3Dmedia%26token%3D934fb70b-6593-48cd-bd83-db7b5dc25e50\&width=300\&dpr=4\&quality=100\&sign=8257564\&sv=1)                                                  | Deletes file                                                          |

### Visual Studio <a href="#visual_studio" id="visual_studio"></a>

Microsoft provides a complimentary version known as **Visual Studio Community Edition**, which is highly suitable for developing AgenaScript code.

Download: [**Latest Version of Visual Studio**](https://visualstudio.microsoft.com/downloads/) Download: [**Older Versions of Visual Studio**](https://visualstudio.microsoft.com/vs/older-downloads/)

Supported Versions: • **Windows 10:** VS2017, VS2019, and VS2022 (latest builds/updates)

• **Windows 11:** VS2022 only (latest builds/updates)

• Please note that VS2015 and older are not supported by Microsoft anymore hence why we will not support either

This article was created by [http://script-trading.com.](http://script-trading.com./)

### AgenaTrader and Visual Studio <a href="#agenatrader_and_visual_studio" id="agenatrader_and_visual_studio"></a>

AgenaTrader provides its proprietary script editor, which is utilized for AgenaScript development.

![](https://docs.agenatrader.com/~gitbook/image?url=https%3A%2F%2F2805764894-files.gitbook.io%2F%7E%2Ffiles%2Fv0%2Fb%2Fgitbook-legacy-files%2Fo%2Fassets%252F-MKZSsJBtSP9L4sqIe_q%252F-MQlkXnxEvvGK-rs8ZpV%252F-MQlr8y65OnNVuoXI71Z%252FMyIndicator.jpg%3Falt%3Dmedia%26token%3Dc6564143-39ec-4429-9026-0ebd1c405ce0\&width=768\&dpr=4\&quality=100\&sign=802a73ed\&sv=1)

This editor serves as an efficient tool for making swift adjustments to a few lines of code or reviewing AgenaScript. For most other purposes, it is crucial to use Microsoft's Visual Studio development environment. Visual Studio offers a comprehensive and dependable solution, proving its efficacy across multiple facets of software development, including AgenaScript and C#

The most important advantages are:

* Debugging
* Code Completion
* Syntax checking

In addition, there is a multitude of further features that make developing easier for you.

You can download the free “Visual Studio Community” edition at <https://www.visualstudio.com/downloads>.&#x20;

{% hint style="info" %}
Please note that the download and the installation of the software take about 60 minutes!
{% endhint %}

As of AgenaTrader 2.0, it is mandatory to utilize "Visual Studio Community 2017" or later versions, due to the implementation of .NET version 4.6. Please refer to the list of compatible Visual Studio versions provided above.

Once you have successfully installed Visual Studio, you can link it to AgenaTrader using the Global Configuration setting shown below. From now on, all AgenaScript files will automatically be opened with Visual Studio, and the debugger will also automatically be linked to AgenaTrader.

Global Configuration setting for Visual Studio

<figure><img src="https://docs.agenatrader.com/~gitbook/image?url=https%3A%2F%2F2805764894-files.gitbook.io%2F%7E%2Ffiles%2Fv0%2Fb%2Fgitbook-legacy-files%2Fo%2Fassets%252F-MKZSsJBtSP9L4sqIe_q%252F-MQlkXnxEvvGK-rs8ZpV%252F-MQlrF6EWTAzZUud1xfC%252Fconfiguration.png%3Falt%3Dmedia%26token%3Da57af74c-c7a2-4ef7-a020-4ab0188ae521&#x26;width=768&#x26;dpr=4&#x26;quality=100&#x26;sign=af849f07&#x26;sv=1" alt=""><figcaption></figcaption></figure>

You can now conveniently develop, test and debug your AgenaScripts in Visual Studio.

<figure><img src="https://docs.agenatrader.com/~gitbook/image?url=https%3A%2F%2F2805764894-files.gitbook.io%2F%7E%2Ffiles%2Fv0%2Fb%2Fgitbook-legacy-files%2Fo%2Fassets%252F-MKZSsJBtSP9L4sqIe_q%252F-MQlkXnxEvvGK-rs8ZpV%252F-MQlrJOS3Ko9B8kCUuZg%252FMyIndicatorVS.jpg%3Falt%3Dmedia%26token%3D54aaf414-179d-436a-ab8f-22a572f03cc9&#x26;width=768&#x26;dpr=4&#x26;quality=100&#x26;sign=7a36c314&#x26;sv=1" alt=""><figcaption></figcaption></figure>

This article was created by [http://script-trading.com.](http://script-trading.com./)

## <img src="/files/EZ0XutCJd2hEmZBWGw4t" alt="" data-size="line"> Programming of indicators <a href="#scripting__programming_of_indicators" id="scripting__programming_of_indicators"></a>

Select the **Strategy Handlings-> Scripting** and then **Indicator -> New** or **Edit** menu items to program new indicators or make changes to existing indicators.

<figure><img src="https://docs.agenatrader.com/~gitbook/image?url=https%3A%2F%2F2805764894-files.gitbook.io%2F%7E%2Ffiles%2Fv0%2Fb%2Fgitbook-legacy-files%2Fo%2Fassets%252F-MKZSsJBtSP9L4sqIe_q%252F-MQlkXnxEvvGK-rs8ZpV%252F-MQlrSByAHcM-QxB9hXB%252FScripting.png%3Falt%3Dmedia%26token%3D7a8d97b0-990b-4f4c-9d8d-f8621d8bfe1e&#x26;width=768&#x26;dpr=4&#x26;quality=100&#x26;sign=a0de85d5&#x26;sv=1" alt=""><figcaption></figcaption></figure>

### Editing indicators <a href="#editing" id="editing"></a>

Should you wish to change/modify an existing indicator, select the **Edit** menu item to open the following Indicators dialog window:

<figure><img src="https://docs.agenatrader.com/~gitbook/image?url=https%3A%2F%2F2805764894-files.gitbook.io%2F%7E%2Ffiles%2Fv0%2Fb%2Fgitbook-legacy-files%2Fo%2Fassets%252F-MKZSsJBtSP9L4sqIe_q%252F-MQlkXnxEvvGK-rs8ZpV%252F-MQlrVlLLmRDRWW6M6u3%252FEdit%2520indicators.PNG%3Falt%3Dmedia%26token%3D616abb32-2b83-4737-ac60-b0ef6be90a90&#x26;width=768&#x26;dpr=4&#x26;quality=100&#x26;sign=cc3309e5&#x26;sv=1" alt=""><figcaption></figcaption></figure>

*The buttons inside this window have the following functions:*

* Click the **Edit** button or double-click on the entry to open the scripting window for the selected indicator.
* Click the **Delete** button to remove the selected indicator.
* Click the **Compile** button to compile all indicators, conditions, strategies and alert handlers. If you delete an indicator, the system will only accept changes after you have clicked the **Compile** button.

### Creating a new indicator <a href="#creating_a_new_indicator" id="creating_a_new_indicator"></a>

After selecting the **New->Create** menu item for creating a new indicator you will receive a navigation popup with the option to either create a new indicator or import an indicator from a different trading platform:

* **Step 1.** Enter the name
  * Chart-Panel: if this is checked the indicator will be displayed in the charting panel.
  * Indicator-Panel: if this checked the indicator will be displayed beneath the chart.

<figure><img src="https://docs.agenatrader.com/~gitbook/image?url=https%3A%2F%2F2805764894-files.gitbook.io%2F%7E%2Ffiles%2Fv0%2Fb%2Fgitbook-legacy-files%2Fo%2Fassets%252F-MKZSsJBtSP9L4sqIe_q%252F-MQlkXnxEvvGK-rs8ZpV%252F-MQlrcgwGMxA-24NkMmq%252Findicator_create.png%3Falt%3Dmedia%26token%3D3504dc0c-91c9-402d-a119-2ac33c446725&#x26;width=768&#x26;dpr=4&#x26;quality=100&#x26;sign=573fd11c&#x26;sv=1" alt=""><figcaption></figcaption></figure>

* **Step 2.** Define parameters.

<figure><img src="https://docs.agenatrader.com/~gitbook/image?url=https%3A%2F%2F2805764894-files.gitbook.io%2F%7E%2Ffiles%2Fv0%2Fb%2Fgitbook-legacy-files%2Fo%2Fassets%252F-MKZSsJBtSP9L4sqIe_q%252F-MQlkXnxEvvGK-rs8ZpV%252F-MQlrhdcjFHTbQGRcTtM%252Findicator_parameters.png%3Falt%3Dmedia%26token%3De73839f2-540e-414c-8251-b097a2b651a5&#x26;width=768&#x26;dpr=4&#x26;quality=100&#x26;sign=47a70a9d&#x26;sv=1" alt=""><figcaption></figcaption></figure>

* **Step 3.** Define the Plots-Outputs for visualization of the indicator.

<figure><img src="https://docs.agenatrader.com/~gitbook/image?url=https%3A%2F%2F2805764894-files.gitbook.io%2F%7E%2Ffiles%2Fv0%2Fb%2Fgitbook-legacy-files%2Fo%2Fassets%252F-MKZSsJBtSP9L4sqIe_q%252F-MQlkXnxEvvGK-rs8ZpV%252F-MQlrosUN8MOE9gSMeS7%252Findicator_plots.png%3Falt%3Dmedia%26token%3D868bc76b-2826-4177-9600-80dbea9674b7&#x26;width=768&#x26;dpr=4&#x26;quality=100&#x26;sign=5e58eca&#x26;sv=1" alt=""><figcaption></figcaption></figure>

* **Step 4.** Define Level-Lines with the fixed threshold values (if necessary).

<figure><img src="https://docs.agenatrader.com/~gitbook/image?url=https%3A%2F%2F2805764894-files.gitbook.io%2F%7E%2Ffiles%2Fv0%2Fb%2Fgitbook-legacy-files%2Fo%2Fassets%252F-MKZSsJBtSP9L4sqIe_q%252F-MQlkXnxEvvGK-rs8ZpV%252F-MQlrzCwfMTZidB3Lunk%252Findicator_lines.png%3Falt%3Dmedia%26token%3D445ca726-26bf-4903-857d-2bd60ec5f252&#x26;width=768&#x26;dpr=4&#x26;quality=100&#x26;sign=15d105ea&#x26;sv=1" alt=""><figcaption></figcaption></figure>

* **Step 5.** Begin writing the indicator-specific program code.

<figure><img src="https://docs.agenatrader.com/~gitbook/image?url=https%3A%2F%2F2805764894-files.gitbook.io%2F%7E%2Ffiles%2Fv0%2Fb%2Fgitbook-legacy-files%2Fo%2Fassets%252F-MKZSsJBtSP9L4sqIe_q%252F-MQlkXnxEvvGK-rs8ZpV%252F-MQls6OOI4OA5T7XE3Pu%252FTrendScript.png%3Falt%3Dmedia%26token%3D300d58bc-547a-4930-a32b-b15f4436289b&#x26;width=768&#x26;dpr=4&#x26;quality=100&#x26;sign=2f19bb23&#x26;sv=1" alt=""><figcaption></figcaption></figure>

* **Step 6.** Compile the indicator by pressing the <img src="/files/NO9hi5Fvc8fodmkJBNVq" alt="" data-size="line"> button, after which it will become [available](https://docs.agenatrader.com/main/chart-area/untitled/indicators).
  * The compile function is availalbe via Strategy Handling- > Scripting -> Compile

After Indicator would be available in indicator list

<figure><img src="https://docs.agenatrader.com/~gitbook/image?url=https%3A%2F%2F2805764894-files.gitbook.io%2F%7E%2Ffiles%2Fv0%2Fb%2Fgitbook-legacy-files%2Fo%2Fassets%252F-MKZSsJBtSP9L4sqIe_q%252F-MQlkXnxEvvGK-rs8ZpV%252F-MQlsY9DtasKmPifWbOg%252Fprogramming%2520indicator.PNG%3Falt%3Dmedia%26token%3D1d2a8aa2-e336-4180-989d-a7ddfcd5ff27&#x26;width=768&#x26;dpr=4&#x26;quality=100&#x26;sign=d4db2307&#x26;sv=1" alt=""><figcaption></figcaption></figure>

## <img src="/files/gCTKUHmwyOEjAlmf5zuD" alt="" data-size="line"> Programming of conditions <a href="#scripting__programming_of_conditions" id="scripting__programming_of_conditions"></a>

Select from the main menu **Strategy Handling-> Scripting** followed by **Condition -> New** or **Edit** items to create new or modify existing conditions.

<figure><img src="https://docs.agenatrader.com/~gitbook/image?url=https%3A%2F%2F2805764894-files.gitbook.io%2F%7E%2Ffiles%2Fv0%2Fb%2Fgitbook-legacy-files%2Fo%2Fassets%252F-MKZSsJBtSP9L4sqIe_q%252F-MQlkXnxEvvGK-rs8ZpV%252F-MQlscTE5YQEVd4UWOPB%252FCondition%2520programming.png%3Falt%3Dmedia%26token%3Db7f1c497-de24-4050-b1d2-592a7e1bf906&#x26;width=768&#x26;dpr=4&#x26;quality=100&#x26;sign=70f7a6cc&#x26;sv=1" alt=""><figcaption></figcaption></figure>

### Editing conditions <a href="#editing-1" id="editing-1"></a>

If you wish to edit the existing condition, select the **Edit** submenu. You will see the following dialog box.

<figure><img src="https://docs.agenatrader.com/~gitbook/image?url=https%3A%2F%2F2805764894-files.gitbook.io%2F%7E%2Ffiles%2Fv0%2Fb%2Fgitbook-legacy-files%2Fo%2Fassets%252F-MKZSsJBtSP9L4sqIe_q%252F-MQlkXnxEvvGK-rs8ZpV%252F-MQlsgsNsWxfrHyobOYH%252FEdit%2520condition.PNG%3Falt%3Dmedia%26token%3D2bca7eab-5316-4de6-bb39-85d2554c0b9f&#x26;width=768&#x26;dpr=4&#x26;quality=100&#x26;sign=50c9091&#x26;sv=1" alt=""><figcaption></figcaption></figure>

*The buttons inside this window have the following functions:*

* Click the **Edit** button or double-click on the entry to open the programming window for the selected condition.
* Click the **Delete** button to remove the selected conditions.
* Click the **Compile** button to compile all indicators, conditions, strategies and alert handlers. If you delete a condition, the system will only accept changes after you have clicked the **Compile** button.

### Creating a new condition <a href="#creating_a_new_condition" id="creating_a_new_condition"></a>

* **Step 1.** Enter the name

<figure><img src="https://docs.agenatrader.com/~gitbook/image?url=https%3A%2F%2F2805764894-files.gitbook.io%2F%7E%2Ffiles%2Fv0%2Fb%2Fgitbook-legacy-files%2Fo%2Fassets%252F-MKZSsJBtSP9L4sqIe_q%252F-MQlkXnxEvvGK-rs8ZpV%252F-MQlsr49VQZqdLJ2thTA%252FCondition.png%3Falt%3Dmedia%26token%3D9379d5e2-e6bf-487e-9442-1a0d71927a4c&#x26;width=768&#x26;dpr=4&#x26;quality=100&#x26;sign=d6226100&#x26;sv=1" alt=""><figcaption></figcaption></figure>

* **Step 2.** Define input parameters

<figure><img src="https://docs.agenatrader.com/~gitbook/image?url=https%3A%2F%2F2805764894-files.gitbook.io%2F%7E%2Ffiles%2Fv0%2Fb%2Fgitbook-legacy-files%2Fo%2Fassets%252F-MKZSsJBtSP9L4sqIe_q%252F-MQlkXnxEvvGK-rs8ZpV%252F-MQlt0wCeaF3Ux7fjoca%252FCondition_parameters.png%3Falt%3Dmedia%26token%3D1b2b306a-9dce-4c7c-9445-8edf27316f5e&#x26;width=768&#x26;dpr=4&#x26;quality=100&#x26;sign=98c8737&#x26;sv=1" alt=""><figcaption></figcaption></figure>

* **Step 3.** Select the condition type: entry, stop or target. This will determine where the condition will appear in the SetupBuilder (EntryEscort, StopEscort or TargetEscort respectively).

Additionally, you can specify the line and color for a condition

* Entry: tba
* Stop occurred: defines the color of the signal fluctuations ("spikes") within the indicator panel; price defines the color within the chart.
* Target: tba

<figure><img src="https://docs.agenatrader.com/~gitbook/image?url=https%3A%2F%2F2805764894-files.gitbook.io%2F%7E%2Ffiles%2Fv0%2Fb%2Fgitbook-legacy-files%2Fo%2Fassets%252F-MKZSsJBtSP9L4sqIe_q%252F-MQlkXnxEvvGK-rs8ZpV%252F-MQlt8yMD69JNN0gaQQ8%252FCondition_plots.png%3Falt%3Dmedia%26token%3D195933ec-8446-4a32-aa75-d87b4818d191&#x26;width=768&#x26;dpr=4&#x26;quality=100&#x26;sign=3081a720&#x26;sv=1" alt=""><figcaption></figcaption></figure>

* **Step 4.** Begin programming the condition-specific code.

<figure><img src="https://docs.agenatrader.com/~gitbook/image?url=https%3A%2F%2F2805764894-files.gitbook.io%2F%7E%2Ffiles%2Fv0%2Fb%2Fgitbook-legacy-files%2Fo%2Fassets%252F-MKZSsJBtSP9L4sqIe_q%252F-MQlkXnxEvvGK-rs8ZpV%252F-MQltH62pRGzPJoRC8A7%252FConditionScript.png%3Falt%3Dmedia%26token%3De7cad0a4-a6da-48bc-aae7-be2e907432f1&#x26;width=768&#x26;dpr=4&#x26;quality=100&#x26;sign=96900b6b&#x26;sv=1" alt=""><figcaption></figcaption></figure>

* **Step 5.** Press the <img src="/files/NO9hi5Fvc8fodmkJBNVq" alt="" data-size="line">  button to make the condition [available](https://docs.agenatrader.com/main/chart-area/untitled/indicators).

<figure><img src="https://docs.agenatrader.com/~gitbook/image?url=https%3A%2F%2F2805764894-files.gitbook.io%2F%7E%2Ffiles%2Fv0%2Fb%2Fgitbook-legacy-files%2Fo%2Fassets%252F-MKZSsJBtSP9L4sqIe_q%252F-MQlkXnxEvvGK-rs8ZpV%252F-MQltTOMjk2yBHRvwnXt%252FIndicator%2520tab.PNG%3Falt%3Dmedia%26token%3D0ccd258a-9ba3-4089-ad5e-1a2728009a43&#x26;width=768&#x26;dpr=4&#x26;quality=100&#x26;sign=9e96ee09&#x26;sv=1" alt=""><figcaption></figcaption></figure>

## <img src="/files/6cO5MF41E6xra8s66tZv" alt="" data-size="line"> Programming of strategies <a href="#scripting__programming_of_strategies" id="scripting__programming_of_strategies"></a>

Select from the main menu **Strategy Handling-> Scripting** and then **Strategy -> New** or **Edit** to program new or edit the existing strategy.

<figure><img src="https://docs.agenatrader.com/~gitbook/image?url=https%3A%2F%2F2805764894-files.gitbook.io%2F%7E%2Ffiles%2Fv0%2Fb%2Fgitbook-legacy-files%2Fo%2Fassets%252F-MKZSsJBtSP9L4sqIe_q%252F-MQlkXnxEvvGK-rs8ZpV%252F-MQltYpIPv98pQNcV18y%252FStrategy%2520progr.png%3Falt%3Dmedia%26token%3D9e7c1280-541e-4ba6-9e1b-82b78e134c30&#x26;width=768&#x26;dpr=4&#x26;quality=100&#x26;sign=c72c10e7&#x26;sv=1" alt=""><figcaption></figcaption></figure>

### Editing strategy <a href="#editing-2" id="editing-2"></a>

If you wish to edit the existing strategy, select the **Edit** submenu. You will see the following dialog box:

<figure><img src="https://docs.agenatrader.com/~gitbook/image?url=https%3A%2F%2F2805764894-files.gitbook.io%2F%7E%2Ffiles%2Fv0%2Fb%2Fgitbook-legacy-files%2Fo%2Fassets%252F-MKZSsJBtSP9L4sqIe_q%252F-MQlkXnxEvvGK-rs8ZpV%252F-MQltgLryosnsrVZR4N2%252FEdit%2520strategies.PNG%3Falt%3Dmedia%26token%3Dc8b6be2a-84cb-4ddd-bfea-fc23470aafa3&#x26;width=768&#x26;dpr=4&#x26;quality=100&#x26;sign=a9e92028&#x26;sv=1" alt=""><figcaption></figcaption></figure>

*The buttons inside this window have the following functions:*

* Click the **Edit** button or double-click on the entry to open the programming window for the selected strategy.
* Click the **Delete** button to remove the selected strategies.
* Click the **Compile** button to compile all indicators, conditions, strategies and alert handlers. If you delete a strategy, the system will only accept changes after you have clicked the **Compile** button.

#### Creating a new strategy <a href="#creating_a_new_strategy" id="creating_a_new_strategy"></a>

After selecting the **New->Create**menu item for creating a new strategy you will receive a navigation popup with the option to either create a new strategy or import a strategy from a different trading platform:

* **Step 1.** Enter the name

<figure><img src="https://docs.agenatrader.com/~gitbook/image?url=https%3A%2F%2F2805764894-files.gitbook.io%2F%7E%2Ffiles%2Fv0%2Fb%2Fgitbook-legacy-files%2Fo%2Fassets%252F-MKZSsJBtSP9L4sqIe_q%252F-MQlkXnxEvvGK-rs8ZpV%252F-MQltoScLCk8ucFb824N%252FStrategy.png%3Falt%3Dmedia%26token%3D5c60ed1f-bcaa-4253-ba4c-8bac38b0b831&#x26;width=768&#x26;dpr=4&#x26;quality=100&#x26;sign=45dacf26&#x26;sv=1" alt=""><figcaption></figcaption></figure>

* **Step 2.** Define input parameters.

<figure><img src="https://docs.agenatrader.com/~gitbook/image?url=https%3A%2F%2F2805764894-files.gitbook.io%2F%7E%2Ffiles%2Fv0%2Fb%2Fgitbook-legacy-files%2Fo%2Fassets%252F-MKZSsJBtSP9L4sqIe_q%252F-MQlkXnxEvvGK-rs8ZpV%252F-MQlttkeER0YTtMBN7cp%252FStrategy_parameters.png%3Falt%3Dmedia%26token%3D8f862fd4-d593-48c4-96da-a81cd270a828&#x26;width=768&#x26;dpr=4&#x26;quality=100&#x26;sign=b4282b26&#x26;sv=1" alt=""><figcaption></figcaption></figure>

* **Step 3.** Begin programming the strategy-specific code.

<figure><img src="https://docs.agenatrader.com/~gitbook/image?url=https%3A%2F%2F2805764894-files.gitbook.io%2F%7E%2Ffiles%2Fv0%2Fb%2Fgitbook-legacy-files%2Fo%2Fassets%252F-MKZSsJBtSP9L4sqIe_q%252F-MQlkXnxEvvGK-rs8ZpV%252F-MQlu03IuWXkzSeMktXy%252Fstep%25203%2520%281%29.PNG%3Falt%3Dmedia%26token%3Dacb82a2d-c0d8-4c47-8ac2-14aaa56ad05e&#x26;width=768&#x26;dpr=4&#x26;quality=100&#x26;sign=8218fdee&#x26;sv=1" alt=""><figcaption></figcaption></figure>

* **Step 4.** Press the <img src="/files/NO9hi5Fvc8fodmkJBNVq" alt="" data-size="line"> button to make the strategy [available](https://docs.agenatrader.com/main/chart-area/untitled/strategies).

<figure><img src="https://docs.agenatrader.com/~gitbook/image?url=https%3A%2F%2F2805764894-files.gitbook.io%2F%7E%2Ffiles%2Fv0%2Fb%2Fgitbook-legacy-files%2Fo%2Fassets%252F-MKZSsJBtSP9L4sqIe_q%252F-MQlkXnxEvvGK-rs8ZpV%252F-MQluM3afe7rw3W0PbxT%252FStrategies.PNG%3Falt%3Dmedia%26token%3D986f0a12-9bd0-4202-9a70-09fcbe0170d5&#x26;width=768&#x26;dpr=4&#x26;quality=100&#x26;sign=bc57a9a1&#x26;sv=1" alt=""><figcaption></figcaption></figure>

## <img src="/files/SmGyfMnirLmQYXSb2wBw" alt="" data-size="line"> Programming of Alert Handlers <a href="#scripting__programming_of_alert_handlers" id="scripting__programming_of_alert_handlers"></a>

AgenaTrader's extensive functionalities allow you to code custom price and time alerts within a single (or multiple) self-programmed alert handler(s). Programming in AgenaTrader is based on the Microsoft C#/.net language which enables you to control the system environment and use/code features such as email, SMS, blog entries etc.

Select from the main menu **Strategy Handling-> Scripting** following by **Alert Handler -> New** or **Edit** items to programm new or edit existing alerts.

<figure><img src="https://docs.agenatrader.com/~gitbook/image?url=https%3A%2F%2F2805764894-files.gitbook.io%2F%7E%2Ffiles%2Fv0%2Fb%2Fgitbook-legacy-files%2Fo%2Fassets%252F-MKZSsJBtSP9L4sqIe_q%252F-MQlkXnxEvvGK-rs8ZpV%252F-MQluUrUm-Rj2iWb6TS5%252FAlert%2520Handler.png%3Falt%3Dmedia%26token%3D82302192-e8ca-4d6c-95f7-8e04ae6de591&#x26;width=768&#x26;dpr=4&#x26;quality=100&#x26;sign=dd7542b&#x26;sv=1" alt=""><figcaption></figcaption></figure>

For example, in the **Time alert tab** you can select an entry reason for an alert.

<figure><img src="https://docs.agenatrader.com/~gitbook/image?url=https%3A%2F%2F2805764894-files.gitbook.io%2F%7E%2Ffiles%2Fv0%2Fb%2Fgitbook-legacy-files%2Fo%2Fassets%252F-MKZSsJBtSP9L4sqIe_q%252F-MQlkXnxEvvGK-rs8ZpV%252F-MQlu_UvZUVo4xiNl7m6%252Fscripting_alertDialog.png%3Falt%3Dmedia%26token%3D4fd2b9fe-6564-4905-b648-4811d5fb1ed5&#x26;width=768&#x26;dpr=4&#x26;quality=100&#x26;sign=4f10fd13&#x26;sv=1" alt=""><figcaption></figcaption></figure>

Once your price or time alert is triggered, all existing alerts will be opened. You will see the reason for the alert inside this window and can terminate the current alert.

### Editing Alert Handler <a href="#editing-3" id="editing-3"></a>

If you wish to edit the existing alert handler select the **Edit** submenu. You will see the following dialog box:

<figure><img src="https://docs.agenatrader.com/~gitbook/image?url=https%3A%2F%2F2805764894-files.gitbook.io%2F%7E%2Ffiles%2Fv0%2Fb%2Fgitbook-legacy-files%2Fo%2Fassets%252F-MKZSsJBtSP9L4sqIe_q%252F-MQlkXnxEvvGK-rs8ZpV%252F-MQluej8buvfmHFaEhKT%252Fedit%2520alert.PNG%3Falt%3Dmedia%26token%3D44d8b093-28c6-411f-96ec-11617afc07ca&#x26;width=768&#x26;dpr=4&#x26;quality=100&#x26;sign=62c2f1ad&#x26;sv=1" alt=""><figcaption></figcaption></figure>

*The buttons inside this window have the following functions:*

* Click the **Edit** button or double-click on the entry to open the programming window for the selected alert handler.
* Click the **Delete** button to remove the selected alert handler.
* Click the **Compile** button to compile all indicators, conditions, strategies and alert handlers. If you delete an alert handler, the system will only accept changes after you have clicked the **Compile** button.

### Creating a new Alert Handler <a href="#creating_a_new_alert_handler" id="creating_a_new_alert_handler"></a>

* **Step 1.** Enter the name and a short description.

<figure><img src="https://docs.agenatrader.com/~gitbook/image?url=https%3A%2F%2F2805764894-files.gitbook.io%2F%7E%2Ffiles%2Fv0%2Fb%2Fgitbook-legacy-files%2Fo%2Fassets%252F-MKZSsJBtSP9L4sqIe_q%252F-MQlkXnxEvvGK-rs8ZpV%252F-MQlupPSdCOumC3nr8-T%252Falert.png%3Falt%3Dmedia%26token%3Df57c0520-b44f-4475-9612-24b45df9b118&#x26;width=768&#x26;dpr=4&#x26;quality=100&#x26;sign=6623b95b&#x26;sv=1" alt=""><figcaption></figcaption></figure>

* **Step 2.** Click on the **Next** button and begin programming the alert-specific code.

<figure><img src="https://docs.agenatrader.com/~gitbook/image?url=https%3A%2F%2F2805764894-files.gitbook.io%2F%7E%2Ffiles%2Fv0%2Fb%2Fgitbook-legacy-files%2Fo%2Fassets%252F-MKZSsJBtSP9L4sqIe_q%252F-MQlkXnxEvvGK-rs8ZpV%252F-MQlv-p4FEzl2k2UIhfS%252FStep2.PNG%3Falt%3Dmedia%26token%3D216b9398-ff35-47cd-935e-9c8392b075ba&#x26;width=768&#x26;dpr=4&#x26;quality=100&#x26;sign=aca9b6a5&#x26;sv=1" alt=""><figcaption></figcaption></figure>

* **Step 3.** Click the <img src="/files/NO9hi5Fvc8fodmkJBNVq" alt="" data-size="line"> button to make the alert handler available (with all other alert handlers). When a price or time alert is triggered, each Alert Handler will search for ways to handle it, if necessary.

### Example. Alert Handler for sending emails <a href="#example-._alert_handler_for_sending_emails" id="example-._alert_handler_for_sending_emails"></a>

A straightforward way to integrate a price or time alert with the Alert Handler is by utilizing the alert reason. For instance, if the alert reason field includes "Send Email," the programmed alert will activate immediately once the alert handler detects this reason.

<figure><img src="https://docs.agenatrader.com/~gitbook/image?url=https%3A%2F%2F2805764894-files.gitbook.io%2F%7E%2Ffiles%2Fv0%2Fb%2Fgitbook-legacy-files%2Fo%2Fassets%252F-MKZSsJBtSP9L4sqIe_q%252F-MQlkXnxEvvGK-rs8ZpV%252F-MQlvJD7aMgBoi9zkXxU%252FStep3.PNG%3Falt%3Dmedia%26token%3D353627c6-d14c-490e-b22a-8981371cd128&#x26;width=768&#x26;dpr=4&#x26;quality=100&#x26;sign=abfd8145&#x26;sv=1" alt=""><figcaption></figcaption></figure>

## <img src="/files/C8Ig2RJK4zwo5j7gOhOi" alt="" data-size="line"> Output window <a href="#output-window" id="output-window"></a>

The output tab displays messages that have been built into self-programmed indicators, strategies, alert handlers, etc. based on the print method.

This tab can also be used for troubleshooting (debugging), but besides this it has no other functionalities.

<figure><img src="https://docs.agenatrader.com/~gitbook/image?url=https%3A%2F%2F2805764894-files.gitbook.io%2F%7E%2Ffiles%2Fv0%2Fb%2Fgitbook-legacy-files%2Fo%2Fassets%252F-MKZSsJBtSP9L4sqIe_q%252F-MQlkXnxEvvGK-rs8ZpV%252F-MQlvMqX5gYTPxzUX8Rn%252Foutput%2520window.png%3Falt%3Dmedia%26token%3D77111583-c8a1-4140-b109-fcedba6ec979&#x26;width=768&#x26;dpr=4&#x26;quality=100&#x26;sign=be471a5f&#x26;sv=1" alt=""><figcaption></figcaption></figure>

Right click in the tab and select the **Clear** option to delete all entries in the output tab.

## <img src="/files/4jhjo426n8TMK454hSR0" alt="" data-size="line"> Scripting references <a href="#scripting-references" id="scripting-references"></a>

Select **Strategy Handling-> Scripting** following by **Scripting references** from the menu to load the necessary references for programming or to edit them.

<figure><img src="https://docs.agenatrader.com/~gitbook/image?url=https%3A%2F%2F2805764894-files.gitbook.io%2F%7E%2Ffiles%2Fv0%2Fb%2Fgitbook-legacy-files%2Fo%2Fassets%252F-MKZSsJBtSP9L4sqIe_q%252F-MQlkXnxEvvGK-rs8ZpV%252F-MQlvQgSVgusYe8CQGJd%252FScripting%2520reference.png%3Falt%3Dmedia%26token%3D5bd26e5d-abe9-46fb-b0ea-1323a62158d6&#x26;width=768&#x26;dpr=4&#x26;quality=100&#x26;sign=9d6d114c&#x26;sv=1" alt=""><figcaption></figcaption></figure>

The following window will be opened:

<figure><img src="https://docs.agenatrader.com/~gitbook/image?url=https%3A%2F%2F2805764894-files.gitbook.io%2F%7E%2Ffiles%2Fv0%2Fb%2Fgitbook-legacy-files%2Fo%2Fassets%252F-MKZSsJBtSP9L4sqIe_q%252F-MQlkXnxEvvGK-rs8ZpV%252F-MQlvU9SVhhs1la2zt9w%252Fscripting%2520references.PNG%3Falt%3Dmedia%26token%3Dcf92bb9a-f20f-482c-86a1-2cd6051c8a16&#x26;width=768&#x26;dpr=4&#x26;quality=100&#x26;sign=ee21f657&#x26;sv=1" alt=""><figcaption></figcaption></figure>

The references can be selected from the top tabs **.Net, COM** and **Browse**.

*The buttons inside this window have the following functions:*

* Click the **Add** button to attach the references to the reference list.
* Click the **Remove** button to delete a reference from the reference list.
* Click the **OK** button to accept the changes.

## <img src="/files/NO9hi5Fvc8fodmkJBNVq" alt="" data-size="line"> Compile <a href="#scripting__compile" id="scripting__compile"></a>

To integrate self-programmed alert handlers, indicators, conditions, strategies, or conditions compiled from external sources using **Signal Builder** into AgenaTrader, copy the \*.CSV file from **Documents/AgenaTrader/UserCode/** into the corresponding subfolder "Scripted alert handlers (indicators, conditions, strategies)" or into the **Signal Builder** subfolder. Then select **Strategy Handling-> Scripting -> Compile** to make these available within AgenaTrader.

**Directory structure**

<figure><img src="https://docs.agenatrader.com/~gitbook/image?url=https%3A%2F%2F2805764894-files.gitbook.io%2F%7E%2Ffiles%2Fv0%2Fb%2Fgitbook-legacy-files%2Fo%2Fassets%252F-MKZSsJBtSP9L4sqIe_q%252F-MQlvW_NcVCkiaT0Hw_5%252F-MQlwGPBn-I6UtXTvc5s%252Fdirectory_structure_eng.png%3Falt%3Dmedia%26token%3D5d3ff019-c23a-4248-91df-5c4275c6ef19&#x26;width=768&#x26;dpr=4&#x26;quality=100&#x26;sign=d66e7a0b&#x26;sv=1" alt=""><figcaption></figcaption></figure>

### **Compiling errors**

If the compilation procedure generates errors, this information will appear in a dialog box indicating where the error comes from.

1\. Display Error description 2. Display file name. Left click on file name will open file location.

<figure><img src="https://docs.agenatrader.com/~gitbook/image?url=https%3A%2F%2F2805764894-files.gitbook.io%2F%7E%2Ffiles%2Fv0%2Fb%2Fgitbook-legacy-files%2Fo%2Fassets%252F-MKZSsJBtSP9L4sqIe_q%252F-MQlvW_NcVCkiaT0Hw_5%252F-MQlwOwfaNZNQ-stZ4E0%252FCompilation_Error.png%3Falt%3Dmedia%26token%3D22a147fe-95f3-4415-9d1d-aa126bf10f05&#x26;width=768&#x26;dpr=4&#x26;quality=100&#x26;sign=245e1a3a&#x26;sv=1" alt=""><figcaption></figcaption></figure>

You may use the Visual Studio instead of the internal Script (programming environment) just activate **Use Visual Studio** checkbox in Global Configuration

<figure><img src="https://docs.agenatrader.com/~gitbook/image?url=https%3A%2F%2F2805764894-files.gitbook.io%2F%7E%2Ffiles%2Fv0%2Fb%2Fgitbook-legacy-files%2Fo%2Fassets%252F-MKZSsJBtSP9L4sqIe_q%252F-MQlvW_NcVCkiaT0Hw_5%252F-MQlwTm8jMzSGiFhayPe%252Fconfiguration%2520%281%29.png%3Falt%3Dmedia%26token%3D244f2787-128c-4011-8bc7-15782574786d&#x26;width=768&#x26;dpr=4&#x26;quality=100&#x26;sign=131ddb68&#x26;sv=1" alt=""><figcaption></figcaption></figure>

#### Scripted Conditions Error <a href="#scripted_conditions_error" id="scripted_conditions_error"></a>

In order to solve the issue User should verify conditions scripts and try to compile again.

* Select from the main menu **Strategy Handling-> Scripting**-> **Condition** ->**Edit** items to verify condition.

<figure><img src="https://docs.agenatrader.com/~gitbook/image?url=https%3A%2F%2F2805764894-files.gitbook.io%2F%7E%2Ffiles%2Fv0%2Fb%2Fgitbook-legacy-files%2Fo%2Fassets%252F-MKZSsJBtSP9L4sqIe_q%252F-MQlvW_NcVCkiaT0Hw_5%252F-MQlwX_NMDIk2hiZOVOB%252FCondition%2520programming%2520%281%29.png%3Falt%3Dmedia%26token%3Df07e7533-59c3-4b48-98fa-88fa58789284&#x26;width=768&#x26;dpr=4&#x26;quality=100&#x26;sign=233979be&#x26;sv=1" alt=""><figcaption></figcaption></figure>

* In the following dialog box click the **Edit** button or double-click on the entry to open the programming window for the selected condition.

<figure><img src="https://docs.agenatrader.com/~gitbook/image?url=https%3A%2F%2F2805764894-files.gitbook.io%2F%7E%2Ffiles%2Fv0%2Fb%2Fgitbook-legacy-files%2Fo%2Fassets%252F-MKZSsJBtSP9L4sqIe_q%252F-MQlvW_NcVCkiaT0Hw_5%252F-MQlwa23yJJi9_wooSg0%252FEdit%2520condition%2520%281%29.PNG%3Falt%3Dmedia%26token%3Dee47be3f-d153-477c-a2b0-1b48aeeb9a67&#x26;width=768&#x26;dpr=4&#x26;quality=100&#x26;sign=2da429aa&#x26;sv=1" alt=""><figcaption></figcaption></figure>

* Check and correct the condition-specific code. After click **Compile** <img src="/files/NO9hi5Fvc8fodmkJBNVq" alt="" data-size="line"> (in Visual Studio the Build) button.

<figure><img src="https://docs.agenatrader.com/~gitbook/image?url=https%3A%2F%2F2805764894-files.gitbook.io%2F%7E%2Ffiles%2Fv0%2Fb%2Fgitbook-legacy-files%2Fo%2Fassets%252F-MKZSsJBtSP9L4sqIe_q%252F-MQlvW_NcVCkiaT0Hw_5%252F-MQlwkcLjV3H_Rq2sO7w%252FConditionScript%2520%281%29.png%3Falt%3Dmedia%26token%3D959cb3a2-72c5-40ce-9386-dc595126fb44&#x26;width=768&#x26;dpr=4&#x26;quality=100&#x26;sign=77f24345&#x26;sv=1" alt=""><figcaption></figcaption></figure>

### Scripted Indicator Error <a href="#scripted_indicator_error" id="scripted_indicator_error"></a>

In order to solve the issue User should verify indicator scripts and try to compile again.

* Select the **Strategy Handlings-> Scripting**->\_\_Indicator -> Edit to verify indicator.

<figure><img src="https://docs.agenatrader.com/~gitbook/image?url=https%3A%2F%2F2805764894-files.gitbook.io%2F%7E%2Ffiles%2Fv0%2Fb%2Fgitbook-legacy-files%2Fo%2Fassets%252F-MKZSsJBtSP9L4sqIe_q%252F-MQlvW_NcVCkiaT0Hw_5%252F-MQlwp_n2A50C-M5ExZK%252FScripting%2520%281%29.png%3Falt%3Dmedia%26token%3D14972c63-9618-48d8-bcca-d9940455ac92&#x26;width=768&#x26;dpr=4&#x26;quality=100&#x26;sign=f7f0a011&#x26;sv=1" alt=""><figcaption></figcaption></figure>

* In the following dialog box click the **Edit** button or double-click on the entry to open the programming window for the selected indicator.

<figure><img src="https://docs.agenatrader.com/~gitbook/image?url=https%3A%2F%2F2805764894-files.gitbook.io%2F%7E%2Ffiles%2Fv0%2Fb%2Fgitbook-legacy-files%2Fo%2Fassets%252F-MKZSsJBtSP9L4sqIe_q%252F-MQlvW_NcVCkiaT0Hw_5%252F-MQlwxyi_1HEz0V756hR%252FEdit%2520indicators%2520%281%29.PNG%3Falt%3Dmedia%26token%3Db5f94191-9c23-481d-9c8f-54448f79e724&#x26;width=768&#x26;dpr=4&#x26;quality=100&#x26;sign=56b872c2&#x26;sv=1" alt=""><figcaption></figcaption></figure>

* Check and correct the indicator-specific code. After click **Compile** <img src="/files/NO9hi5Fvc8fodmkJBNVq" alt="" data-size="line"> (in Visual Studio the Build) button.

<figure><img src="https://docs.agenatrader.com/~gitbook/image?url=https%3A%2F%2F2805764894-files.gitbook.io%2F%7E%2Ffiles%2Fv0%2Fb%2Fgitbook-legacy-files%2Fo%2Fassets%252F-MKZSsJBtSP9L4sqIe_q%252F-MQlvW_NcVCkiaT0Hw_5%252F-MQlx5rRhbhOA6CvlPDL%252FTrendScript%2520%281%29.png%3Falt%3Dmedia%26token%3D6d9f5999-580c-421d-9e5d-6fda9eb77293&#x26;width=768&#x26;dpr=4&#x26;quality=100&#x26;sign=d242345f&#x26;sv=1" alt=""><figcaption></figcaption></figure>

### Scripted Strategies Error <a href="#scripted_strategies_error" id="scripted_strategies_error"></a>

In order to solve the issue User should verify strategy scripts and try to compile again.

* Select from the main menu **Strategy Handling-> Scripting** -> **Strategy ->** Edit item to verify condition. strategy.

<figure><img src="https://docs.agenatrader.com/~gitbook/image?url=https%3A%2F%2F2805764894-files.gitbook.io%2F%7E%2Ffiles%2Fv0%2Fb%2Fgitbook-legacy-files%2Fo%2Fassets%252F-MKZSsJBtSP9L4sqIe_q%252F-MQlvW_NcVCkiaT0Hw_5%252F-MQlxCR4u7I0Ic9BTgaf%252FStrategy%2520progr%2520%281%29.png%3Falt%3Dmedia%26token%3D49634dc1-eb57-42b2-9903-6c857e1a2b0b&#x26;width=768&#x26;dpr=4&#x26;quality=100&#x26;sign=cdda7272&#x26;sv=1" alt=""><figcaption></figcaption></figure>

* In the following dialog box click the **Edit** button or double-click on the entry to open the programming window for the selected strategy.

<figure><img src="https://docs.agenatrader.com/~gitbook/image?url=https%3A%2F%2F2805764894-files.gitbook.io%2F%7E%2Ffiles%2Fv0%2Fb%2Fgitbook-legacy-files%2Fo%2Fassets%252F-MKZSsJBtSP9L4sqIe_q%252F-MQlvW_NcVCkiaT0Hw_5%252F-MQlxGMyyXsek3LP_ofn%252FEdit%2520strategies%2520%281%29.PNG%3Falt%3Dmedia%26token%3D5e354c97-36d2-4e69-8f37-fcc7af162f1f&#x26;width=768&#x26;dpr=4&#x26;quality=100&#x26;sign=d1b299f5&#x26;sv=1" alt=""><figcaption></figcaption></figure>

* Check and correct the strategy-specific code. After you finished click **Compile** <img src="/files/NO9hi5Fvc8fodmkJBNVq" alt="" data-size="line"> (in Visual Studio the Build) button.

<figure><img src="https://docs.agenatrader.com/~gitbook/image?url=https%3A%2F%2F2805764894-files.gitbook.io%2F%7E%2Ffiles%2Fv0%2Fb%2Fgitbook-legacy-files%2Fo%2Fassets%252F-MKZSsJBtSP9L4sqIe_q%252F-MQlvW_NcVCkiaT0Hw_5%252F-MQlxVqZ6eCpoGJ1RMc4%252Fstep%25203%2520%282%29.PNG%3Falt%3Dmedia%26token%3Dd73b2940-ebc1-4295-abd4-0e95ce85097f&#x26;width=768&#x26;dpr=4&#x26;quality=100&#x26;sign=18f8cccb&#x26;sv=1" alt=""><figcaption></figcaption></figure>

### Сonditions and Scripts are disappeared

There are several ways to solve this issue:

* Download and install the latest release of AgenaTrader. Download link [**here**](https://agenatrader.com/download/AgenaTrader_Setup.exe)
* Please go to **Strategie Handling->Scripting** and click on **Compile** button

<figure><img src="https://docs.agenatrader.com/~gitbook/image?url=https%3A%2F%2F2805764894-files.gitbook.io%2F%7E%2Ffiles%2Fv0%2Fb%2Fgitbook-legacy-files%2Fo%2Fassets%252F-MKZSsJBtSP9L4sqIe_q%252F-MQwPCScTa47vxWsw7R-%252F-MQwSPttYe-vLXDqb4wR%252Fcompile.png%3Falt%3Dmedia%26token%3D311797e0-68a8-475e-8f2e-b0f805d221f5&#x26;width=768&#x26;dpr=4&#x26;quality=100&#x26;sign=8ce7e364&#x26;sv=1" alt=""><figcaption></figcaption></figure>

**Important!** In some cases, User can get compiling errors. Please find details about how to solve this on page [**Compile Errors**](https://docs.agenatrader.com/create-your-own-trading-strategy/scripting#Compile_Errors)

* Please check the destination of script files. They should be located: **C:\Users\\'User\_name'\Documents\AgenaTrader\UserCode\ folders: Indicators, Scanns, ScriptedConditions, Strategies or AlertHandlers** (depends on Script type). In case you find them in other location, just copy them to the destination folder and click **Compile** button.

<figure><img src="https://docs.agenatrader.com/~gitbook/image?url=https%3A%2F%2F2805764894-files.gitbook.io%2F%7E%2Ffiles%2Fv0%2Fb%2Fgitbook-legacy-files%2Fo%2Fassets%252F-MKZSsJBtSP9L4sqIe_q%252F-MQwPCScTa47vxWsw7R-%252F-MQwSWK4SBrzzYyYCWzy%252FUserCode.png%3Falt%3Dmedia%26token%3D642aec75-d030-42b9-9941-2f2a80b1943b&#x26;width=768&#x26;dpr=4&#x26;quality=100&#x26;sign=f93d0bc2&#x26;sv=1" alt=""><figcaption></figcaption></figure>

* Conditions might disappear because your packages were not updated to the latest version. In this case please select **Tools -> Packages -> Imported Packages** from the main menu.

<figure><img src="https://docs.agenatrader.com/~gitbook/image?url=https%3A%2F%2F2805764894-files.gitbook.io%2F%7E%2Ffiles%2Fv0%2Fb%2Fgitbook-legacy-files%2Fo%2Fassets%252F-MKZSsJBtSP9L4sqIe_q%252F-MQwPCScTa47vxWsw7R-%252F-MQwSaeyb9-W5KlGufP6%252FPAckage.png%3Falt%3Dmedia%26token%3D384a26ca-f4ee-4e2a-8938-e9f6a2ad4ea8&#x26;width=768&#x26;dpr=4&#x26;quality=100&#x26;sign=7a140bed&#x26;sv=1" alt=""><figcaption></figcaption></figure>

In open tab please check version of your add on. **Up-to-date** button means that your addon is already updated.

<figure><img src="https://docs.agenatrader.com/~gitbook/image?url=https%3A%2F%2F2805764894-files.gitbook.io%2F%7E%2Ffiles%2Fv0%2Fb%2Fgitbook-legacy-files%2Fo%2Fassets%252F-MKZSsJBtSP9L4sqIe_q%252F-MQwPCScTa47vxWsw7R-%252F-MQwSl293RFC8DJc-JDz%252F1.png%3Falt%3Dmedia%26token%3D8a1c5d78-7cd0-4278-96d4-1880241546a3&#x26;width=768&#x26;dpr=4&#x26;quality=100&#x26;sign=c20537ef&#x26;sv=1" alt=""><figcaption></figcaption></figure>

**Update Available** means that you add on version is obsolete.

<figure><img src="https://docs.agenatrader.com/~gitbook/image?url=https%3A%2F%2F2805764894-files.gitbook.io%2F%7E%2Ffiles%2Fv0%2Fb%2Fgitbook-legacy-files%2Fo%2Fassets%252F-MKZSsJBtSP9L4sqIe_q%252F-MQwPCScTa47vxWsw7R-%252F-MQwSpp-WmkFnvcFC3zs%252Fupdate.png%3Falt%3Dmedia%26token%3D19ccea19-5675-4ec3-9286-5090a5018de0&#x26;width=768&#x26;dpr=4&#x26;quality=100&#x26;sign=47c5c909&#x26;sv=1" alt=""><figcaption></figcaption></figure>

To update add on please click on **Update Available** button and in open dialog click button **Yes**

<figure><img src="https://docs.agenatrader.com/~gitbook/image?url=https%3A%2F%2F2805764894-files.gitbook.io%2F%7E%2Ffiles%2Fv0%2Fb%2Fgitbook-legacy-files%2Fo%2Fassets%252F-MKZSsJBtSP9L4sqIe_q%252F-MQwPCScTa47vxWsw7R-%252F-MQwSuTucB9H3XV1ht-U%252FUpdate_routine.png%3Falt%3Dmedia%26token%3Dbb2aca7d-541b-4d37-952b-5af1ba490a82&#x26;width=768&#x26;dpr=4&#x26;quality=100&#x26;sign=b989ab1d&#x26;sv=1" alt=""><figcaption></figcaption></figure>


# Package first steps

## <img src="/files/MWSbs6gBrA27dX8HJ8OO" alt="" data-size="line"> Import packages&#x20;

### **Entering the package license key**

Along with activating the AgenaTrader software, in the "License Activation" Setup, you can also activate the license key for packages. To do so, you need to select the package name in order to enable the activation box. The "Activate" button activates the license key.

<figure><img src="https://docs.agenatrader.com/~gitbook/image?url=https%3A%2F%2F2805764894-files.gitbook.io%2F%7E%2Ffiles%2Fv0%2Fb%2Fgitbook-legacy-files%2Fo%2Fassets%252F-MKZSsJBtSP9L4sqIe_q%252F-MQuyUOvSDf10S_TO9Zp%252F-MQw0oB9mCXaB1lvT7ZK%252Factivate.png%3Falt%3Dmedia%26token%3Df8a41b6b-f35f-4c99-b690-186ba56e9858&#x26;width=768&#x26;dpr=4&#x26;quality=100&#x26;sign=c3efc146&#x26;sv=1" alt=""><figcaption></figcaption></figure>

### **Creating or importing a package**

The setup is located in the main menu bar in the "TOOLS" tab under the category "Packages", followed by Create package or Import package, and the displaying or deleting of already imported packages.

<figure><img src="https://docs.agenatrader.com/~gitbook/image?url=https%3A%2F%2F2805764894-files.gitbook.io%2F%7E%2Ffiles%2Fv0%2Fb%2Fgitbook-legacy-files%2Fo%2Fassets%252F-MKZSsJBtSP9L4sqIe_q%252F-MQuyUOvSDf10S_TO9Zp%252F-MQw1PxaIbqCchkvB1Yv%252Fpackage.png%3Falt%3Dmedia%26token%3De1803930-055a-4b97-adad-2eb63745085e&#x26;width=768&#x26;dpr=4&#x26;quality=100&#x26;sign=4cd4a76a&#x26;sv=1" alt=""><figcaption></figcaption></figure>

### **Import package - setup**

Once "Import package" has been selected, AgenaTrader opens a window asking whether a backup has already been created. If this not the case, you should click on cancel and create a backup. If it has, you can continue with "Ok". A new window opens up so that you can select the package file. When you click on Open, the package is automatically imported. This can take several seconds.

{% hint style="info" %}
Package files can be downloaded from here: [Link](https://agenatrader.com/download/appstore/V3/)
{% endhint %}

## <img src="/files/wUcaxRF0LCZgQaHkrPpn" alt="" data-size="line"> Create a package <a href="#create-packages-setup" id="create-packages-setup"></a>

AgenaTrader allows you to create packages that can be exported and imported on other computers. These packages can include:

* **Conditions**
* **Indicators**
* **Strategies**
* **Chart templates**
* **Workspaces**, etc.

<figure><img src="https://docs.agenatrader.com/~gitbook/image?url=https%3A%2F%2F1347375179-files.gitbook.io%2F%7E%2Ffiles%2Fv0%2Fb%2Fgitbook-legacy-files%2Fo%2Fassets%252F-MKZSsJBtSP9L4sqIe_q%252F-MPEfeztlpcHzJaMeRin%252F-MPEkjT1ogHMCQ-JC_RH%252FPAckage.png%3Falt%3Dmedia%26token%3D6423078e-378c-44b2-9eb0-efdc1f34a325&#x26;width=768&#x26;dpr=4&#x26;quality=100&#x26;sign=894e1d43&#x26;sv=1" alt=""><figcaption></figcaption></figure>

### Setting up a new package

Clicking on Tools / Packages / Create packages opens up the context menu window. The first tab contains general information about the package.

<figure><img src="https://docs.agenatrader.com/~gitbook/image?url=https%3A%2F%2F2805764894-files.gitbook.io%2F%7E%2Ffiles%2Fv0%2Fb%2Fgitbook-legacy-files%2Fo%2Fassets%252F-MKZSsJBtSP9L4sqIe_q%252F-MQuyUOvSDf10S_TO9Zp%252F-MQw26r56EIcKWi-nOaN%252FCreatePackage.png%3Falt%3Dmedia%26token%3D84db17ff-b626-42df-98e2-ff547ccb7b02&#x26;width=768&#x26;dpr=4&#x26;quality=100&#x26;sign=972a4e2e&#x26;sv=1" alt=""><figcaption></figcaption></figure>

Name of the package Version number can be assigned by the user and must conform to a predetermined format e.g. 1.0.0.0 Update URL if the user plans further updates for the package Documentation URL if the user provides documentation Support email if the user provides support Description of the package Make license validation available If the checkbox has been activated, the user has the possibility to assign a license key to protect his or her product from piracy.

### Choosing the package content <a href="#choosing-the-package-content" id="choosing-the-package-content"></a>

After the general information of the package has been defined, the content of the package can be selected. With a click in the checkbox next to the element, this element can be added to the package. Indicators, strategies, conditions, self-programmed conditions, alert handlers, entry, stop, and target escorts, workspaces, templates and hot keys are available for selection.

#### Settings from the Global Configuration <a href="#settings-from-the-global-configuration" id="settings-from-the-global-configuration"></a>

The tab TE\_Config.xml contains all the settings of the Global Configuration. These settings can also be made available for other users too.

<figure><img src="https://docs.agenatrader.com/~gitbook/image?url=https%3A%2F%2F2805764894-files.gitbook.io%2F%7E%2Ffiles%2Fv0%2Fb%2Fgitbook-legacy-files%2Fo%2Fassets%252F-MKZSsJBtSP9L4sqIe_q%252F-MQuyUOvSDf10S_TO9Zp%252F-MQw2Ew1Gc3Q-qASBfs2%252FTE_Config.png%3Falt%3Dmedia%26token%3D60420b28-6d08-4d8b-8b32-c52ed68475c8&#x26;width=768&#x26;dpr=4&#x26;quality=100&#x26;sign=42535658&#x26;sv=1" alt=""><figcaption></figcaption></figure>

#### Further export settings <a href="#further-export-settings" id="further-export-settings"></a>

Alongside the contents listed above, there is also the option to add your own instrument data to the package by selecting the checkbox "Export instrument data". The two other checkboxes are for the general AgenaTrader support service. This data is requested to understand a problem the user might have; however, these have no practical function in creating the trader packages themselves.

<br>

<figure><img src="https://docs.agenatrader.com/~gitbook/image?url=https%3A%2F%2F2805764894-files.gitbook.io%2F%7E%2Ffiles%2Fv0%2Fb%2Fgitbook-legacy-files%2Fo%2Fassets%252F-MKZSsJBtSP9L4sqIe_q%252F-MQuyUOvSDf10S_TO9Zp%252F-MQw2JvIeButrnulg7_p%252FCreate.png%3Falt%3Dmedia%26token%3D7616fd8d-d49c-4d82-a629-880cfb0c12ce&#x26;width=768&#x26;dpr=4&#x26;quality=100&#x26;sign=310f4a5b&#x26;sv=1" alt=""><figcaption></figcaption></figure>

## Removing packages

The following steps show how to delete a package:

1. Navigate to **Tools -> Packages -> Imported Packages**
2. Select the package(s) you want to delete
3. Right-click on the selected package(s) and choose **Remove**

This will permanently remove the selected package(s) from AgenaTrader.

<figure><img src="https://docs.agenatrader.com/~gitbook/image?url=https%3A%2F%2F1347375179-files.gitbook.io%2F%7E%2Ffiles%2Fv0%2Fb%2Fgitbook-legacy-files%2Fo%2Fassets%252F-MKZSsJBtSP9L4sqIe_q%252F-MPEfeztlpcHzJaMeRin%252F-MPEkxy2VUPSbB3YBB7t%252FRemove%2520Package.png%3Falt%3Dmedia%26token%3Def81bb08-e5c4-4774-88c1-1325a367e393&#x26;width=768&#x26;dpr=4&#x26;quality=100&#x26;sign=fd40bf6b&#x26;sv=1" alt=""><figcaption></figcaption></figure>

## Updating packages

**How to Update a Package**

1. Navigate to **Tools -> Packages -> Imported Packages**
2. Select the package(s) you want to update
3. Click the **Update-to-date** button

This ensures that your packages are always up to date with the latest versions and configurations.

<figure><img src="https://docs.agenatrader.com/~gitbook/image?url=https%3A%2F%2F1347375179-files.gitbook.io%2F%7E%2Ffiles%2Fv0%2Fb%2Fgitbook-legacy-files%2Fo%2Fassets%252F-MKZSsJBtSP9L4sqIe_q%252F-MPEfeztlpcHzJaMeRin%252F-MPElCNyP38A2dYxUKuE%252F1.png%3Falt%3Dmedia%26token%3D25e078bb-89c1-45d1-9721-29b77c4ea01c&#x26;width=768&#x26;dpr=4&#x26;quality=100&#x26;sign=a9ff31e5&#x26;sv=1" alt=""><figcaption></figcaption></figure>

## License key

In addition to activating the AgenaTrader software, the **License Activation** setup also allows you to activate the license key for packages.

To do this:

1. Select the **package name** to unlock the activation field.
2. Enter the license key.
3. Click the **Activate** button to complete the activation.

<figure><img src="https://docs.agenatrader.com/~gitbook/image?url=https%3A%2F%2F1347375179-files.gitbook.io%2F%7E%2Ffiles%2Fv0%2Fb%2Fgitbook-legacy-files%2Fo%2Fassets%252F-MKZSsJBtSP9L4sqIe_q%252F-MPF2GKRtXhoOgYaA79S%252F-MPF308X3zgFGuz_joEP%252FAktivierung.png%3Falt%3Dmedia%26token%3D276aa2da-ade3-4851-9799-9183b38d327d&#x26;width=768&#x26;dpr=4&#x26;quality=100&#x26;sign=81446715&#x26;sv=1" alt=""><figcaption></figcaption></figure>

## Package demo licence

In order to get a free package demo licence please follow those steps:

* Directly in your AgenaTrader open "Licensing" from the main-toolbar and select "Entering Activation Key"
* In the next window select the preferred package and click on the button "Request Demo"

After that, the package will be imported and installed automatically. The demo key will be enabled for 30 days, you can see the expiration date in column "Expiry".

<figure><img src="https://docs.agenatrader.com/~gitbook/image?url=https%3A%2F%2F2805764894-files.gitbook.io%2F%7E%2Ffiles%2Fv0%2Fb%2Fgitbook-legacy-files%2Fo%2Fassets%252F-MKZSsJBtSP9L4sqIe_q%252F-MQuyUOvSDf10S_TO9Zp%252F-MQw0gJcxdN7kk8I2xkG%252Fpicture997-1.png%3Falt%3Dmedia%26token%3D4f337a06-3880-4de2-9557-075cbeefdab3&#x26;width=768&#x26;dpr=4&#x26;quality=100&#x26;sign=b3cd7b17&#x26;sv=1" alt=""><figcaption></figcaption></figure>


# AddOns (packages) and their content

P**lease note**: If you want to benefit from all functionalities in the packages, we recommend to use AgenaTrader Andromeda. You can basically use the AddOns with lower versions, yet only with *major constraints* (no AT++ Trading, no realtime screening etc.)!

### **Volume** <a href="#volume" id="volume"></a>

Premium indicators:

Volume Trading AddOn is comprised of 12 Indicators and 8 Signals, as well as a fully setup Volume-Workspace.

Included indicators in this AddOn:

**Volume Session Pro**&#x20;

This indicator is equivalent to the well-known VolumeProfile indicator with a display for a specific time span (session).\
You can determine the start time and the length of a session however you wish. ([VIDEO](https://youtu.be/HevkZQnn0yA))

<figure><img src="/files/KrOPw278dvZNUaxFNgW9" alt=""><figcaption></figcaption></figure>

**Volume Area**

Similarly, with this indicator you can also have your own volume profiles displayed.\
Here you can now determine the start and end time completely freely by clicking on your desired position. ([VIDEO](https://youtu.be/Ol8qeQqxS54))

<figure><img src="/files/Qxs9x08KQBb6gV3uR1Sz" alt=""><figcaption></figcaption></figure>

**Klinger Volume Oscillator**

Is a technical indicator to determine long-term trends of the money flow. At the same time,\
The indicator is sensitive enough to also identify short-term fluctuations. ([VIDEO](https://youtu.be/n6DwGBQuJA0))

<figure><img src="/files/Gcm6uGVupUJrysusTeaE" alt=""><figcaption></figcaption></figure>

**Volume Keltner Channels**

Volume that is higher than the highest Keltner channel line can be interpreted as extremely high volume that shows that huge numbers of trades.\
Is a great tool to determine very high or very low volume in comparison to past periods. ([VIDEO](https://youtu.be/9FzsfBgcNEk))

<figure><img src="/files/NG0Lc8kRXj2YzZQrBIvd" alt=""><figcaption></figcaption></figure>

**Volume UDR**

The VolumeUpDownRatio is the relationship between UpVolume and DownVolume, displayed as an oscillator. ([VIDEO](https://youtu.be/p3CnifR1SOQ))

<figure><img src="/files/ONJMFjLA0IxC91x30zzK" alt=""><figcaption></figcaption></figure>

**Volume Tick Speed**

The indicator measures the number of ticks that are traded during a number of seconds defined by the user. ([VIDEO](https://youtu.be/DC4dHuDknYQ))

<figure><img src="/files/ReK8cO5slS6gWOlElnO6" alt=""><figcaption></figcaption></figure>

**Volume Zone Oscillator**

The VolumeZoneOscillator divides the volume activity into UpVolume and DownVolume, similarly to the VolumeUDR. ([VIDEO](https://youtu.be/5-mcjIxsO9w))

<figure><img src="/files/GeJRVnqnke6HEA1frnhL" alt=""><figcaption></figcaption></figure>

**Volume Rise Fall**

The VolumeRiseFall indicator is a normal volume display as volume bars, with, however, a different coloring than normal. ([VIDEO](https://youtu.be/hk_zdIiYVts))

<figure><img src="/files/Fa2PFsInRJnJlliC0qLK" alt=""><figcaption></figcaption></figure>

**Wyckoff Wave**

Adds the volume for each following bar until a price wave is over/finished.\
You can set the sensitivity of the price waves. When the volume of a wave rises to particularly high values, is it very often because a turning point in the chart has been reached. ([VIDEO](https://youtu.be/csWC3eJe0gU))

<figure><img src="/files/zBRTaQLwe191PWla72iz" alt=""><figcaption></figcaption></figure>

**Volume Graph**

This indicator contains a normal volume histogram, but here, the coloring takes place based on price trends. The VolumeGraph determines short- or long-term price trends. ([VIDEO](https://youtu.be/ykz-65qx1U8))

<figure><img src="/files/JIItjE298NDRe1FBU4wX" alt=""><figcaption></figcaption></figure>

**Volume Sentiment Long**

This indicator detects bullish volume activity based on the analysis of the volume of a period, the price span of a bar and the close of the bar (=VolumeSpreadAnalysis). ([VIDEO](https://youtu.be/rAJWwot6OIY))

<figure><img src="/files/5o4uMcWkXFd2ITRIOIRO" alt=""><figcaption></figcaption></figure>

**Volume Sentiment Short**

This indicator is the counterpart to the VolumeSentimentLong and detects bearish volume activity based on the analysis of the volume of a period, the price span of a bar and the close of the bar (=VolumeSpreadAnalysis). ([VIDEO](https://youtu.be/rAJWwot6OIY))

<figure><img src="/files/PDvlKO1Wxg968shHKo7o" alt=""><figcaption></figcaption></figure>

In addition, you get the following predefined signals:&#x20;

* Long No Supply,&#x20;
* Long Stopping Volume,&#x20;
* Long Testbar,&#x20;
* Long TwoBar Reversal,&#x20;
* Short Up-Thrust,&#x20;
* Short Hidden Up-Thrust,&#x20;
* Short No Demand,&#x20;
* Short TwoBar Reversal

Workspace:

* Volume workspace

You can find the complete documentation [**here**](https://agenatrader.com/support-informations/VolumePackageDescriptionEN_Final.pdf).

### **CoT Report AddOn** <a href="#cot-institutional" id="cot-institutional"></a>

The Commitments of Traders Report is a valuable report that is made available by the regulatory authority – the CFTC – once a week. The aim of this report is to bring transparency to the trading activities of all market participants.&#x20;

The COT report is not only interesting for futures trading, but is also ideally suited for swing trades with IndexCFDs, CommodityCFDs and Forex values.&#x20;

Using AgenaTrader in combination with the Commitments of Traders Report AddOn is an extremely efficient way to work with the CFTC data and carry out your analyses.&#x20;

To make trading and working with the COT data as simple and intuitive as possible, the COT software contains a large number of components that make trading easier for you.

### **CoT Standard** <a href="#cot-standard" id="cot-standard"></a>

Premium indicators:

**COT Report Legacy**

The COTReportLegacy directly displays the pure data for you that is read out of the CFTC reports published weekly.  ([VIDEO](https://www.youtube.com/watch?v=5m_ycOdqB5o))

<figure><img src="/files/woeUcsrA9WZnGPpydwKq" alt=""><figcaption></figcaption></figure>

**Open Interest Legacy**

The OpenInterest shows the number of all currently held contracts in an instrument, allowing you to detect the markets with high activity.  ([VIDEO](https://youtu.be/fAzQUij6fdQ))

<figure><img src="/files/h1r4JZmecmwbesRQVCaT" alt=""><figcaption></figcaption></figure>

[**This**](https://agenatrader.com/commitments-of-traders-report-software/) will take you to the CoT landing page; [**this**](https://agenatrader.com/support-informations/COTAddOn-DescriptionEN-Final.pdf) takes you to the description.

**CoT Institutional**

Premium indicators:

**COT Report Disaggregated**

Accesses the detailed Disaggregated reports of the CFTC that have been published since 2009 and can be regarded as a further development of the Legacy reports. ([VIDEO](https://youtu.be/1Mvp4nEW8IE))

<figure><img src="/files/oRxxtz9ZvOiL5g2isAJF" alt=""><figcaption></figcaption></figure>

**Open Interest Disaggregated**

Corresponds to the functionality of the COTOpenInterestLegacy while using the more finely broken down data of the Disaggregated reports. ([VIDEO](https://youtu.be/hnSl_dWSc9A))

<figure><img src="/files/YUUR7YDO1uHv5Mpy6F5g" alt=""><figcaption></figcaption></figure>

**Aggregated Index Position Disaggregated**

Have the Disaggregated COT data displayed for you for up to 4 accumulated markets (SP500, Nasdaq100, Russell200, DowJones30),\
thereby receiving an insight into the entire American stock market. [(VIDEO)](https://www.youtube.com/watch?v=y0ZF-vN0EJU\&list=PLpXCfYw2ra-8qW-napp_sCAOBE5Dd78pJ\&index=7)

<figure><img src="/files/629ttqJOacO3wDSOjNnV" alt=""><figcaption></figcaption></figure>

**Large Trader Activity**

Simulates the behavior of the large traders in the markets for whom no COT data is available, by means of algorithmically calculated outputs.  [(VIDEO)](https://www.youtube.com/watch?v=OW3Dd0Wj1bs\&list=PLpXCfYw2ra-8qW-napp_sCAOBE5Dd78pJ\&index=10)

<figure><img src="/files/MuyYUEoiiITNNTytbj1v" alt=""><figcaption></figcaption></figure>

**Market Value**

Compares the value of a market to the current price of gold or the dollar index, which allows you to determine over- and undervaluation in instruments very well.&#x20;

<figure><img src="/files/auROwwijdKI1fsOFQjBa" alt=""><figcaption></figcaption></figure>

**COT Stock Dummy**

Uses a special algorithm to simulate the behavior of the commercials in stock markets.  [(VIDEO)](https://www.youtube.com/watch?v=Xpj9bCeRc2o\&list=PLpXCfYw2ra-8qW-napp_sCAOBE5Dd78pJ\&index=2)

<figure><img src="/files/0cH5Y047QXq0kz86Cl6C" alt=""><figcaption></figcaption></figure>

**Producer Golden Opportunity**

Buy and sell signals for commodity futures based on the Disaggregated indicators.

<figure><img src="/files/YmqyntECjjiDdnkB1rA4" alt=""><figcaption></figcaption></figure>

**Dealer Take The Chance**

Buy and sell signals for financial futures based on the Disaggregated indicators.

<figure><img src="/files/7CFuAoznul2dl4pIpNeD" alt=""><figcaption></figcaption></figure>

**Commercials in Silent Market**

Screening for markets that the commercials are buying heavily, while the non-commercials and non-reportables are showing no interest in these markets (for buy signals; vice versa for sell signals).

<figure><img src="/files/2JDUVVjDvgTrXp173uPl" alt=""><figcaption></figcaption></figure>

**Commercial Index**

Buy and sell signals based on the CommercialIndex indicator combined with the COTOpenInterestLegacy.

<figure><img src="/files/GpOJZUhmA4VQpp218H7F" alt=""><figcaption></figcaption></figure>

**COT Stock Dummy**

Buy and sell signals generated through the COTStockDummy combined with the COTLargeTraderActivity.

<figure><img src="/files/7p0EmCWeDJFFceZz8ahL" alt=""><figcaption></figcaption></figure>

**COT Workspace**

Contains templates and default settings in order to implement the COT indicators as effectively as possible for your analyses.

<figure><img src="/files/rCYZFGlmdzUFkaiZYkZR" alt=""><figcaption></figcaption></figure>

**Installing the COT package**

Please follow the steps in this [VIDEO](https://youtu.be/G5HIru1rr5k?list=PLLftyBhQjHrUJeims2t8otqApj-KeCGuX)

Conditions:

* ProducerGoldenOpportunityLong
* ProducerGoldenOpportunityShort
* DealerTakeTheChanceLong
* DealerTakeTheChanceShort
* CommercialsBuySilentMarket
* CommercialsSellExcitedMarket
* CommercialIndexLong
* CommercialIndexShort
* COTStockDummyLong
* COTStockDummyShort

Workspace:

* COT workspace

[**This**](https://shop.tradersyard.com/admin.php?dispatch=products.get_file\&file_id=49) will take you to the CoT landing page; [**this**](https://shop.tradersyard.com/var/files/exim/backup/downloads/documentation/EN-COTAddOn_Documentation.pdf) takes you to the description.

### Seasonality AddOn <a href="#cot-standard" id="cot-standard"></a>

Seasonality plays an important and impactful role which influences the markets. Determining market seasonality has never been this easy. AgenaTrader Seasonality AddOn puts a chart’s seasonal tendencies at your fingertips.

Use the Seasonality Institutional AddOn to analyze the seasonal patterns of all asset classes not only on EOD but also on intraday time units, e.g. on 1, 5, 10, 15, etc… minute charts and for each financial instrument that is available in AgenaTrader. In addition with this AddOn your receive:

* Find recurring seasonal trends in the chart, suggesting probable up- or downward movements.
* The SeasonalityPredictor presents the expected seasonal pattern on the price chart creatively.
* Detect over- and underperformers using the InstrumentStrength indicator
* InstrumentDayAnalyzer to determine the best day of a week to trade an instrument
* Hold\<n>Days Indicator to predict the performance range that can be expected

**Seasonal Runs**

Identify seasonal run clusters in the chart, where an upward or downward movement can be expected with high seasonal probability.

<figure><img src="/files/Isqx3OdnNFVJ4YlPYLID" alt=""><figcaption></figcaption></figure>

**Seasonal Predictor**

Innovative display of the predicted seasonal pattern directly in the price chart above the Seasonality Predictor.

<figure><img src="/files/HAbwr2A9E2WXUlFkwF81" alt=""><figcaption></figcaption></figure>

**Hold \<n> Days**

The HoldnDays indicator measures the average performance of a defined holding period based on historical data – a kind of “when is it most worthwhile to hold?” tool.

<figure><img src="/files/opKFPkM6MowR4vNzj5cM" alt=""><figcaption></figcaption></figure>

**Instrument Strength**

Detect over- and underperformers using the InstrumentStrength indicator.

<figure><img src="/files/mzCNxX5qP8rObKJYpnb4" alt=""><figcaption></figcaption></figure>

**Best Trading Day Analyzer**

Instrument-Day Analyzer to determine the best day of a week to trade an instrument.

<figure><img src="/files/xQhAlYfSlQoXePiecIRx" alt=""><figcaption></figcaption></figure>

## The Dow Theory AddOn

Our customers receive the most advanced solution for Dow Theory-oriented trading. The Dow Theory Add-On for AgenaTrader has been further developed and refined for two years. The result, besides improved trend recognition, is an overall solution that can be described as state-of-the-art. With great attention to detail, our Dow Theory Add-On has been successfully improved in order to equip traders with the exact tools they need for trading based on the dow-theory.

With this AddOn, you get:

* Dow Theory trend recognition ([VIDEO](https://www.youtube.com/watch?v=wOOD7BXoARU)) with predefined workspace ([VIDEO](https://www.youtube.com/watch?v=V4zaJzHttOU))
* Automated Trend-Stop ([VIDEO](https://www.youtube.com/watch?v=breJzn49b8s)) and Movement-Stop ([VIDEO](https://www.youtube.com/watch?v=N2wFaVFbeuM))
* Automated Signals ([VIDEO](https://www.youtube.com/watch?v=V4zaJzHttOU)) and Trendfilter ([VIDEO](https://www.youtube.com/watch?v=Du_6-e_x6QA))
* Recognition of inside bars ([VIDEO](https://www.youtube.com/watch?v=PvsKeTETAWs)) and reversal bars ([VIDEO](https://www.youtube.com/watch?v=PvsKeTETAWs))
* Market phase scanner ([VIDEO](https://www.youtube.com/watch?v=dPISKYFo0WI))
* Multi-timeframe boxes ([VIDEO](https://www.youtube.com/watch?v=CypBm9Ifxg0))
* DayLines Advanced Indicator ([VIDEO](https://www.youtube.com/watch?v=qEdBnSDM50k))

### **Dow Theory Standard** <a href="#dow-theory-standard" id="dow-theory-standard"></a>

You can find further information and short videos on the individual indicators on our [**YouTube video channel**](https://www.youtube.com/watch?v=ENMPafFlnxQ\&list=PLpXCfYw2ra-_X2X7GC1FfTWRaPi22NVTl)**.**

Indicators:

**1-2-3 Trend Recognition**

The 1-2-3 trend recognition indicator involves analyzing stock price movements to identify primary, secondary, and minor trends, with a primary trend being the most significant, to make investment decisions. [(VIDEO)](https://youtu.be/RW0HwoNxh00?list=PLpXCfYw2ra-_X2X7GC1FfTWRaPi22NVTl)

<figure><img src="/files/bPikzgCY5MpvxUlGAAOA" alt=""><figcaption></figcaption></figure>

**Indside Bars**

Perfect for Dow Theory movement trading. The inside bar indicator automatically detects the inner and outer bars according to textbook. [(VIDEO)](https://youtu.be/PvsKeTETAWs?list=PLpXCfYw2ra-_X2X7GC1FfTWRaPi22NVTl)

<figure><img src="/files/CEo4Fj2UR4DOZziW74tO" alt=""><figcaption></figcaption></figure>

**Reversal Bars**

Detects the reversal of the markets. The reversal bar indicator recognizes fully automatically the possible reversal of the market according to Dow Theory. [(VIDEO)](https://youtu.be/5kCAF02Bv60?list=PLpXCfYw2ra-_X2X7GC1FfTWRaPi22NVTl)

<figure><img src="/files/EOJvfIrlqcnsjjaBDNhV" alt=""><figcaption></figcaption></figure>

**Market Phase Scanner**

Identifies in which direction the different market phases are moving. [(VIDEO)](https://youtu.be/dPISKYFo0WI?list=PLpXCfYw2ra-_X2X7GC1FfTWRaPi22NVTl)

<figure><img src="/files/Q3y7hi0a5L5upyXwrYfp" alt=""><figcaption></figcaption></figure>

**MTF Boxes**

Demonstrates the position of the priority trend and the behavior of the higher timeframe. [(VIDEO)](https://youtu.be/CypBm9Ifxg0?list=PLpXCfYw2ra-_X2X7GC1FfTWRaPi22NVTl)

<figure><img src="/files/ELNQuBlVjSp4MsKtL0ld" alt=""><figcaption></figcaption></figure>

**DayLines Advanced**

Identifies where the prominent high and low points are located. [(VIDEO)](https://youtu.be/qEdBnSDM50k?list=PLpXCfYw2ra-_X2X7GC1FfTWRaPi22NVTl)

<figure><img src="/files/vWI8aEj6tDHQIcpfDivF" alt=""><figcaption></figcaption></figure>

**MTF Viewing**

Special for AgenaTrader – One window/tab with up to four individually adjustable time frames.\
Track your instruments simultaneously in different time frames. [(VIDEO)](https://youtu.be/3Pwzr4VswIA?list=PLpXCfYw2ra-_X2X7GC1FfTWRaPi22NVTl)

<figure><img src="/files/FbXEdtuwG5TgHNkkZqfJ" alt=""><figcaption></figcaption></figure>

### **Dow Theory Professional** <a href="#dow-theory-professional" id="dow-theory-professional"></a>

All indicators from the Dow Theory Standard AddOn, as well as:

**Workspace**

The 1-2-3 trend recognition indicator involves analyzing stock price movements to identify primary, secondary, and minor trends, with a primary trend being the most significant, to make investment decisions. [(VIDEO)](https://youtu.be/V4zaJzHttOU?list=PLpXCfYw2ra-_X2X7GC1FfTWRaPi22NVTl)

<figure><img src="/files/r8zmJJxgGoPFo0nMWxAZ" alt=""><figcaption></figcaption></figure>

**Trend Stop**

Perfect for Dow Theory movement trading. The inside bar indicator automatically detects the inner and outer bars according to textbook. [(VIDEO)](https://youtu.be/breJzn49b8s?list=PLpXCfYw2ra-_X2X7GC1FfTWRaPi22NVTl)

<figure><img src="/files/pv9rjkdsPSr1vhOYBI3J" alt=""><figcaption></figcaption></figure>

**Movement Stop**

The optimal stop for movement trading – it is dynamic and adapts to the inside bars according to the basic rules. [(VIDEO)](https://youtu.be/N2wFaVFbeuM?list=PLpXCfYw2ra-_X2X7GC1FfTWRaPi22NVTl)

<figure><img src="/files/GB1GKfElmfPuCo3U7YeQ" alt=""><figcaption></figcaption></figure>

**Trends Advanced**

With the advanced trend recognition, you are immediately able to carry out numerous changes.\
Here, amongst other things, the subject of “fuzzy trading” can be adapted to your needs relatively easily. [(VIDEO)](https://youtu.be/xMzKXjbBiyA?list=PLpXCfYw2ra-_X2X7GC1FfTWRaPi22NVTl)

<figure><img src="/files/tMhqiMQbbnMXi1tWpA3W" alt=""><figcaption></figcaption></figure>

**Dynamic Trend filter**

In collaboration with professional Dow Theory traders, we have created a dynamic trend filter that helps to find the right priority trends in order to carry out high-quality trading. [(VIDEO)](https://youtu.be/Du_6-e_x6QA?list=PLpXCfYw2ra-_X2X7GC1FfTWRaPi22NVTl)

<figure><img src="/files/DKZrRytP7Hk4QoXpA2l6" alt=""><figcaption></figcaption></figure>

**Signals**

Identifies where the prominent high and low points are located.&#x20;

<figure><img src="/files/PeVmVwsKaf3eztAMGU6o" alt=""><figcaption></figcaption></figure>

You can find [**more information**](https://www.youtube.com/watch?v=ENMPafFlnxQ\&list=PLpXCfYw2ra-_X2X7GC1FfTWRaPi22NVTl) on our YouTube video channel. On the [**Dow Theory landing page**](https://agenatrader.com/dow-theory-addon/) you will find many other explanations and details of the features as well as the complete documentation.

## Correlation Matrix

With the correlation matrix, you can compare the performance of individual instruments and even entire instrument lists in real-time (!) in any given timeframe. The correlation matrix can be filled with all the instruments you wish; you can even compare instruments from various asset classes with each other. The correlation coefficient is calculated in real-time, and extreme values are automatically highlighted in color.

The module also includes a chart in which the two symbols that you have selected in the matrix or the list are automatically loaded – the main symbol as a normal chart, the second instrument as a “second data series” as a line chart. In addition, the InstrumentCorrelation indicator is displayed, which shows the development of the correlation of these two values to each other over time.

**Correlation Matrix**

The intersection of a row with a column outputs the respective correlation coefficient of the two values to each other.\
The correlation coefficient is 100 if the same symbol is selected in the column and row.

<figure><img src="/files/i9wU2BOI1f2p3ee3xrSB" alt=""><figcaption></figcaption></figure>

**Correlation Indicator**

For the display, the “InstrumentsCorrelation” indicator is used, which is also loaded into the chart to the right of the matrix by default.\
This indicator calculates the historical correlation coefficient for every historical period and depicts it graphically.

<figure><img src="/files/E42qKggfl60gEGxVEuh8" alt=""><figcaption></figcaption></figure>

**Correlation List**

By right-clicking in the matrix or the list, you can call up the correlation-specific display settings.\
You can set the values from which the cells should begin to be colored, and also the colors that should be used for a value of +100 and -100.

<figure><img src="/files/QxpJtiD37hSQmuhO5Qam" alt=""><figcaption></figcaption></figure>

Read more about the [Correlation Matrix.....](https://docs.agenatrader.com/main/main-menu#correlation-matrix)

## Trading Journal Pro

With our Trading Journal PRO,  you receive additional professional features for your trading diary. Obtain new, extremely valuable insights and analyses of your trading with the most sophisticated reports and get statistics about:

* In which instruments do you generate the highest profits?
* On which weekday and at which time of day do you generate the highest wins?
* Profit/loss per day/week/month or trade.
* Graphical preparation of your profit/loss ratio.
* Ranking of your traded strategies with regards to the respective P\&L generated.
* Have your indicators calculated to your equity curve (enables manual equity-curve trading!).
* Use drawing objects to analyze your equity curve.
* Calculation of risk multiples for your trades, plus graphical preparation
* Benchmarking: compare your trading results to an index (SP500, NQ100, DAX30 etc.) – can you beat the market with your trading?
* Scroll through all your past trades in the Trade Collection, add comments and analyze your historical trades

**Trading Overview**

AgenaTrader records each trade and keeps an automated trading journal. This enables you to clearly understand and evaluate trading behavior.

<figure><img src="/files/AaYqbg7K7y5W8rv5gm9f" alt=""><figcaption></figcaption></figure>

**Performance Graph Indicators**

In the new TradingJournal, you can load any indicator to your equity curve, from which you can draw new conclusions, e.g. whether your equity curve is currently below the average or above it.

<figure><img src="/files/1DWwxdKrfRVDfoFt0v0q" alt=""><figcaption></figcaption></figure>

**Performance Graph Drawings**

Just like in a normal chart, you can also use all possible drawing objects in the Performance Graph.

<figure><img src="/files/nmccSREndClkQSQyM44O" alt=""><figcaption></figcaption></figure>

**Trade Collection**

The TradeCollection provides a comprehensive overview of your trades, including automatic screenshots, important trade information, synchronized comments, and self-assigned TotalRatings, facilitating post-trade analysis and learning for traders of all levels.

<figure><img src="/files/0fFCTkaj80R15t1eyUMB" alt=""><figcaption></figcaption></figure>

**Benchmark**

“When using ‘Percent’ display and ‘Use daily chart,’ activate the Benchmark function to compare your performance to global indices with daily percentage changes, accessible by clicking in the chart.”

<figure><img src="/files/6830JKZvSmj6mHlIewaO" alt=""><figcaption></figcaption></figure>

Read more about the [Trading Journal...](https://docs.agenatrader.com/introduction/overview#trading-journal)

## Chart Gallery

Chart galleries offer you complete freedom for charts and chart groups.\
They have the similar functionality as the default chart groups by name, but are without limits on the number and arrangement of charts. There are:

– SingleChart Gallery\
– List Chart Gallery\
– Tab Chart Gallery\
– Multi timeframe SingleChart Gallery

Via chart galleries for instrument lists it is possible, for example, to load all values of the DAX40 or Nasdaq100 simultaneously as charts in any number of time frames.

**Single Chart Gallery**

The Single Chart Gallery allows you to view one symbol numerous time frames.

<figure><img src="/files/G0wR4MLm4DZu5rpNrhNE" alt=""><figcaption></figcaption></figure>

**List Chart Gallery**

The List Chart Gallery allows you create\
a list based chart gallery where you can view multiple symbols in numerous time frames.

<figure><img src="/files/j2p6IO8VTV9e5oR7FLvr" alt=""><figcaption></figcaption></figure>

**Tab Chart Gallery**

With the Tab Chart Gallery you can create a tab based chart gallery where you can view multiple symbols in numerous time periods based on the bottom tabs.

<figure><img src="/files/M9y0OhxxBwZBFkPOPVBA" alt=""><figcaption></figcaption></figure>

**Single Chart Gallery for Instrument Lists**

With a Single Chart Gallery for Instrument Lists you can create a chart gallery to view multiple securities in numerous time periods at a glance.

<figure><img src="/files/Pmu538c7qKYmzwGDQJqa" alt=""><figcaption></figcaption></figure>

Read more about the [Chart Gallery...](https://docs.agenatrader.com/main/chart-area/charting#chart_container__chart_gallery)

## Dynamic Scanner

With the Dynamic Scanner, you no longer need to switch between tabs and check whether each scanner is emitting signals.\
Any signal generated in one of your power scanners will be displayed in it immediately.

This way you become a hunter and gatherer of the best trading opportunities without missing a signal.

Manage all your trade entries from a single tab.

* Automatically display all your signals generated in your workspace
* See new added signals and symbols immediately

This is semi-automatic trading in perfection!

**Display of all signals**

You no longer need to switch between tabs and check whether each scanner is emitting signals.\
The Dynamic Scanner combines all Signals of all Scanners in your Workspace.

<figure><img src="/files/t8RdpWabmerEYPenoPij" alt=""><figcaption></figcaption></figure>

**Marking of new signals**

Intuitive marking of which symbols are newly added to the dynamic signal list by the algorithm.

<figure><img src="/files/R110nX0W5iSWQ13PlLsz" alt=""><figcaption></figcaption></figure>

**Signal Hunter and Collector**

With AT++ you don’t miss any signals anymore, because you always get new signals.\
The tool you use to stick to your trading rules.

<figure><img src="/files/6zSuOoNIXH2QqMWMMCK8" alt=""><figcaption></figcaption></figure>

Read more about the [Dynamic Scanner....](https://docs.agenatrader.com/main/chart-area/charting#dynamic-scanner)

## AgenaTrader Notifier

You no longer need to keep constant eye contact with your trading software! After carrying out all your desired configurations in AgenaTrader, you can simply let the software manage the trade. You receive all updates as well as all important notifications and announcements in real time sent directly to your smartphone.

The AgenaTrader Notifier includes six different tabs:

* Blog
* Notifications
* Signals
* Executions
* Alerts
* Connection Status

This means that in the Notifier, you receive the very latest blog posts, trading signals corresponding to your settings, order/trade executions including the profit/loss generated, alerts, and the current connection status to your broker and data feeds.

The AgenaTrader Notifier is available for iOS / Android devices

**Trading signals**

When the PowerScanner detects one of your signals, it is sent to the AgenaTrader Notifier app

<figure><img src="/files/O5VRXSHLGAETOE0OJ7xl" alt=""><figcaption></figcaption></figure>

**Order executions**

Imagine your order setups in different markets: Entry, stop loss and two targets. Do you always want to wait in front of the computer until they are executed?\
Or receive notifications via the Notifier app, no matter where you are, to track the execution and trading progress.

<figure><img src="/files/RDJDUMC5zFPgFigshXdq" alt=""><figcaption></figcaption></figure>

**Market Alerts**

Receive price, time, and indicator alerts on the AgenaTrader Notifier Mobile APP. Make trading decisions on your smartphone, saving time on routine PC checks.

<figure><img src="/files/Y72WPKdg8oIbhnm3gmxJ" alt=""><figcaption></figcaption></figure>

**Connection status**

Finally, we’ll notify you if the connection to the broker or data feed is lost, ensuring you’re aware of your internet quality and can act promptly if it changes from green to red, eliminating trading setup worries.

<figure><img src="/files/fJbEpWXUnDXQIu2lGmaq" alt=""><figcaption></figcaption></figure>

Read more about the [Notifier....](https://docs.agenatrader.com/tools/preferences#notifier_en)

### **MT ON Live Signal** <a href="#mt-on-live-signal" id="mt-on-live-signal"></a>

ON indicators:

ON123 ONMarketPhases InsideBarsON

ON conditions:

*Screening* ON\_GWL\_Phase ON\_SIG\_Premium ON\_SIG\_Second *Trading* ON\_DeepReversal ON\_Deep ON\_Reversal

ON workspace

Predefined setups for semi-automatic ON trading

[**Here**](https://shop.tradersyard.com/var/files/exim/backup/downloads/documentation/EN-MTOnLiveSignalAddOn-Description.pdf) you will find the complete documentation for the MT ON Live Signal.

[**Here**](https://www.youtube.com/playlist?list=PLLftyBhQjHrUZoSRLnZ3WLYBwtzbxKgaE) you will find the YouTube playlist DE with short videos for the MT ON Live Signal.

For further information and support regarding the MT ON Live Signal AddOn, please contact [**MarktTechnikTrading**](http://markttechniktrading.de/) directly.

### **Location Point** <a href="#location-point" id="location-point"></a>

Location Point ® trading: concealed behind this concept are years of experience with the insight of how markets verifiably behave in a recurrent manner at very obvious markers in the chart. It is a highly efficient trading style with a crystal-clear set of rules that allow very little scope for interpretation, thereby encouraging the trader to stick to this set of rules.

Where many other trading styles fail or leave off, Location Point® trading is just getting started. Just like on a map, you can see where you are located in the market and receive signals right at the point at which markets obviously turn again and again, and the associated replicable stop-target setups

The trading style covers all well-known market phases and delivers very tight reversal entries in:

* Trend-following, fast movements – Red/Green WipeOut
* Correction of fast trends/movements – EightTrain
* Correction of slower trends – TwentyTrain
* More extensive correction of trends – StairWay
* Early signals from breakouts from sideways phases – Trampoline
* CounterTrendReversal signals – Jojo

Premium indicators:

LocationPointFreeRide LocationPointHeatmap

Location Point Basis Conditions:

DoubleBarRetracement SingleBarRetracement TripleBarRetracement

Location Point Signal Conditions:

EightTrain, TwentyTrain Stairway Jojo130 Jojo200 WipeOut

Location Point PAD

Effective display of the Location Point in various timeframes Automated FreeRide checks in various timeframes Recognition and placement of the Location Point targets

Worspace: LocationPoints MarketPreparation EndOfDay CFDs LocationPoints MarketPreparation EndOfDay LocationPoints MarketPreparation Intraday CFDs LocationPoints MarketPreparation Intraday LocationPoints Trading EndOfDay LocationPoints Trading Intraday

Dynamic scanner LocationPoints Trading (End of Day und Intraday) LocationPoints AllSignals (1D-1W-1M / 1H-4H-1D / 5M-15M-1H) LocationPoints TrendSignals (1D-1W-1M / 1H-4H-1D / 5M-15M-1H) LocationPoints ReversalSignals (1D-1W-1M / 1H-4H-1D / 5M-15M-1H) LocationPoints FastMover Signals (1D-1W-1M / 1H-4H-1D / 5M-15M-1H)

Scanner templates:

LocationPoints Trading AllSignals LocationPoints Trading TrendSignals LocationPoints Trading ReversalSignals LocationPoints Trading FastMover Signals

Chart templates incl. ActionBar templates:

LocationPointsMarketPreparation LocationPointsSignalTF LocationPointsTF+1 LocationPointsTF+2

ListChartGroup templates:

LocationPoints Trading (End of Day und Intraday) LocationPoints AllSignals (1D-1W-1M / 1H-4H-1D / 5M-15M-1H) LocationPoints TrendSignals (1D-1W-1M / 1H-4H-1D / 5M-15M-1H) LocationPoints ReversalSignals (1D-1W-1M / 1H-4H-1D / 5M-15M-1H) LocationPoints FastMover Signals (1D-1W-1M / 1H-4H-1D / 5M-15M-1H)

Please find details about Location Point AddOn on page [**here**](https://shop.tradersyard.com/var/files/exim/backup/downloads/documentation/EN-LocationPointPackage_Documentation.pdf)

### **Premium Webinars** <a href="#location-point" id="location-point"></a>

Conditions: *Premium01-DowTheory* CurrentDay Down CurrentDayUp MTFlagLong MTFlagLongBreakOut MTFlagShort MTFlagShortBreakOut *Premium02-Volume* BuyZone SellZone *Premium03-CoT* ProducerNettoLong *Premium04-Darvas* DarvasBreakoutLong DarvasBreakoutShort

Workspaces: Premium01-DowTheory Premium02-Volume Premium03-CoT Premium04-Darvas Premium05-GoldenCross

[Click here](https://agenatrader.com/de/agenaspace-online-trading-strategien/#clip=c8mv69mradk4) to access the Premium Webinars.

Please note: Your Premium package includes exclusively created workspaces that can only be used in conjunction with the corresponding add-on – e.g., the PremiumVolume workspace with the Volume add-on. The Andromeda is the only prerequisite for the Darvas method presented. This means that you need the corresponding package in order to use the respective contents of the WebinarPremium package.


# Internal Packages

## LocationPoint AddOns

## Seasonality AddOns

## COT (Commitments of traders)

#### BRIEF DESCRIPTION OF COT PACKAGE <a href="#brief-description-of-cot-package" id="brief-description-of-cot-package"></a>

**WARNING!** Dear customers, before you start working with the COT workspace and indicators, we ask that you read these instructions thoroughly before modifying any settings.

The COT AddOn is an advanced tool that contains a large number of settings and parameters – incorrect settings made due to “curiosity” may lead to undesired behavior.

**IMPORTANT!** The COT data appears weekly, which is why it makes sense to display the COT data in weekly charts. A monthy chart can provide an additional longterm overview, the daily chart may be used for timing your market-entry in detail. Using smaller timeframes in combination with the COT indikators may not be very useful.

You are free to carry out any and all changes; however, we recommend that you only touch those setting which you are already familiar with. Since large amounts of data have to be downloaded and processed for the COT indicators, you may have to wait for the indicators to be completely loaded. Please allow your AgenaTrader to fully load the indicators before making any further entries in order to maintain the stability of AgenaTrader.

You can find more detailed information about the COT reports on the CFTC’s website under the following links:

\- [About the COT Report](http://www.cftc.gov/MarketReports/CommitmentsofTraders/AbouttheCOTReports/index.htm) - [Release Schedule of the Reports](http://www.cftc.gov/MarketReports/CommitmentsofTraders/ReleaseSchedule/index.htm) - [Explanatory Notes](http://www.cftc.gov/MarketReports/CommitmentsofTraders/ExplanatoryNotes/index.htm) - [Disaggregated Explanatory Notes (Commodities)](http://www.cftc.gov/idc/groups/public/@commitmentsoftraders/documents/file/disaggregatedcotexplanatorynot.pdf) - [Disaggregated Explanatory Notes (Financial)](http://www.cftc.gov/idc/groups/public/@commitmentsoftraders/documents/file/tfmexplanatorynotes.pdf)

#### INSTRUCTIONS FOR PACKAGE INSTALLATION <a href="#instructions-for-package-installation" id="instructions-for-package-installation"></a>

1. After the purchase, you receive the necessary .atpack file and a download link sent to you by email
   * The COTPackageInstitutional.atpack: this file is the actual package including all components contained within. **ATTENTION!** If you are using InternetExplorer or MicrosoftEdge, the browserautomatically converts the atpack file to a .zip-file. After the download you therefore have to rename the COTPackageInstitutional..zip to COTPackageInstitutional.atpack!
2. Save the .atpack file on your hard disk.
3. You now need to enter our license for the package in AgenaTrader. For this, click on the symbol with the question mark, select About **->** Entering Activation Key, navigate to “COTPackageInstitutional” and enter your activation key that you have received by email. Click on “Activate”. Once you receive the notice that your license has been successfully activated, close this window.
4. Now open Tools **->** Packages **->** Import Package, read the following backup information and if you have already carried out a backup, click on OK. In the next window, navigate to the storage location of the COTPackageInstitutional.atpack file, click on it and select “Open”. Confirm the Agena restart request with OK so that your AgenaTrader can be restarted.
5. After the restart, the first step is to establish a connection to your futures data feed. To be able to use the COT package, it is necessary that you have a futures data feed.
6. As soon as you have established a connection to your futures data feed, select Main **->** Workspace **->** Commitment Of Traders Institutional to load the COT workspace. As soon as all charts are completely loaded, the COTPackageInstitutional is fully ready to go.

#### CONTENT COMMITMENTS OF TRADERS (COT) - ADDON <a href="#content-commitments-of-traders-cot-addon" id="content-commitments-of-traders-cot-addon"></a>

The Commitments of Traders Report is a valuable report that is made available by the regulatory authority – the CFTC – once a week. The aim of this report is to bring transparency to the trading activities of all market participants.

In this context, there are two types of report: the abridged form, which has been made available to the traders since 1986 (=Legacy-reports), as well as the detailed version, which has been published since 2009 (=Disaggregated-reports). Both reports can be displayed in AgenaTrader and used for semi-automated trading as well as for analyzing and realtime-scanning the markets. The COT report is not only interesting for futures trading, but is also ideally suited for swing-trading with IndexCFDs, CommodityCFDs and Forex

Using AgenaTrader in combination with the new COT AddOn is an extremely efficient way to work with the CFTC data and carry out your analyses. To make trading and analyses using the COT data as simple and intuitive as possible, the COT AddOn contains the following components:

1. Predefined **workspace** for effective application of the COT indicators
2. **COT Legacy indicators:**
   * COTReportLegacy
   * COTOpenInterestLegacy
   * COTAggregatedIndexPositionLegacy
   * COTCommercialIndex
3. **COT Disaggregated indicators:**
   * COTReportDisaggregated
   * COTOpenInterestDisaggregated
   * COTAggregatedIndexPositionDisaggregated
4. **Additional COT indicators:**
   * COTStockDummy
   * COTLargeTraderActivity
   * MarketValue
5. **COT Legacy conditons:**
   * CommercialsBuySilentMarket / CommercialsSellExcitedMarket
   * CommercialIndexLong / CommercialIndexShort
6. **COT Disaggregated conditions:**
   * ProducerGoldenOpportunityLong / ProducerGoldenOpportunityShort
   * DealerTakeTheChanceLong / DealerTakeTheChanceShort
7. **Additional conditions:**
   * COTStockDummyLong / COTStockDummyShort
   * UnderValuedMarket / OverValuedMarket
8. Predefined **trade-setups** for the COT conditions

#### 1.1.1. THE COT REPORT ESCORT <a href="#id-1.1.1.-the-cot-report-escort" id="id-1.1.1.-the-cot-report-escort"></a>

The COTReportEscort forms the connecting link between the COT data from the CFTC and your charts. Using this tool, you can carry out assignments for which COT data should be displayed on which chart/instrument.

You can reach the COTReportEscort via Tools->Services->COTReportEscort.

<figure><img src="https://docs.agenatrader.com/~gitbook/image?url=https%3A%2F%2F2805764894-files.gitbook.io%2F%7E%2Ffiles%2Fv0%2Fb%2Fgitbook-legacy-files%2Fo%2Fassets%252F-MKZSsJBtSP9L4sqIe_q%252F-MQwKyoESNkVEnIFsYU2%252F-MQwMDwF0EGr7bIg0XEc%252FCOTReportEscort.png%3Falt%3Dmedia%26token%3D16cba1f1-677d-47d3-8cc2-bb662e6d1aa0&#x26;width=768&#x26;dpr=4&#x26;quality=100&#x26;sign=b3127499&#x26;sv=1" alt=""><figcaption></figcaption></figure>

When you open the COTReportEscort, you will find all available COT data listed on the left side. If you now select one of the entries, the assigned instruments will appear in the right-hand window.

In the example below, I would like to have the COT data for the “British pound sterling” future of the CME displayed in the 6B, M6B and GBPUSD charts. To do so, I select the entry British Pound Sterling in the column on the left. In the right-hand column, I now enter the exact symbol name under Symbol, so first “6B”, and then I click “Enter”. If AgenaTrader recognizes the symbol, the correct entry for this instrument should now appear under “Name”. I carry out exactly the same procedure for GBPUSD and the M6B.

<figure><img src="https://docs.agenatrader.com/~gitbook/image?url=https%3A%2F%2F2805764894-files.gitbook.io%2F%7E%2Ffiles%2Fv0%2Fb%2Fgitbook-legacy-files%2Fo%2Fassets%252F-MKZSsJBtSP9L4sqIe_q%252F-MQwKyoESNkVEnIFsYU2%252F-MQwMJTyU1TxUfV2dbpQ%252FCOTEscort.png%3Falt%3Dmedia%26token%3Deb266b3b-f6d6-4f9c-be9b-d6f15d0bce1d&#x26;width=768&#x26;dpr=4&#x26;quality=100&#x26;sign=fbefaea8&#x26;sv=1" alt=""><figcaption></figcaption></figure>

With this, the COT mapping for the British pound is fully executed; I confirm with “Apply” and then click “OK” to close the COTReportEscort. When you now open a chart from 6B, M6B or GBPUSD and load a COT indicator, the COT data for the British pound will be read in and displayed after a brief processing time. With the COTReportEscort, you have complete flexibility when it comes to assigning the COT data. You can map the COT data for the corresponding Forex pairs; you can also assign the COT data to CFD values.

#### 1.1.2. THE COT WORKSPACE <a href="#id-1.1.2.-the-cot-workspace" id="id-1.1.2.-the-cot-workspace"></a>

<figure><img src="https://docs.agenatrader.com/~gitbook/image?url=https%3A%2F%2F2805764894-files.gitbook.io%2F%7E%2Ffiles%2Fv0%2Fb%2Fgitbook-legacy-files%2Fo%2Fassets%252F-MKZSsJBtSP9L4sqIe_q%252F-MQwKyoESNkVEnIFsYU2%252F-MQwMTqICGB28Bp3HHg3%252FCOT%2520workspace.png%3Falt%3Dmedia%26token%3Df15eb1ac-68f1-424e-942b-590a2f6f5801&#x26;width=768&#x26;dpr=4&#x26;quality=100&#x26;sign=747f06f&#x26;sv=1" alt=""><figcaption></figcaption></figure>

*Figure 1 - the COT workspace*

The following content is predefined in the COT workspace:

2.1 **Instrument lists** DAX30 & NASDAQ100 including indicators of interest for the stocks. You can pull up these preset indicators to carry out analyses for all asset classes and markets.

The following components are available in the COTStocks-template:

* Weekly chart (main chart):
  * COTStockDummy (yellow)
  * LargeTraderActivity (green)
  * Conditions COTStockDummyLong (StoDL) & COTStockDummyLong (StoDS) are activated in the chart and are displayed with yellow (Long) and blue (Short) arrows.
* Actionbar of the weekly chart
  * EntryEscort „COTSwingWeekly“ Buy/Sell
  * EntryEscort „COTSwingDaily“ Buy/Sell
  * StoDu = COTStockDummy
  * LaTra = LargeTraderActivity
  * MaVal = MarketValue (Gold)
  * StoDL = COTStockDummyLong
  * StoDS = COTStockDummyLong
  * Trenline green
  * Trendline red
  * Rectangle green
  * Rectangle red
* Daily chart (upper right chart)
  * MarketValue
* Monthly chart (lower right chart)

2.2 **Instrument list** with the most important financial futures: 2.2.1 **“FinancialsLegacy”** including presets for the COT Legacy indicators.

The following components are available in the COTFinancialsLegacy-template:

* Weekly chart (main chart)
  * COTReportLegacy (absolute values, display: net-positions of the Commercials **green**, NonCommercials **cyan**, NonReportables **red**)
  * COTReportLegacy (absolute values, display of the long-positions **cyan** & short-positions **dark blue** of the Commercials
  * COTOpenInterestLegacy (stochastic values, display: total OpenInterest, StochasticPeriod=26)
* Actionbar of the weekly chart
  * EntryEscort „COTSwingWeekly“ Buy/Sell
  * EntryEscort „COTSwingDaily“ Buy/Sell
  * Report = COTReportLegacy
  * OiLeg = OpenInterestLegacy
  * CoInd = CommercialIndex
  * MaVal = MarketValue (DollarIndex)
  * AgLeg = COTAggregatedIndexPositionLegacy
  * CBSM = CommercialsBuySilentMarket
  * CSEM = CommercialsSellExitedMarket
  * CIL = CommercialIndexLong
  * CIS = CommercialIndexShort
  * Trenline green
  * Trendline red
  * Rectangle green
  * Rectangle red
* Daily chart (upper right chart)
  * MarketValue (DollarIndex)
* Monthly chart (lower right chart)
  * COTAggregatedIndexPositionLegacy (Display of the Commercial netpositions in the DowJones, Nasdaq, Russell2000 und SP500)

2.2.2 **“FinancialsDisaggregated”** including presets for the COTDisaggregated indicators

The following components are available in the COTFinancialsDisaggregated-template:

* Weekly chart (main chart)
  * COTReportDisaggregated (absolute values, display: net-positions of the Dealer **green**, LeveragedFunds **cyan**, NonReportables **yellow**, Others **grey**, AssetManager **red**)
  * COTReportDisaggregated (absolute values, display: long-positions **light green** & Short-Positionen **dark green** of the Dealer
  * COTOpenInterestLegacy (stochastic values, display: total OpenInterest, StochasticPeriod=26)
  * Conditions DealerTakeTheChanceLong (DTCL) & DealerTakeTheChanceShort (DTCS) are activated in the chart and are displayed with green (long) and red (short) arrows.
* Actionbar of the weekly chart
  * EntryEscort „COTSwingWeekly“ Buy/Sell
  * EntryEscort „COTSwingDaily“ Buy/Sell
  * Report = COTReportDisaggregated
  * OiDis = OpenInterestDisaggregated
  * AgDis = COTAggregatedIndexPositionDisaggregated
  * MaVal = MarketValue (Gold)
  * DTCL = DealerTakeTheChanceLong
  * DTCS = DealerTakeTheChanceShort
  * Trenline green
  * Trendline red
  * Rectangle green
  * Rectangle red
* Daily chart (upper right chart)
  * MarketValue (Gold)
* Monthly chart (lower right chart)
  * COTAggregatedIndexPositionLegacy (display:Commercial net-positionsin the DowJones, Nasdaq, Russell2000 und SP500)

2.3 **Instrumenten liste** list with the most important commodity futures: 2.3.1 **“CommodityLegacy”** including presets for the COT Legacy indicators.

* The COTCommoditiesLegacy-template contains the same components as theCOTFinancialLegacy-template, see point 1.3.1).
* The only difference is that the MarketValue is set to: „CompareTo=Gold“

2.3.2 **“CommodityDisaggregated”** including presets for the COTDisaggregated indicators.

* The COTCommoditiesDisaggregated-template contains the same components as the COTFinancialDisaggregated-template, see point 1.3.2).
* The only difference is that the MarketValue is set to: „CompareTo=Gold“ Furthermore instead of the conditions „DTCL & „DTCS“ the conditions „ProducerGoldenOpportunityLong“ (PGOL) & „ProducerGoldenOpportunityShort“ (PGOS) are activated in the chart and available in the actionbar.

2.4 **TabChartgruppen** for keeping an **overview of the market**: 2.4.1 **MarketOverviewIndices**

* In this section the most important indices are displayed in the 1-minute timeframe as a mountain-chart. With the small “+” button you can add the instruments you want to have in this list. With those charts you will always keep informed about the latest market moves of the major markets.

2.4.2 **MarketOverviewCommodities**

* In this section the most important commodities are displayed in the 1-minute timeframe as a line-chart. With the small “+” button you can add the instruments you want to have in this list. With those charts you will always keep informed about the latest market moves of the major markets.

2.5 **Scanner-Templates** with useful info for each asset class

* Following templates are available: COTStocks, COTCurrencies, COT Legacy, COTFinancialsDisaggregated, COTCommoditiesDisaggregated

#### 1.1.3. COT LEGACY INDICATORS <a href="#id-1.1.3.-cot-legacy-indicators" id="id-1.1.3.-cot-legacy-indicators"></a>

3.1 **COTReportLegacy** (ReportL)

This indicator is the core element of the COT analysis, with which one can directly display the pure data that the indicator reads from the reports published weekly by the CFTC ([www.cftc.gov/CommitmentsofTraders](http://www.cftc.gov/MarketReports/CommitmentsofTraders/index.htm)). The published reports can be viewed by every market participant. The legacy data is published in the so called short reports you can find on the CFTC-website. The following parameters are available in the COTReportLegacy:

* **Comparative Period**: with this setting, you can enter a comparative period with which the stochastic display is calculated (=StochasticPeriod). The system only triggers this parameter when “IndexType = Stochastic” is set.
* **CotType**: under **All/Other/Old**, select which contracts should be used for the display; more details are available [HERE](http://www.cftc.gov/MarketReports/CommitmentsofTraders/ExplanatoryNotes/index.htm).
* **IndexType**: choose between **Absolute/Stochastic** as to how the values should be outputted.
  * Absolute = the values are outputted in whole numbers, just as they are read out from the reports.
  * Stochastic = the values are outputted and calculated as an oscillator with values between 0-100. With the ComparativePeriod, you can set with which period the Stochastic should be calculated.
* **ReportType**: under this parameter, you select whether the data from the reports should be read out only for futures, or for futures + options.
* **ReturnType**:
  * Net: outputs the net position (=LongContracts – ShortContracts) of the selected market participants
  * Long/Short: outputs the long i.e. short contracts of the selected market participants
  * OI: outputs the total OpenInterest of this instrument; for a more precise and advanced display of the OpenInterest, please use the indicator OpenInterestLegacy
* **ShowCommercials**: select **True** if you would like to have the data for the Commercials displayed. For detailed information on the definition of which market participants are classified as Commercials, please have a look [HERE](http://www.cftc.gov/MarketReports/CommitmentsofTraders/ExplanatoryNotes/index.htm).
* **ShowNonCommercials**: select **True** if you would like to have the data for the NonCommercials displayed. For detailed information on the definition of which market participants are classified as NonCommercials please have a look at the link provided above.
* **ShowNonReportables**: select **True** if you would like to have the data for the NonReportables displayed. For detailed information on the definition of which market participants are classified as NonCommercials please have a look at the link provided above.

![](https://docs.agenatrader.com/~gitbook/image?url=https%3A%2F%2F2805764894-files.gitbook.io%2F%7E%2Ffiles%2Fv0%2Fb%2Fgitbook-legacy-files%2Fo%2Fassets%252F-MKZSsJBtSP9L4sqIe_q%252F-MQwKyoESNkVEnIFsYU2%252F-MQwMgQwnsVGmyrrkUOD%252FCOTReportLegacy%252C%2520IndexType%253DAbsolute%252C%2520ReturnType%253DNet.png%3Falt%3Dmedia%26token%3D693f5330-0c5b-4f42-a780-c87cf41121e4\&width=768\&dpr=4\&quality=100\&sign=100732c3\&sv=1)

*Figure 2 - COTReportLegacy, IndexType=Absolute, ReturnType=Net*

![](https://docs.agenatrader.com/~gitbook/image?url=https%3A%2F%2F2805764894-files.gitbook.io%2F%7E%2Ffiles%2Fv0%2Fb%2Fgitbook-legacy-files%2Fo%2Fassets%252F-MKZSsJBtSP9L4sqIe_q%252F-MQwKyoESNkVEnIFsYU2%252F-MQwMkH9pk28NvliFM6r%252FCOTReportLegacy%252C%2520IndexType%253DStochastic%252C%2520ReturnType%253DLong.png%3Falt%3Dmedia%26token%3D650d5ebb-0b4d-49ff-8aa4-e03bcf862a90\&width=768\&dpr=4\&quality=100\&sign=68f0d62\&sv=1)

*Figure 3 – COTReportLegacy, IndexType=Stochastic, ReturnType=Long*

3.1.2 **How does one read COT Legacy data?**

* **The commercials**:

The commercials are regarded as the largest (most financially sound) and most informed group of market participants; first and foremost, this means large companies. Among the market participants that are viewed as commercials, in turn, there are 2 groups: **i.** The producers: these are the market participants that produce a commodity themselves. **ii.** The processors: this designates the market participants that commercially process a commodity. These two groups have different reasons as to why they take up positions on the financial markets.

To better illustrate this, we will take the gold future as an example; here the producers are gold mine owners, and the processers may be jewelry retailers, for example. We will now assume that the price for a standard gold future contract currently lies at 1,000 USD. Within the next month, the price of the gold contract rises to 1,200 USD. Which position do the commercials assume – and why? Let us first take a look at the producers. The producers themselves possess the commodity that serves as an underlying for the future. The gold mine owner therefore has gold in his possession that he would like to sell; manufacturing costs. By means of the futures market, via the sale of gold contracts, the gold mine owner can secure a price at which he can sell his gold.

The producer sells a gold contract not to speculate on falling prices, but instead in order to secure the price at which he can sell his commodity!

In this concrete example, therefore, the gold price rises by 200 USD; the gold mine owner will sell an increased number of gold contracts, which means that when prices are rising he places himself on the short side. The more the price rises, the more short contracts a producer will take up, since this means that ever better deals will vcome about for the producer.

The producers tend to primarily hold short positions in futures. The procedure taken by the processors is different. When the gold price rises, for the processing jeweler this means that he must buy his required gold at an ever more expensive price. This is why in times of rising commodity prices, processors have only a very low activity level in the futures markets. Now if, for example, the price of the gold future sinks back down to 1,000 USD, then the processors will become active. In order to ensure this now lower gold price for themselves, the processors buy gold contracts; in turn, when the markets are falling, the producers will take almost no action on the financial market. The processors buy gold contracts to secure a current low price of the underlying for themselves; speculative arguments play no role for processors. The processors hold, above all, long positions in futures.

You can see, therefore, that the commercials do not enter into any speculative positions, but instead use the financial markets principally for securing their transactions – i.e. for hedging.

**PRINCIPLE** **When the prices fall, the commercials (processors) buy; when the prices rise, the commercials (producers) sell.**

* **The non-commercials:**

In order to be counted as part of the group of non-commercials, a certain number of contracts must be held, e.g. 250 contracts for ZC (corn); as soon as one holds more than this number of contracts, one is included in this group of market participants. The non-commercials, therefore, are those market participants who are not producers or processors, but who trade with very large amounts of money on the futures market. Included among the non-commercials, above all, are hedge funds, financial institutes such as pension funds and investment banks.

In order to invest such large sums of money in the financial markets, only trading in the trend direction is suitable, which is why the non-commercials are deemed trend followers. The non-commercials tend to be more strongly invested long in futures. This means that the non-commercials buy when the prices are rising and sell when they are falling. The further a trend goes, the larger the positions that the noncommercials accumulate in the trend direction become.

**PRINCIPLE** **The non-commercials are trend followers; the longer a trend runs, the larger the noncommercials’ positions in the trend direction become.**

* **The non-reportables:**

The non-reportables include all traders who are not part of the commercials or noncommercials, meaning especially rivate market participants i.e. smaller funds that lie below the contract limit of the non-commercials.

A statement on the behavior of the non-reportables is as good as impossible, since in this group, a huge variety of traders are going about their business. Trend traders as well as counter-cyclical investors and traders with 1 contract are considered nonreportables just as much as traders with 150 contracts. A global statement about the trading direction of the non-reportables is therefore not possible.

When you analyze the non-reportables, you pay particular attention to extreme values, i.e. long or short positions to an extent that has not been seen for a long time. From these extreme positions, you can conclude that there is an unusual situation present in the market and you can carry out analyses of the other market participants. What can be observed with the non-reportables is that non-reportables often place emotional trades. When a market collapses, the non-reportables sell heavily, which can be considered a panic sell; the same goes for extremely overheated markets, in which the small investors continue to heavily buy.

**PRINCIPLE** **Analyze the market positioning of the non-reportables with a certain amount of skepticism!**

3.2 **COTOpenInterestLegacy** (OiLeg)

The open interest specifies the number of all currently held contracts; a high open interest, therefore, indicates that the market participants have great interest in this value; vice versa, low open interest shows that a value has only few held contracts and therefore little activity from the market participants. There are two options for calculating the OpenInterest:

* Commercial**Long** + NonCommercial**Long** + NonCommercial**Spread** + NonReportable**Long** = OpenInterest
* Commercial**Short** + NonCommercial**Short** + NonCommercial**Spread** + NonReportable**Short** = OpenInterest

Since for every long contract, there is also a market participant on the short side, both calculation methods yield exactly the same value. *Additional info: with the CFTC, the open interest is not calculated; the CFTC can simply see the open interest by counting all contracts that are open in the market. With known open interest, the NonReportable positions are then calculated, since the following equation must be valid: TotalReportable + NonReportable = OpenInterest. TotalReportable and OpenInterest are known, allowing the NonReportables to be calculated.*

The following parameters are available for the OpenInterestLegacy:

* **CotType**: see 2.1) COTReportLegacy - CotType
* **ReportType**: see 2.1) COTReportLegacy – ReportType
* **StochasticPeriod**: see 2.1) COTReportLegacy – ComparativePeriod
* **IsNative**: outputs the OpenInterest as an absolute number, just as it is read out from the CFTC reports
* **IsStochastic**: the OpenInterest is outputted and calculated as an oscillator with values between 0-100. With the StochasticPeriod, you can set with which period the Stochastic should be calculated.
* **IsCommercialLong/IsCommercialShort**: select **True** if you would like to have the data for the NonCommercials displayed. The outputted values are percentages; if, for example, you set IsCommercialLong=True, the percentage of long positions of the Commercials that make up the total OpenInterest is outputted. A value of 0.5, for example, means that the OpenInterest consists of 50% long positions of the Commercials, which can be considered a very large long position of the Commercials.
* **IsNonCommercialLong/IsNonCommercialShort**: if you select **True**, the percentage of NonCommercial long positions i.e. NonCommercial short positions that make up the total OpenInterest is outputted.
* **IsNonReportableLong/IsNonReportableShort**: if you select **True**, the percentage of NonReportable long positions i.e. NonReportable short positions that make up the total OpenInterest it outputted.
* **IsTotalReportableLong/IsTotalReportableShort**: if you select **True**, the percentage of TotalReportable long positions i.e. TotalReportable short positions that make up the total OpenInterest is outputted. (TotalReportable = Commercials+NonCommercials).

![](https://docs.agenatrader.com/~gitbook/image?url=https%3A%2F%2F2805764894-files.gitbook.io%2F%7E%2Ffiles%2Fv0%2Fb%2Fgitbook-legacy-files%2Fo%2Fassets%252F-MKZSsJBtSP9L4sqIe_q%252F-MQwKyoESNkVEnIFsYU2%252F-MQwMqcTgh66g-hg3NJh%252FCOTOpenInterestLegacy%252C%2520above%2520Show%253DIsNative%252C%2520below%2520Show%253DIsStochastic%2520figure%25204.png%3Falt%3Dmedia%26token%3Ddef84300-5cdc-49d1-94b2-1dc61edbd8fe\&width=768\&dpr=4\&quality=100\&sign=7aca503f\&sv=1)

*Figure 4 - COTOpenInterestLegacy, above: Show=IsNative, below: Show=IsStochastic*

![](https://docs.agenatrader.com/~gitbook/image?url=https%3A%2F%2F2805764894-files.gitbook.io%2F%7E%2Ffiles%2Fv0%2Fb%2Fgitbook-legacy-files%2Fo%2Fassets%252F-MKZSsJBtSP9L4sqIe_q%252F-MQwKyoESNkVEnIFsYU2%252F-MQwMvuTm5jwAd0W8cy0%252FCOTOpenInterestLegacy%252C%2520above%2520IsCommerc...g%253DTrue%252C%2520IsNonReportableShort%253DTrue..png%3Falt%3Dmedia%26token%3D9c1056ee-8c28-407b-9a96-df8030bda522\&width=768\&dpr=4\&quality=100\&sign=70baaa5b\&sv=1)

*Figure 5 – COTOpenInterestLegacy, above: IsCommercialLong=True, IsNonCommercialLong=True, IsNonReportableShort=True.*

*below: IsCommercialShort=True, IsNonCommercialShort=True, IsNonReportableShort=True*

3.3 **COTAggregatedIndexPositionLegacy** (AgLeg)

This is a unique indicator with which you can get an overview of the entire American stock market. The indicator works in a very similar way to the normal COTReportLegacy, with the difference that the data is not outputted for a single market, but instead for up to 4 accumulated markets. Available to choose from are the 4 most important American indices, which have a strong influence on global trading every day: DowJones, SP500, Russell2000 and Nasdaq100. You can interpret the indicator data in exactly the same way as the normal COT data, with the difference that you now get an insight as to how the market participants are behaving **in the ENTIRE American market**. The following parameters are available for the COTAggregatedIndexPositionLegacy:

* Indices:
  * **DowJones**: select **True** if the positions of the DowJones should be added to the overall result.
  * **Nasdaq100**: select **True** if the positions of the Nasdaq100 should be added to the overall result.
  * **Russell2000**: select **True** if the positions of the Russell2000 should be added to the overall result.
  * **SP500**: select **True** if the positions of the SP500 should be added to the overall result.
* Positions:
  * **Commercials**: select **True** if the positions of the Commercials should be displayed.
  * **NonCommercials**: select **True** if the positions of the NonCommercials should be displayed.
  * **NonReportables**: select **True** if the positions of the NonReportables should be displayed.
* ReturnType:
  * **IndexType**: **Absolute/Stochastic** - see 2.1) COTReportLegacy – IndexType.
  * **ShowLongPositions**: **True** shows the long positions of the selected market participants.
  * **ShowNetPositions**: **True** shows the net positions of the selected market participants.
  * **ShowShortPositions**: **True** shows the short positions of the selected market participants.

<figure><img src="https://docs.agenatrader.com/~gitbook/image?url=https%3A%2F%2F2805764894-files.gitbook.io%2F%7E%2Ffiles%2Fv0%2Fb%2Fgitbook-legacy-files%2Fo%2Fassets%252F-MKZSsJBtSP9L4sqIe_q%252F-MQwKyoESNkVEnIFsYU2%252F-MQwN0EQcYv2XpJV7nVp%252FCOTAggregatedIndexPositionLegacy.png%3Falt%3Dmedia%26token%3Dc7131b28-aebd-4b0b-9055-2ccfd67e81f4&#x26;width=768&#x26;dpr=4&#x26;quality=100&#x26;sign=295dcdd2&#x26;sv=1" alt=""><figcaption></figcaption></figure>

*Figure 6 – COTAggregatedIndexPositionLegacy, Positions: Commercials=True, ReturnType: ShowNetPositions=True, IndexType=Absolute.*

3.4 **COTCommercialIndex** (CoInd)

The CommercialIndex is a very telling COT indicator. It puts two of the most important COT-parameters in relation to each other – the net position of the commercials to the open interest. These values are normalized and subsequently outputted. A high value of the CommercialIndex shows strong buying behavior of the commercials, whereas a low value shows strong sell pressure from the commercials. The parameters are similarly structured as with the COTReport.

The following parameters are available for the COTCommercialIndex:

* **CotType**: 2.1) COTReportLegacy - CotType
* **ReportType**: 2.1) COTReportLegacy - ReportType
* **StochasticPeriod**: see 2.1) COTReportLegacy – ComparativePeriod
* **OpenInterestType**: Here you can choose between Native/Stochastic, which determines whether absolute values or the stochastic values of the positions of the commercials should be used for the calculation. The default setting is “Native”; do not change this if you wish to keep the informative value of the indicator.

<figure><img src="https://docs.agenatrader.com/~gitbook/image?url=https%3A%2F%2F2805764894-files.gitbook.io%2F%7E%2Ffiles%2Fv0%2Fb%2Fgitbook-legacy-files%2Fo%2Fassets%252F-MKZSsJBtSP9L4sqIe_q%252F-MQwKyoESNkVEnIFsYU2%252F-MQwN4qML2yNZ7TeTxU4%252FCOTCommercialIndex%252C%2520OpenInterestType.png%3Falt%3Dmedia%26token%3D6ed8ee11-3681-43b4-808a-49f9f7d014af&#x26;width=768&#x26;dpr=4&#x26;quality=100&#x26;sign=35aae0ee&#x26;sv=1" alt=""><figcaption></figcaption></figure>

*Figure 7 – COTCommercialIndex, OpenInterestType=Absolute, StochasticPeriod=26*

#### 1.1.4. COT DISAGGREGATED INDICATORS <a href="#id-1.1.4.-cot-disaggregated-indicators" id="id-1.1.4.-cot-disaggregated-indicators"></a>

4.1 **COTReportDisaggregated** (ReportD)

The COTReportDisaggregated accesses the detailed disaggregated reports of the CFTC, which have been published since 2009 and can be regarded as a further development of the legacy reports. The necessity for improvement has resulted in the drastically changing and constantly developing market environment since the introduction of the COT reports in 1986. The market participants are now divided more subtly and are organized into 5 categories. These 5 categories vary according to whether we are dealing with a commodity future or a financial future.

The commodity futures are divided into the following groups:

* Producer/Merchant/Processor/User
* SwapDealers
* ManagedMoney
* Other Reportables
* Nonreportables
* You can find more information about the classification of the commodities [HERE](http://www.cftc.gov/idc/groups/public/@commitmentsoftraders/documents/file/disaggregatedcotexplanatorynot.pdf)

For the **financial futures**, there are the following groups:

* Dealer/Intermediary
* AssetManager/Institutional
* Leveraged Funds
* Other Reportables
* Nonreportabes
* You can find more information about the classification of the financials [HERE](http://www.cftc.gov/idc/groups/public/@commitmentsoftraders/documents/file/tfmexplanatorynotes.pdf)

The following parameters are available for the COTReportDisaggregated:

* **Categories Commodity/Categories Financial**:
  * Select **True** for the groups that you would like to have displayed in the chart. If you have opened a commodity hart, only settings made under “Categories Commodity” will be taken into account, and vice versa if you have opened a financial chart.
* Database:
  * **CotType**: see 2.1) COTReportLegacy - CotType
  * **IndexType**: see 2.1) COTReportLegacy - IndexType
  * **ReportType**: see 2.1) COTReportLegacy - ReportType
  * **StochasticPeriod**: see 2.1) COTReportLegacy – ComparativePeriod
* Display:
  * **LongPosition**: select **True** to display the long positions of the desired market participants
  * **ShortPosition**: select **True** to display the short positions of the desired market participants
  * **NetPosition**: select **True** to display the net positions of the desired market participants

<figure><img src="https://docs.agenatrader.com/~gitbook/image?url=https%3A%2F%2F2805764894-files.gitbook.io%2F%7E%2Ffiles%2Fv0%2Fb%2Fgitbook-legacy-files%2Fo%2Fassets%252F-MKZSsJBtSP9L4sqIe_q%252F-MQwKyoESNkVEnIFsYU2%252F-MQwNArl0xXgyDClbGFL%252FCOTReportDisaggregated%252C%2520IndexType%253DAbsolute.png%3Falt%3Dmedia%26token%3Df62be98a-3e5a-4af0-bcd5-9078c9760eca&#x26;width=768&#x26;dpr=4&#x26;quality=100&#x26;sign=e1395943&#x26;sv=1" alt=""><figcaption></figcaption></figure>

*Figure 8 – COTReportDisaggregated, IndexType=Absolute*

4.1.2 **How does one read COT disaggregated data?**

* **Commodity futures**:

For the disaggregated data of the commodity futures, the commercials are divided into the group's producers/merchants/processors/users (hereafter simply referred to as producers) and swap dealers; the swap dealers now form their own group of market participants in order to retain a more detailed division of the data.

Regarded as **producers**, therefore, are the market participants who produce, process, or package a commodity and who use the futures markets for hedging their activities with this commodity. Producers tend to sell in rising markets and buy in falling markets. Please see section 2.1.1. for detailed explanations of this.

**Swap dealers** include those market participants who predominantly trade swaps on commodities and who use the futures markets for this as a hedge against the risk of the swap transactions.

**Money managers** are, amongst others, registered asset managers or also unregistered funds. This group of market participants trades on the futures market in order to invest the managed client money in a profitable manner. The money managers can be found as non-commercials in the legacy data. Money managers are mainly trend followers.

**Other reportables** are all those traders who exceed the limit of contracts at which one must report to the CFTC, but who cannot, however, be assigned to any of the above-mentioned groups.

**Non-reportables** have the same interpretation as for the legacy data (see section 2.1.1).

* **Financial futures**:

**Dealer/intermediary**: these are the market participants who sell financial products to customers; this includes banks as well as financial institutes that sell securities, swaps and other derivatives. The dealers/intermediaries should, therefore, be interpreted in a similar manner as the producers in the commodities, since these market participants want to sell a product, and can therefore mainly be found on the short side of the market, since they can thereby hedge their risk and can secure the price at which they can sell a financial product in the future. Generally, the dealers/intermediaries can be analyzed along the same lines as the producers i.e. the commercials.

The following categories represent the buy side of the financial futures, i.e. the market participants who buy from the dealers/intermediaries.

**Asset manager/institutional**: these include institutional investors (pension funds, insurances, portfolio managers of institutional customers). In the legacy data, this group is part of the non-commercials, meaning that we are mainly talking about trend followers.

**Leveraged funds**: similarly to the money managers in the commodity futures, here we are referring to registered asset managers or also unregistered funds. This group of market participants trades on the futures markets in order to invest the managed client money (of non-institutional clients) in a profitable way. The leveraged funds can be found as non-commercials in the legacy data and similarly are mainly trend followers.

**Other reportables** are all those traders who exceed the limit of contracts at which one must report to the CFTC, but who cannot, however, be assigned to any of the above-mentioned groups.

**Non-reportables** have the same interpretation as for the legacy data (see section 2.1.1).

4.2 **COTOpenInterestDisaggregated** (OiDis)

This indicator corresponds to the mode of operation of the COTOpenInterestLegacy, instead using, however, the more finely broken down data of the disaggregated reports. For the functionality and interpretation of the open interest, please read more under 2.2) COTOpenInterestLegacy. The calculation also occurs analogously to the legacy reports, and since for each long contract, there must also be a market participant on the short side, two calculation methods are possible (here for commodity futures):

* Producer**Long** + SwapDealer**Long** + SwapDealer**Spread** + ManagedMoney**Long**+ManagedMoney**Spread** + OtherReportables**Long** + OtherReportables**Spread** + NonReportable**Long** = OpenInterest
* Producer**Short** + SwapDealer**Short** + SwapDealer**Spread** + ManagedMoney**Short** + ManagedMoney**Spread** + OtherReportables**Short** + OtherReportables**Spread** + NonReportable**Short** = OpenInterest

The following parameters are available for the COTOpenInterestDisaggregated:

* **Categories: Commodity**
  * **OpenInterest\_Comm**: (=total OpenInterest for Commodities)
    * **Absolute**: outputs the OpenInterest as an absolute number
    * **Stochastic**: OpenInterest as an oscillator with values between 0-100
    * **None**: no output for the OpenInterest
  * **%ofOIProd Long/Short/Spread**: (=Percent of OpenInterest for Producer Long/Short/Spread – Position) – select **True** if this value should be displayed. This here is the percentage that the positions of the producers have of the overall OpenInterest. A value of 0.5, for example, means that the producers have built up long positions in the size of 50% of the entire OpenInterest.
  * **%ofOISwapDealer Long/Short/Spread**: (=Percent of OpenInterest for SwapDealers Long/Short/Spread – Position) – select **True** if this value should be displayed.
  * **%ofOIManagedMoney Long/Short/Spread**: (=Percent of OpenInterest for ManagedMoney Long/Short/Spread – Position) – select **True** if this value should be displayed.
  * **%ofOIComOther Long/Short/Spread**: (=Percent of OpenInterest for Other Traders in Commodities Long/Short/Spread – Position) – select **True** if this value should be displayed.
  * **%ofOIComNonreportables Long/Short/Spread**: (=Percent of OpenInterest for NonReportables in Commodites Long/Short/Spread – Position) – select **True** if this value should be displayed.
* **Categories: Financial**
  * All parameters work analogously to the settings under “Categories: Commodity”; the only difference lies in the division into various groups of market participants
* **Data base**:
  * **CotType**: see 2.1) COTReportLegacy - CotType
  * **ReportType**: see 2.1) COTReportLegacy - ReportType
  * **StochasticPeriod**: see 2.1) COTReportLegacy – ComparativePeriod

![](https://docs.agenatrader.com/~gitbook/image?url=https%3A%2F%2F2805764894-files.gitbook.io%2F%7E%2Ffiles%2Fv0%2Fb%2Fgitbook-legacy-files%2Fo%2Fassets%252F-MKZSsJBtSP9L4sqIe_q%252F-MQwKyoESNkVEnIFsYU2%252F-MQwNIFJSWwGdlwZoTRu%252FFigure%25209%2520%25E2%2580%2593%2520COTOpenInterestDisaggrega...%252C%2520%2525ofOIDealerIntermediaryLong%253DTrue.png%3Falt%3Dmedia%26token%3Dc4dc3977-e750-4891-ae98-f1e859b70e50\&width=768\&dpr=4\&quality=100\&sign=bdb3113a\&sv=1)

*Figure 9 – COTOpenInterestDisaggregated, %ofOIAssetManagerLong=True, %ofOIDealerIntermediaryLong=True, %ofOIFinNonreportablesLong=True, %ofOIFinOtherLong, %ofOILeveragedFundsLong*

4.3 **COTAggregatedIndexPositionDisaggregated** (AgDis)

This indicator also works in the same way as the COTAggregatedIndexPositionLegacy; for interpretation and more detailed information, please read more under 2.3) COTAggregatedIndexPositionLegacy. The difference here, in turn, consists in the usage of the detailed disaggregated data for calculating the indicator.

For the COTAggregatedIndexPositionDisaggregated, the following parameters are available:

* AddIndices:
  * **DowJones**: select **True** if the positions of the DowJones should be added to the overall result.
  * **Nasdaq100**: select **True** if the positions of the Nasdaq100 should be added to the overall result.
  * **Russell2000**: select **True** if the positions of the Russell2000 should be added to the overall result.
  * **SP500**: select **True** if the positions of the SP500 should be added to the overall result.
* Categories: Financial
  * Here you can only select the categories of the Financials, since this indicator addresses 4 financial markets. However, you can load the indicator in Financials AND Commodities.
  * Select **True** for the categories for which the positions for the selected markets should be added up and displayed.
* Data base:
  * **ReportType**: see 2.1) COTReportLegacy - CotType
* Display:
  * **LongPosition**: select **True** to display the long positions of the desired market participants
  * **ShortPosition**: select **True** to display the short positions of the desired market participants
  * **NetPosition**: select **True** to display the net positions of the desired market participants

![](https://docs.agenatrader.com/~gitbook/image?url=https%3A%2F%2F2805764894-files.gitbook.io%2F%7E%2Ffiles%2Fv0%2Fb%2Fgitbook-legacy-files%2Fo%2Fassets%252F-MKZSsJBtSP9L4sqIe_q%252F-MQwKyoESNkVEnIFsYU2%252F-MQwNPJ-nOUQWsiz_PcV%252FFigure%252010%2520%25E2%2580%2593%2520COTAggregatedIndexPositionDisaggregated.png%3Falt%3Dmedia%26token%3D42df257e-5f58-4e7b-bb84-5a2e6f39b795\&width=768\&dpr=4\&quality=100\&sign=87287f90\&sv=1)

*Figure 10 – COTAggregatedIndexPositionDisaggregated, Display: NetPosition=True*

#### 1.1.5. ADDITIONAL COT INDICATORS <a href="#id-1.1.5.-additional-cot-indicators" id="id-1.1.5.-additional-cot-indicators"></a>

5.1 **COTStockDummy** (StoD)

This indicator attempts to simulate the behavior of the commercials in stock markets using a special algorithm. The values are outputted as Stochastic, meaning that they oscillate between values of 0-100. The interpretation of this indicator is analogous to the interpretation of the commercial data in the standard COT indicators. The output of this indicator should be confirmed with other indicators; you must be aware that we are not talking about real COT data from market participants, but about calculations from the price data. As for the COT data, an analysis in the weekly chart is also recommended for the COTStockDummy.

The following parameters are available for the COTStockDummy:

* ComparativePeriod: input period for the stochastic calculation
* Stochastic: **True** outputs normalized values (values between 0-100)
* Period: this is a period that is necessary for calculating the data. If you do not have detailed information about how this indicator works, please leave this period on the default setting.

5.2 **COTLargeTraderActivity** (LaTra)

The COTLargeTraderActivity indicator, like the COTStockDummy, is based not on real COT data, but instead on algorithmically calculated outputs. This indicator attempts to simulate the behavior of the large traders in markets for which no COT data is available. Here, the interpretation takes place analogously to the analysis of the NonCommercials in the standard COT indicators. As with the COTStockDummy, we point out that other indicators should be consulted, since we are not dealing with real COT data.

The following parameters are available for the COTLargeTraderActivity:

* Period: this is a period that is necessary for calculating the data. If you do not have detailed information about how this indicator works, please leave this period on the default setting.

![](https://docs.agenatrader.com/~gitbook/image?url=https%3A%2F%2F2805764894-files.gitbook.io%2F%7E%2Ffiles%2Fv0%2Fb%2Fgitbook-legacy-files%2Fo%2Fassets%252F-MKZSsJBtSP9L4sqIe_q%252F-MQwKyoESNkVEnIFsYU2%252F-MQwNVpJWJDWLoCpqV-x%252FFigure%252011%2520%25E2%2580%2593%2520above%2520COTStockDummy%2520Period%253D26%2520ComparativePeriod%253D52.png%3Falt%3Dmedia%26token%3Da3208da6-88e4-4317-9e78-dd3e9e3df9a1\&width=768\&dpr=4\&quality=100\&sign=e7e5124\&sv=1)

*Figure 11 – above: COTStockDummy, Period=26, ComparativePeriod=52, Stochastic=True below: COTLargeTraderActivity, Period=8*

5.3 **MarketValue** (MaVal)

This indicator compares the value of a market with the current price of gold or the dollar index. This means that markets are placed in relation to the gold price or the dollar, whereby over- and undervaluation can be determined very well in instruments. A low MarketValue means that a market is cheap relative to gold/dollar index; vice versa, a higher value means that the market is relatively expensive. In general, commodities should be compared to the gold price, and financials to the dollar index. However, depending on the market environment, it may be useful to deviate from this rule.

The following parameters are available for the MarketValue:

* **CompareTo**: select **Gold/Dollar Index** depending on which market the current symbol should be placed in relation to.
* **EMA1**: this is a period that is necessary for calculating the data. If you do not have detailed information about how this indicator works, please leave this period on the default settings. (Default value = 21)
* **EMA2**: this is an EMA period that is necessary for calculating the data. If you do not have detailed information about how this indicator works, please leave this period on the standard settings. (Default value = 3)

It is not yet possible to use the MarketValue indicator in the SignalBuilder, since a multi-instrument indicator cannot be depicted there. Since the MarketValue requires the price data from the current chart and also from gold i.e. the dollar index, this is a multi-instrument indicator, which, as mentioned, currently cannot be represented in the SignalBuilder.

![](https://docs.agenatrader.com/~gitbook/image?url=https%3A%2F%2F2805764894-files.gitbook.io%2F%7E%2Ffiles%2Fv0%2Fb%2Fgitbook-legacy-files%2Fo%2Fassets%252F-MKZSsJBtSP9L4sqIe_q%252F-MQwKyoESNkVEnIFsYU2%252F-MQwNbajUjuZyTxiG1OG%252FFigure%252012%2520%25E2%2580%2593%2520MarketValue%252C%2520CompareTo%253DDollarIndex%252C%2520EMA1%253D21%252C%2520EMA2%253D3.png%3Falt%3Dmedia%26token%3Db8c3446f-1b16-4ace-b2d2-3cb8ef283b73\&width=768\&dpr=4\&quality=100\&sign=f91151bc\&sv=1)

*Figure 12 – MarketValue, CompareTo=DollarIndex, EMA1=21, EMA2=3*

#### 1.1.6. COT LEGACY CONDITIONS <a href="#id-1.1.6.-cot-legacy-conditions" id="id-1.1.6.-cot-legacy-conditions"></a>

6.1 **CommercialBuySilentMarket (CBSM) / CommercialSellExcitedMarket** (CSEM)

This condition scans for long signals according to the highs of the Commercial net positions combined with a simultaneous low of the NonCommercial net positions. In order to refine the results, there must be low OpenInterest of all market participants. This means that it looks for a market that the commercials are buying in great measure, while the non-commercials and non-reportables show no interest in this market.

6.2 **CommercialIndexLong (CIL) / CommercialIndexShort** (CIS)

For this condition, the CommercialIndex and the OpenInterest are used to generate signals. For long signals, there must be an extremely high commercial index, combined with relatively low OpenInterest. The logic behind the signal is the same as for the conditions under 5.1. – we are looking for a market that is currently receiving little attention from the market participants, but is being bought massively by the commercials. The signals partially overlap with the signals from 5.1., but often, however, with the CommercialIndex, these conditions can find signals that would otherwise be overlooked.

#### 1.1.7. COT DISAGGREGATED CONDITIONS <a href="#id-1.1.7.-cot-disaggregated-conditions" id="id-1.1.7.-cot-disaggregated-conditions"></a>

7.1 **ProducerGoldenOpportunityLong** (PGOL) / **ProducerGoldenOpportunityShort** (PGOS)

This condition can **only be used in commodity values**. What is being scanned for here is long signals after an extremely positive net position of the producers; besides that, there must be a positive net position of the swap dealers and a strongly negative net position of the managed money market participants; vice versa for short signals.

7.2 **DealerTakeTheChanceLong** (DTCL) / **DealerTakeTheChanceShort** (DTCS)

This condition can **only be used in financial values**. To create a long signal, there must be a very strong positive net positioning of the dealers. In addition, there should be a strongly negative net positioning of the leveraged funds.

#### 1.1.8. ADDITIONAL CONDITIONS <a href="#id-1.1.8.-additional-conditions" id="id-1.1.8.-additional-conditions"></a>

8.1 **COTStockDummyLong** (StoDL) / **COTStockDummyShort** (StoDS)

In the long condition, higher values of the COTStockDummy in combination with low values of the COTLargeTraderActivity are searched for. Since the StockDummy is a synthetic depiction of the commercials, and the LargeTraderActivity can be largely equated to the non-commercial activity in the futures markets, here, again, we are talking about a very classic COT signal: large buying positions of the commercials and large selling positions of the non-commercials offer a long entry; the opposite is true for a short entry.

8.2 **UnderValuedMarket** / **OverValuedMarket**

Will be activated as soon as the market value indicator can be depicted in the SignalBuilder; for more details see “4.3. MarketValue”.

#### 1.1.9. PREDEFINED SETUPS <a href="#id-1.1.9.-predefined-setups" id="id-1.1.9.-predefined-setups"></a>

9.1 **CotSwingMovement**: (for swing-trades with a very tight trailing-stop) InitialStop: PivotFast HardStop: PivotFast SoftStop: BarByBar Targets: NoTarget

9.2 **CotSwingTrend**: (for swing-trades with a more relaxed trailing-stop) InitialStop: PivotMedium, HardStop: PivotMedium, SoftStop: PivotFast, Targets: NoTarget

## Volume Package

#### BRIEF DESCRIPTION OF VOLUME PACKAGE <a href="#brief-description-of-volume-package" id="brief-description-of-volume-package"></a>

**WARNING!** Dear customers, before you start working with the volume indicators, we request that you study these instructions in detail before you make any potential changes to settings. To be able to use all indicators of the VolumePackage, you need a datafeed which provides tick-data. The speed for tick-data of your datafeed will influence the performance of the VolumePackage-indicators. Your computer should have at least 6GB RAM installed, we recommend 8GB of RAM.

**IMPORTANT!** The volume indicators contain many settings and parameters where incorrect use or settings made out of “curiosity” can lead to undesired behavior. The indicators are designed so that you can carry out all changes in the indicator settings; however, we strongly recommend that you only touch the parameters of which you are aware of the implications. Wishing you much success in trading with the Volume AddOn.

Your AgenaTrader support team

#### INSTRUCTIONS FOR PACKAGE IMPORT <a href="#instructions-for-package-import" id="instructions-for-package-import"></a>

1\. Enter our license for the package in AgenaTrader. For this, click on the symbol with the question mark in the main menu bar, select About  ‘Entering Activation Key’, navigate to “COTPackageInstitutional” and enter your activation key that you have received by email. Click on “Activate”. Once you receive the notice that your license has been successfully activated, close this window. 2. Next select Tools->Packages->Import package. 3. Navigate to the storage location of the .atpack file of the volume package, which you received by email after the purchase. 4. Click on “Open”. 5. Confirm the prompt to restart AgenaTrader. 6. After restarting, select Main->Workspace->VolumePackage in order to switch to the predefined volume workspace.

![](https://docs.agenatrader.com/~gitbook/image?url=https%3A%2F%2F2805764894-files.gitbook.io%2F%7E%2Ffiles%2Fv0%2Fb%2Fgitbook-legacy-files%2Fo%2Fassets%252F-MKZSsJBtSP9L4sqIe_q%252F-MQuyUOvSDf10S_TO9Zp%252F-MQw5Eugk9Jx8-rSPPxr%252F1.png%3Falt%3Dmedia%26token%3D0d292ccc-14ba-414e-b046-db2db0dbe167\&width=768\&dpr=4\&quality=100\&sign=bc59fb9f\&sv=1)

#### 1.1.3. THE WORKSPACE <a href="#id-1.1.3.-the-workspace" id="id-1.1.3.-the-workspace"></a>

In order to be able to work with the volume indicators as effectively as possible, we have set up a volume workspace for you. The workspace is set up in the standard settings for intraday trading in 5 minutes or 15 minutes, but the volume signals can be used in all timeframes. The workspace aims above all to offer you an idea as to how you can configure your work environment with the volume indicators. The templates for the charts/chart groups/scanner are also delivered with the package; you can then load these in all timeframes that you desire.

The workspace contains the following instrument lists: 3.1. DAX30 **15min**, Nasdaq100 **15min**, MajorFutures **15min**

* Trading level: 5 minutes
* Signal level: 15 minutes
* Big picture. 1 hour

3.2. DAX30 **1hour**, Nasdaq100 **1hour**, MajorFutures **1hour**

* Trading level: 15 minutes
* Signal level: 1 hour
* Big picture. 1 day

An action bar containing all volume indicators has been set up so that you can access these with just a click of the mouse. The action bar also contains all eight conditions that come as part ofthe package; by default, these are not activated in the chart in order to protect your PC’s resources. To have a signal displayed, simply click on the desired condition in the action bar. Depending on how wellequipped your PC is, you can also have the conditions loaded in the chart, which would, however, lead to delays and loading times when switching charts or timeframes in less wellequipped PCs. Each ListChartGroup consists of a large main chart (signal level) in which the following indicators/conditions are loaded:

* VolumeSentimentsLong
* VolumeSentimentsShort
* VolumeUpDownRatio (VolumeUDR)
* VolumeKeltnerChannels

The right upper chart in the ListChartGroup contains the trading level; a colume signal occurring in the signal level should be excellently traded in the subordinate trading level. In the trading level, the entry into the market can be sought for and defined using the following loaded indicators:

* **VolumeSessionPro**
* **WyckoffWave**

Before you enter into a trade, you should also check the superior timeframe, which is located in the bottom right of the ListChartGroup. For additional orientation, the VolumeZoneOscillator is loaded here, with which extreme points in the chart are meant to be determined in order to support your analysis and check that the superior timeframe is not generating any countersignals. Each of the charts discussed has the prefabricated action bar loaded; in the signal and trading levels, in addition, there are also the two EntryEscort buttons “B” and “S”, with which you can enter the entire order construct including stop and targets for trading the volume signals with just one click. For this, you need the Andromeda version of AgenaTrader to be able to use the AT++ functions.

The settings of this setup look like this:

* InitialStop: BarByBar (3BarsBack)
* HardStop: BarByBar (2BarsBack)
* SoftStop: BarByBar (1BarBack)
* Target: Pivot2Levels

Here, again, we are talking about a suggestion that is supposed to give you an idea of how you could trade the volume signals. Obviously, you can modify and change this setup entirely according to your preferences.

Each ListChartGroup also includes a list containing an AnalyzerColumn column that screens according to the eight volume conditions. For the 15-minute lists, it screens for signals every 15 minutes; in the 1-hour lists, the AnalyzerColumns are set to 1 hour – this means that you no longer miss a single signal and can hand over all the screening work to AgenaTrader. In the volume column in the list, the currently traded volume is displayed, so that you can keep an eye on the instruments with the highest activity at all times.

The futures list also contains a column with the expiry dates of the futures, in which you can always check whether the correct contract date is set for every contract. Below the ListChartGroup, there are also two TickCharts including the TickSpeed indicator, which shows when the market exhibits particularly high activity, which can point to changes in the prevailing market direction. The left of the two tick charts is loaded with the DowJones30 values; the most important futures have been deposited into the right-hand tick chart – you can switch between these very simply by clicking on the descriptions beneath the chart. With this, you always have an overview of the most important markets. To finish off, the last component is the DepthOfMarket window including the Times\&Sales list, loaded in the very bottom right of the workspace. Here you can enter any symbol, thereby additionally giving you a precise overview of the processes and the volume on the bid & ask side.

#### 1.1.4. DESCRIPTION OF THE INDICATORS <a href="#id-1.1.4.-description-of-the-indicators" id="id-1.1.4.-description-of-the-indicators"></a>

**1.1.4.1. VolumeSessionPro**

This indicator is equivalent to the well-known VolumeProfile indicator with a display for a specific time span (session). You can determine the start time and the length of a session however you wish. For each session, the VolumeProfile is then shown. Use this indicator only in timeframes smaller than 1 day; the smaller the timeframe selected, the more detailed the display of the VolumeProfile. The price at which the most volume was traded in the respective session is shown as a red bar. The price area in which, for example, 70% of the trading activity for the respective session tookplace, is colored light blue. You can determine this percentage yourself as you wish under the parameter “ValueArea”.

Furthermore, you have four different options for displaying the volume information:

**4.1.1. VOC (Volume on close):** Loads the entire volume of a bar at the closing price of this bar – e.g. if a 5-minute bar has a volume of 280 and a range of 1.5 points with a closing price at 1534.25, all 280 volume units are counted at the closing price of 1534.24.

**4.1.2. TPO (Time price opportunity):** This method does not take the actual traded volume into account, but instead counts an individual volume unit for each price in the traded range of the bar – e.g. if a 5-minute bar has its high at 1534 and its low at 1532.5, then one volume unit is counted for each of the following prices: 1532.50, 1532.75, 1533.0, 1533.25, 1533.50, 1533.75, and 1534.

![](https://docs.agenatrader.com/~gitbook/image?url=https%3A%2F%2F2805764894-files.gitbook.io%2F%7E%2Ffiles%2Fv0%2Fb%2Fgitbook-legacy-files%2Fo%2Fassets%252F-MKZSsJBtSP9L4sqIe_q%252F-MQuyUOvSDf10S_TO9Zp%252F-MQw5LjQqsJjZ6RCtLWr%252F2.png%3Falt%3Dmedia%26token%3D041831ba-8fc5-4c31-9f64-684166beb226\&width=768\&dpr=4\&quality=100\&sign=da5ca0d1\&sv=1)

Figure 1-VolumeSessionPro

**4.1.3. VWTPO (Volume weighted time price opportunity):** This version distributes the traded volume of a bar across its price range – e.g. if a 5-minute bar exhibits a volume of 280 with a range of 1.5 points, with its high at 1534 and low at 1532.5, then 40 volume units (=280/7) are added to each of the seven prices in this range: 1532.50, 1532.75, 1533.0, 1533.25, 1533.50, 1533.75, and 1534.

**4.1.4. VTPO (Volume time price opportunity):** Here, the traded volume is added to each price of the range – e.g. if a 5-minute bar has 280 volume units, a range of 1.5 points with a high at 1534 and low at 1532.5, then 280 volume units are added to each of the seven prices of the range:: 1532.50, 1532.75, 1533.0, 1533.25, 1533.50, 1533.75, and 1534.

**1.1.4.2. VolumeArea**

Similarly, with this indicator you can also have your own volume profiles displayed. Here you can now determine the start and end time completely freely by clicking on your desired position. There are no restrictions as to where the calculation should start and end. In the upper right corner you have the setting options with which you can switch between the profile types (for a description of these, read more under VolumeSessionPro). With a click on the little red “+” under the profile settings, you can add a further volume profile to your chart; you do so by once again determining the start and end time by left-clicking. The settings and the display of the indicator are exactly equivalent to the VolumeSessionPro: via ProfileType you select which calculation method should be used; via ValueArea you determine the percentage for what portion of the volume area should be colored with the highest activity.

![](https://docs.agenatrader.com/~gitbook/image?url=https%3A%2F%2F2805764894-files.gitbook.io%2F%7E%2Ffiles%2Fv0%2Fb%2Fgitbook-legacy-files%2Fo%2Fassets%252F-MKZSsJBtSP9L4sqIe_q%252F-MQuyUOvSDf10S_TO9Zp%252F-MQw740SyuhZ0fn8Kebs%252F3.png%3Falt%3Dmedia%26token%3Dea8dc600-2371-4602-aff3-2b7a8d0f8b81\&width=768\&dpr=4\&quality=100\&sign=a43231fe\&sv=1)

Figure 2-VolumeArea

The most effective way of working with the VolumeArea is to place this indicator in the action bar and assign it a hot key. In this way, if necessary, the indicator can be quickly called up and you can specify the desired volume area.

**1.1.4.3. KlingerVolumeOscillator**

The KlingerVolumeOscillator is a technical indicator that was developed by Stephen Klinger in order to determine long-term trends of the money flow. At the same time, the indicator is sensitive enough to also identify short-term fluctuations, thereby giving the trader the possibility to detect even short-term reversals in the market. The indicator compares the influent and effluent volume of an instrument with its price movements, and is outputted as an oscillator. A signal line (13-period moving average) is used for generating signals. Divergences in the KlingerVolumeOscillator in comparison to the price movement can also be used for entry and exit decisions. A bullish signal is formed when the KlingerVolumeOscillator start to rise while the price continues to fall; the opposite goes for a bearish signal.

![](https://docs.agenatrader.com/~gitbook/image?url=https%3A%2F%2F2805764894-files.gitbook.io%2F%7E%2Ffiles%2Fv0%2Fb%2Fgitbook-legacy-files%2Fo%2Fassets%252F-MKZSsJBtSP9L4sqIe_q%252F-MQuyUOvSDf10S_TO9Zp%252F-MQw7COyKli_2jHN6Oyl%252F4.png%3Falt%3Dmedia%26token%3D75c595bb-864d-4c7d-979d-bce8b44b5ac6\&width=768\&dpr=4\&quality=100\&sign=6579ea38\&sv=1)

Figure 3-KlingerVolumeOscillator

**1.1.4.4. VolumeKeltnerChannels**

The VolumeKeltnerChannels are a great tool to determine very high or very low volume in comparison to past periods. Beginning with an upper Keltner channel line calculated with volume data, this line is shifted ever further upwards or downwards using special multipliers. Volume that is higher than the highest Keltner channel line can be interpreted as extremely high volume that shows that huge numbers of trades have been carried out in the current price period and that an unusually large number of traders are buying or selling positions at the current price level.

![](https://docs.agenatrader.com/~gitbook/image?url=https%3A%2F%2F2805764894-files.gitbook.io%2F%7E%2Ffiles%2Fv0%2Fb%2Fgitbook-legacy-files%2Fo%2Fassets%252F-MKZSsJBtSP9L4sqIe_q%252F-MQuyUOvSDf10S_TO9Zp%252F-MQw7NBFvWKk6zd19VaC%252F5.png%3Falt%3Dmedia%26token%3D2b3eadc7-b0d5-4e77-8461-da216a78f857\&width=768\&dpr=4\&quality=100\&sign=94e5925e\&sv=1)

Figure 4-VolumeKeltnerChannels

On the other hand, a volume smaller than the lowest Keltner channel line is an indication of particularly low activity during the current price period, and only unusually few traders are interested in buying or selling positions at the predominant price.

**1.1.4.5. VolumeUDR**

The VolumeUpDownRatio is the relationship between UpVolume and DownVolume, displayed as an oscillator. Volume is classified as UpVolume when the current close of the price candle is located above the close of the prior candle; the opposite applies for DownVolume. Values above 80 are to be graded as a bearish signal; values under 20 as a bullish signal. Besides this, a moving average can be shown, which can serve as an additional signal generator.

* Using **“DrawCandleOutline”**, you can have the border of your candles colored accordingly when bullish/bearish extreme values occur.
* **PriceWeightChange** regulates whether you would like to have the weighted change of the market price flow into the calculation of the indicator

![](https://docs.agenatrader.com/~gitbook/image?url=https%3A%2F%2F2805764894-files.gitbook.io%2F%7E%2Ffiles%2Fv0%2Fb%2Fgitbook-legacy-files%2Fo%2Fassets%252F-MKZSsJBtSP9L4sqIe_q%252F-MQuyUOvSDf10S_TO9Zp%252F-MQw7SigQKq-O1rvghDM%252F6.png%3Falt%3Dmedia%26token%3D32d8c4b3-1917-4f0f-96c2-808c3acd2b68\&width=768\&dpr=4\&quality=100\&sign=f6ed8154\&sv=1)

Figure 5-VolumeUDR

**1.1.4.6. VolumeTickSpeed**

**ATTENTION!** You can only use this indicator in the tick chart! The indicator measures the number of ticks that are traded during a number of seconds defined by the user. You can set the number of seconds under the parameter “Period”. A high tick speed can, therefore, be equated with high trading intensity, which can in turn often be observed at turning points in the market. With the parameter “LimitValue”, you can specify from which number of ticks during the selected period the background should be colored in order to display extreme values.

![](https://docs.agenatrader.com/~gitbook/image?url=https%3A%2F%2F2805764894-files.gitbook.io%2F%7E%2Ffiles%2Fv0%2Fb%2Fgitbook-legacy-files%2Fo%2Fassets%252F-MKZSsJBtSP9L4sqIe_q%252F-MQuyUOvSDf10S_TO9Zp%252F-MQw7z36_OyVHUUZ7xaI%252F7.png%3Falt%3Dmedia%26token%3Dc3b3619f-829f-4050-8004-901b40d52ff6\&width=768\&dpr=4\&quality=100\&sign=c3404224\&sv=1)

Figure 6-VolumeTickSpeed

**1.1.4.7. VolumeZoneOscillator**

The VolumeZoneOscillator divides the volume activity into UpVolume and DownVolume, similarly to the VolumeUDR. Volume is ranked as UpVolume when the current closing price is located above the prior closing price; vice versa for DownVolume. The oscillator calculated hereby outputs relative percentage values. An instrument is in a positive trend when the VolumeZoneOscillator rises above a level of 5% and vice versa in a negative trend, when it falls below -5%. Values above 40% show overbought situations, while values above 60% are an indication for an extreme exaggeration in the market. On the other hand, values smaller than -40% are deemed oversold and values smaller than -60% to be classified as enormously oversold and exaggerated.

![](https://docs.agenatrader.com/~gitbook/image?url=https%3A%2F%2F2805764894-files.gitbook.io%2F%7E%2Ffiles%2Fv0%2Fb%2Fgitbook-legacy-files%2Fo%2Fassets%252F-MKZSsJBtSP9L4sqIe_q%252F-MQuyUOvSDf10S_TO9Zp%252F-MQw83jxTUc14jD7vKEx%252F8.png%3Falt%3Dmedia%26token%3Db55f33ee-e1ed-4618-aea5-f687fa55ac34\&width=768\&dpr=4\&quality=100\&sign=1b7f7b2b\&sv=1)

Figure 7-Volume Zone Oscillator

**1.1.4.8. VolumeRiseFall**

The VolumeRiseFall indicator is a normal volume display as volume bars, with, however, a different coloring than normal. A volume bar is drawn in green when the volume of this bar is higher than the volume of the previous bar, meaning that rising volume is present.

A volume bar is drawn in gray when the volume of this bar is lower than the volume of the previous bar, thereby showing falling volume.

![](https://docs.agenatrader.com/~gitbook/image?url=https%3A%2F%2F2805764894-files.gitbook.io%2F%7E%2Ffiles%2Fv0%2Fb%2Fgitbook-legacy-files%2Fo%2Fassets%252F-MKZSsJBtSP9L4sqIe_q%252F-MQuyUOvSDf10S_TO9Zp%252F-MQw88lKmTQ7aqy5z6dh%252F9.png%3Falt%3Dmedia%26token%3D84c8631c-4191-4652-b00f-68b79b88b184\&width=768\&dpr=4\&quality=100\&sign=4e1b57b1\&sv=1)

Figure 8-VolumeRiseFall

**1.1.4.9. WyckoffWave**

The WyckoffWave indicator adds the volume for each following bar until a price wave is over / finished. You can set the sensitivity of the price waves. When the volume of a wave rises to particularly high values, is it very often because a turning point in the chart has been reached. When the volume bars are colored red, we are dealing with a short wave; green volume bars indicate a long wave. Using the parameter **“MedianPeriod”** you can select how sensitively the indicator should determine the individual price waves. The smaller the value, the larger the price waves that the indicator calculates. The parameter Poles serves to fine-tune the display of the volume waves; you can select a parameter between 1-4. Changing this value usually causes only imperceptible changes.

![](https://docs.agenatrader.com/~gitbook/image?url=https%3A%2F%2F2805764894-files.gitbook.io%2F%7E%2Ffiles%2Fv0%2Fb%2Fgitbook-legacy-files%2Fo%2Fassets%252F-MKZSsJBtSP9L4sqIe_q%252F-MQuyUOvSDf10S_TO9Zp%252F-MQw8EjLRait6hNIHa6u%252F10.png%3Falt%3Dmedia%26token%3Dbe6fc60a-0018-4aea-90ad-a3439b6b4f26\&width=768\&dpr=4\&quality=100\&sign=d69ef41d\&sv=1)

Figure 9-WaveVolume

**1.1.4.10. VolumeGraph**

This indicator contains a normal volume histogram, but here, the coloring takes place based on price trends. The VolumeGraph determines short- or long-term price trends; you can set the sensitivity for this using the parameter **“SlopeLength”**. A high value delivers long-term trends; low values represent short-term price trends. Using the setting **“Exponential**”, you can select whether the calculation for trend determination should be based on an exponential (=True) or linear (=False) algorithm. This is about the fine-tuning, and no large changes should be expected with this parameter. In addition, the volume histogram also contains a moving average, for which you can enter the period using the parameter **“AvgLength**”.

![](https://docs.agenatrader.com/~gitbook/image?url=https%3A%2F%2F2805764894-files.gitbook.io%2F%7E%2Ffiles%2Fv0%2Fb%2Fgitbook-legacy-files%2Fo%2Fassets%252F-MKZSsJBtSP9L4sqIe_q%252F-MQuyUOvSDf10S_TO9Zp%252F-MQw9lkTLWTesF7r3Kxo%252F11.png%3Falt%3Dmedia%26token%3Dddb660a0-a57f-422a-b9da-054d276fa0e5\&width=768\&dpr=4\&quality=100\&sign=dba23868\&sv=1)

Figure 10-VolumeGraph

**1.1.4.11. VolumeSentimentLong**

This indicator detects bullish volume activity based on the analysis of the volume of a period, the price span of a bar and the close of the bar (=VolumeSpreadAnalysis). It screens for 3 signals (listed are the sub-criteria that must be met for the respective signal):

* **SellingClimax** (dark green)

6.11..1. Lowest low since 50 periods 6.11..2. Bar with large range 6.11..3. Extremely high volume

* **DemandComingIn** (lime green)

6.11..1. UpBar (current close larger than previous close) 6.11..2. Previous Bar: DownBar (close smaller than previous close) 6.11..3. Previous Bar: Bar with large range 6.11..4. Previous Bar: Above-average high volume

* **BagHolding** (light green)

6.11..1. Lowest low since 50 periods 6.11..2. DownBar 6.11..3. Bar with small range 6.11..4. Above-average high volume 6.11..5. Close larger than or equal to the middle of the bar

The VolumeSentiments provide the foundation for the calculation of the volume condition; see point 5. When a bullish VolumeSentiment occurs, the bar is colored in the respective color of the signal; you can change this color in the parameter settings.

![](https://docs.agenatrader.com/~gitbook/image?url=https%3A%2F%2F2805764894-files.gitbook.io%2F%7E%2Ffiles%2Fv0%2Fb%2Fgitbook-legacy-files%2Fo%2Fassets%252F-MKZSsJBtSP9L4sqIe_q%252F-MQuyUOvSDf10S_TO9Zp%252F-MQw9sPCmSR91g8BdgtF%252F12.png%3Falt%3Dmedia%26token%3Dab459df0-b146-48a0-900c-8516f55bd22d\&width=768\&dpr=4\&quality=100\&sign=c50772d4\&sv=1)

Figure 11-VolumeSentimentsLong

**1.1.4.12. VolumeSentimentShort**

This indicator is the counterpart to the VolumeSentimentLong and detects bearish volume activity based on the analysis of the volume of a period, the price span of a bar and the close of the bar (=VolumeSpreadAnalysis). It screens for 3 signals (listed are the sub-criteria that must be met for the respective signal):

* **BuyingClimax** (dark red)

6.12..1. Highest high since 50 periods 6.12..2. Bar with large range 6.12..3. Extremely high volume

* **SupplyComingIn** (red)

6.12..1. DownBar 6.12..2. Previous Bar: UpBar 6.12..3. Previous Bar: Bar with large range 6.12..4.Previous Bar: Above-average high volume

* **EndOfRisingMarket** (coral)

6.12..1. Highest high since 50 periods 6.12..2. UpBar 6.12..3. Bar with small range 6.12..4.Above-average high volume 6.12..5.Close smaller than or equal the middle of the bar

The VolumeSentiments provide the foundation for the calculation of the volume conditions; see point 5. When a bearish VolumeSentiment occurs, the bar is colored in the respective color of the signal; you can change this color in the parameter settings.

![](https://docs.agenatrader.com/~gitbook/image?url=https%3A%2F%2F2805764894-files.gitbook.io%2F%7E%2Ffiles%2Fv0%2Fb%2Fgitbook-legacy-files%2Fo%2Fassets%252F-MKZSsJBtSP9L4sqIe_q%252F-MQuyUOvSDf10S_TO9Zp%252F-MQwA6iTvdIMACGzHxTG%252F13.png%3Falt%3Dmedia%26token%3D72d57648-1ad2-407f-9c6e-0c11c83aa2ad\&width=768\&dpr=4\&quality=100\&sign=d050a8c4\&sv=1)

Figure 12-VolumeSentimentsShort

#### 1.1.5. DESCRIPTION OF THE CONDITIONS <a href="#id-1.1.5.-description-of-the-conditions" id="id-1.1.5.-description-of-the-conditions"></a>

Volume signals should generally not be traded with market orders immediately, but instead one should wait for a confirmation of the signal with stop orders at the high or low of the signal candle. You should avoid trading long signals in downwards trend if at all possible; conversely, we advise you not to trade short signals in upwards trends. The basis for the long signals are the VolumeSentimentsLong; in order for a long signal to occur, a VolumeSentimentLong must have occurred during the last 50 bars; the opposite is true for short signals with the VolumeSentimentsShort.

The signals are based on the VolumeSpread analysis; the principle of this theory states that strength in the market becomes visible in DownBars (a bar that closes lower than the previous bar), and that weakness can be recognized in UpBars (a bar that closes higher than the previous bar). For this, certain conditions regarding the volume, the range of the bar and the position of the closing price must be fulfilled. The conditions can, in general, be applies in all timeframes, but application only makes sense for values for which there is sufficient volume information. For Forex values, therefore, the conditions are not applicable.

**1.1.5.1. Long\_NoSupply**

* UpBar
* Volume larger than volume of the previous bar
* Previous Bar: DownBar
* Previous Bar: Small range
* Previous Bar: Below-average volume
* Previous Bar: Volume smaller than the two previous periods

A NoDemand bar has the largest hit probability when it is in the range of a previous long sentiment with very high volume. The market will very likely not be in a position to break through the VolumeSentiment signal in the opposite direction with the current low volume. NoDemand shows that there is currently no interest in lower prices.

**1.1.5.2. Long\_StoppingVolume**

* UpBar
* Very low volume
* Previous Bar: DownBar
* Previous Bar: Bar with small range
* Previous Bar: Very high volume

Stopping Volume means that after a bar with high volume, the direction cannot be continued. If the high volume were to consist exclusively of sell orders, then the next period would be unable to close higher i.e. the sell direction would have to continue. There would, therefore, have to have been many buy orders included in the high volume, meaning that there is increasing interest in higher prices or at least no more interest in lower prices.

**1.1.5.3. Long\_TestBar**

* DownBar
* Bar with small range
* Very small volume
* Volume smaller than that of the previous period

Professional traders will only open large buy positions in a market when they can be relatively sure that the market is not yet full of sellers. One way of checking this is to drive the market slightly downwards, which is supposed to cause the potential sellers to react to the small short movements. If, despite a sinking of the price, only very low volume with very low price range can be observed, this is an indication that there is no strong pressure to sell weighing on the market – according to this, the test has had a positive outcome and the professional traders are now ready to open their long positions. With this signal, too, it is very clear to see that the future strength of a market can be observed in DownBars.

**1.1.5.4. Long\_TwoBarReversal**

* UpBar
* Range of the bar average to high
* Close of the bar near to the high
* Above-average high volume of the current or previous period
* Close above the high of the previous period
* Previous Bar: DownBar
* Previous Bar: average to high range

A TwoBarReversal optimally occurs at support zones. One of the two bars of the TwoBarReversal has to exhibit above-average high volume, which can be interpreted as high activity of the market participants at the current price level. The second bar changes the market direction, thereby clearly insinuating that the market participants currently have no interest in lower prices.

**1.1.5.5. Short\_UpThrust**

* Highest high since 50 periods
* UpBar
* Close near to the low
* Average or large range of the bar
* Very high volume

Commonly, markets react negatively when a new high with very high volume is reached; it is precisely these situations that are searched for here.

**Attention!** If the market continues to climb further after an upthrust, this is a clear long signal.

**1.1.5.6. Short\_HiddenUpthrust**

Same logic as the upthrust; however, here, the new high is achieved with a DownBar. For details, see point 5.5.

**1.1.5.7. Short\_NoDemand**

* DownBar
* Volume larger than volume of the previous bar
* Previous Bar: UpBar
* Previous Bar: Small range
* Previous Bar: Below-average volume
* Previous Bar: Volume smaller than for the two previous periods

A NoDemand bar has the largest hit probability when it is in the range of a previous short sentiment with very high volume. The market will very likely not be in a position to break through the VolumeSentiment signal in the opposite direction with the current low volume. NoDemand shows that there is currently no interest in higher prices.

**1.1.5.8. Short\_TwoBarReversal**

* DownBar
* Range of the bar average to high
* Close of the bar near to the low
* Above-average high volume of the current of previous period
* Close below the low of the previous period
* Previous Bar: UpBar
* Previous Bar: Average to high range

A TwoBarReversal optimally occurs at resistance zones. One of the two bars of the TwoBarReversal has to exhibit above-average high volume, which can be interpreted as high activity of the market participants at the current price level. The second bar changes the market direction, thereby clearly

## Dow Theory AddOn Professional

**Contents**

All indicators from the Market Technique Standard AddOn

* MarketPhases Analyzer Professional
* P123 Professional

<figure><img src="https://docs.agenatrader.com/~gitbook/image?url=https%3A%2F%2F2805764894-files.gitbook.io%2F%7E%2Ffiles%2Fv0%2Fb%2Fgitbook-legacy-files%2Fo%2Fassets%252F-MKZSsJBtSP9L4sqIe_q%252F-MQuyUOvSDf10S_TO9Zp%252F-MQw4qB82h6Li6BvkggA%252FMTProIndikatoren.png%3Falt%3Dmedia%26token%3D5f1278b9-3c67-4c56-8e37-334cedc6bb40&#x26;width=768&#x26;dpr=4&#x26;quality=100&#x26;sign=a8f67d0c&#x26;sv=1" alt=""><figcaption></figcaption></figure>

Conditions: (also available in the Setup Builder)

* BreakOut from P2
* Early P3
* Reversal Bars Professional
* Outside Bar BreakOut
* You can find [more information](https://www.youtube.com/watch?v=Tn-WUwvigOw) on our YouTube video channel.

<figure><img src="https://docs.agenatrader.com/~gitbook/image?url=https%3A%2F%2F2805764894-files.gitbook.io%2F%7E%2Ffiles%2Fv0%2Fb%2Fgitbook-legacy-files%2Fo%2Fassets%252F-MKZSsJBtSP9L4sqIe_q%252F-MQuyUOvSDf10S_TO9Zp%252F-MQw4w_lE1tGA5cADnmJ%252FMTProConditions.png%3Falt%3Dmedia%26token%3D21cb3719-db96-4503-8ab4-0fed8b6f23ea&#x26;width=768&#x26;dpr=4&#x26;quality=100&#x26;sign=9b5095cb&#x26;sv=1" alt=""><figcaption></figcaption></figure>

Market technique stops: (also available in the Setup Builder)

* MT Pro OutsideBar Mover (moving stop)
* MT Pro P3 Stop T0
* MT Pro P3 Stop T1
* MT Pro P3 Stop T2
* MT Pro P3 Stop T3

<figure><img src="https://docs.agenatrader.com/~gitbook/image?url=https%3A%2F%2F2805764894-files.gitbook.io%2F%7E%2Ffiles%2Fv0%2Fb%2Fgitbook-legacy-files%2Fo%2Fassets%252F-MKZSsJBtSP9L4sqIe_q%252F-MQuyUOvSDf10S_TO9Zp%252F-MQw5-c0TB8h1h5VpKKt%252FMTProStopps.png%3Falt%3Dmedia%26token%3D872451c4-c8e3-4dbd-addd-b2b19b19ae5f&#x26;width=768&#x26;dpr=4&#x26;quality=100&#x26;sign=ceb47ebe&#x26;sv=1" alt=""><figcaption></figcaption></figure>

A market technique workspace (see PDF documentation on the [Dow Theory landing page](https://agenatrader.com/dow-theory-addon/)).

Scanner

Dynamic trend filter long / short (see PDF documentation on the [Dow Theory landing page](https://agenatrader.com/dow-theory-addon/)).

<figure><img src="https://docs.agenatrader.com/~gitbook/image?url=https%3A%2F%2F2805764894-files.gitbook.io%2F%7E%2Ffiles%2Fv0%2Fb%2Fgitbook-legacy-files%2Fo%2Fassets%252F-MKZSsJBtSP9L4sqIe_q%252F-MQuyUOvSDf10S_TO9Zp%252F-MQw53oLQ_p3MJZh6zxn%252FMTProScanner.png%3Falt%3Dmedia%26token%3D4f4e2a81-4ed8-4711-972b-b735c97b982f&#x26;width=768&#x26;dpr=4&#x26;quality=100&#x26;sign=f8cf1b08&#x26;sv=1" alt=""><figcaption></figcaption></figure>

**Attention!** "You are trading against a trend": this notification appears if the user opens a position that, according to a setup, is going in the opposite direction of the trend. This means that the trend stop is pointless! This notification is displayed if the trend direction is short but the user is entering into a long position.

**Market Technique landing page**

On the [Dow Theory landing page](https://agenatrader.com/dow-theory-addon/) you will find numerous further explanations and details surrounding the features of our MT AddOns

##


# External Packages

## ABT Trading AddOns

coming soon

## Ruhnau AddOns

coming soon

### Ruhnau Fundamentals

### Ruhnau Options

### Ruhnau Turningpoints

## BornPackages

coming soon

## COT Masterclass AddOn

coming soon

## DARVAS

#### BRIEF DESCRIPTION DARVAS ADD-ON <a href="#brief-description-darvas-add-on" id="brief-description-darvas-add-on"></a>

**WARNING!** Dear customers, before you start working with the Darvas workspace and indicators, we ask that you read these instructions thoroughly before modifying any settings. The Darvas Add-On is an advanced tool that contains a large number of settings and parameters – incorrect settings made due to “curiosity” may lead to undesired behavior.

**IMPORTANT!** You can carry out any changes you want in the indicator settings; however, we strongly recommend that you only touch the parameters with which you are familiar. The Darvas Add-On is designed for End-of-Day trading, since the original trading strategy was not developed for intraday trading. You can use the trading signals in every timeframe, but you must be aware that the trading strategy is not optimized for this. Wishing you much success in trading with the Darvas Add-On Your AgenaTrader support team.

#### INSTRUCTIONS PACKAGE INSTALLATION <a href="#instructions-package-installation" id="instructions-package-installation"></a>

* After making your purchase, you will receive the following file sent to you by email:
  * DarvasStandardPackage.atpack / DarvasProfessionalPackage.atpack: this file is the actual package including all components contained within.

**ATTENTION!** If you are using Internet Explorer or Microsoft Edge, the .atpack file may automatically be renamed as a zip file by your browser. After downloading, therefore, you need to rename the DarvasStandardPackage.zip /DarvasProfessionalPackage.zip to DarvasStandardPackage.atpack / DarvasProfessionalPackage.atpack!

* Save the .atpack file on your hard drive.
* Now you still need to enter your license for the package in AgenaTrader. To do so, click on the symbol with the question mark, select About -> Enter activation key, then navigate to “DarvasStandardPackage” / “DarvasProfessionalPackage” and enter your activation key, which you received via email. Click on “Activate”. Once you see the message that your license has been successfully activated, close this window.
* Open Tools->Packages->Import package, read the subsequent backup information and, if you have already carried out a backup, click on OK. In the next window, navigate to the storage location of the DarvasStandardPackage.atpack file, click on it and then select “Open”. Confirm the request to restart AgenaTrader by clicking on “OK”.
* After restarting, the first step is to establish a connection to the data feed.
* Once you have established a connection to your data feed, select Main -> Workspace -> DarvasStandard / DarvasProfessional to load theDarvas workspace. As soon as all charts are fully loaded, the DarvasStandardPackage is completely ready for use.

<figure><img src="https://docs.agenatrader.com/~gitbook/image?url=https%3A%2F%2F2805764894-files.gitbook.io%2F%7E%2Ffiles%2Fv0%2Fb%2Fgitbook-legacy-files%2Fo%2Fassets%252F-MKZSsJBtSP9L4sqIe_q%252F-MQuyUOvSDf10S_TO9Zp%252F-MQw3Y_Kt3wA7ph83ggb%252FWorkspase.jpg%3Falt%3Dmedia%26token%3D8dc7ce91-27a2-4359-8c57-2380a862fc20&#x26;width=768&#x26;dpr=4&#x26;quality=100&#x26;sign=54909152&#x26;sv=1" alt=""><figcaption></figcaption></figure>

### Standard ADD-ON <a href="#darvas-standard-add-on" id="darvas-standard-add-on"></a>

The DarvasStandardAddOn offers great support if you wish to implement Nicolas Darvas’ famous signals semi or fully automatically. However, in order to enable pre-filtering of the values according to Darvas’ logic as well as for the PotentialDarvasBreakout signal, which predicts when a Darvas boundary will be broken through, you do need the DarvasProfessionalAddOn. **Indicators:**

* **DarvasPro:** This indicator is the evolution of the DarvasBox indicator that is contained in AgenaTrader by default. What has been improved is the underlying calculation, which has also been equipped with further data series so as to ensure optimal calculation of the signals. Furthermore, we have developed background coloring within the boxes in order to provide a better graphic display of the Darvas boxes. This background color is also the only parameter you can set in the DarvasPro. You can find details on setting up Darvas boxes and how these are constructed in the description of the old Darvas boxes – the logic of the box construction has remained the same: [LINK](https://agenatrader.github.io/AgenaIndicator-documentation/indicators_oscillators/#darvas-boxes)

<figure><img src="https://docs.agenatrader.com/~gitbook/image?url=https%3A%2F%2F2805764894-files.gitbook.io%2F%7E%2Ffiles%2Fv0%2Fb%2Fgitbook-legacy-files%2Fo%2Fassets%252F-MKZSsJBtSP9L4sqIe_q%252F-MQuyUOvSDf10S_TO9Zp%252F-MQw3bRucYMBlLvxjXSu%252FDarvasPro.jpg%3Falt%3Dmedia%26token%3Dcb0b9d63-8cf5-4d80-bb0e-8d475199079f&#x26;width=768&#x26;dpr=4&#x26;quality=100&#x26;sign=bdf7af21&#x26;sv=1" alt=""><figcaption></figcaption></figure>

* **ScriptedConditions**
  * **DarvasBreakout:** The classic Darvas breakout signal arises when either the upper boundary of the Darvas box is broken in an upward direction (= long signal) or the lower boundary is broken in a downward direction (= short signal). In addition, the breakout must also have an aboveaverage volume, which suggests a strong movement and enough strength for a breakthrough with high momentum.

<figure><img src="https://docs.agenatrader.com/~gitbook/image?url=https%3A%2F%2F2805764894-files.gitbook.io%2F%7E%2Ffiles%2Fv0%2Fb%2Fgitbook-legacy-files%2Fo%2Fassets%252F-MKZSsJBtSP9L4sqIe_q%252F-MQuyUOvSDf10S_TO9Zp%252F-MQw3hV9bOPHBGNjiOC_%252FDarvasBreakout.jpg%3Falt%3Dmedia%26token%3D868cd5fc-104f-421c-a8df-4c048b4bbedf&#x26;width=768&#x26;dpr=4&#x26;quality=100&#x26;sign=2fc68478&#x26;sv=1" alt=""><figcaption></figcaption></figure>

The parameters that you are able to set for these scripted conditions are the arrow colors of the signal markings, the arrow size and the basic display of the arrows.

* **Stops**
  * **DarvasInitialStop:** Darvas’ strategy is based on the fact that a successful signal should immediately be followed by a strong movement. This is why it is possible to place the initial stop very close with this strategy.The DarvasInitialStop is placed at a distance of exactly 0.5 x ATR(14) from the upper or lower Darvas boundary. This enables very good risk management, since a trade is quickly stopped out if the idea is not successful, meaning that the margin is rapidly freed up and you can immediately look for the next trade. On the other hand, a tight initial stop means that with a successful trade idea, you very quickly generate profit in your account and targets are rapidly reached.
  * **DarvasStop:**&#x4A;ust as in the original strategy by Nicolas Darvas, the DarvasStop is always trailed at the high/low of the current, confirmed (!) box. For a short trade, it is always the current, most recently confirmed upper boundary of the Darvas box that is used. For a long trade, vice versa; the lower boundary is used as a stop price.

<figure><img src="https://docs.agenatrader.com/~gitbook/image?url=https%3A%2F%2F2805764894-files.gitbook.io%2F%7E%2Ffiles%2Fv0%2Fb%2Fgitbook-legacy-files%2Fo%2Fassets%252F-MKZSsJBtSP9L4sqIe_q%252F-MQuyUOvSDf10S_TO9Zp%252F-MQw3nQa-6FeF0e5zvig%252FDarvasStop.jpg%3Falt%3Dmedia%26token%3D71858ba2-d549-4026-885e-62efe1f3a4cb&#x26;width=768&#x26;dpr=4&#x26;quality=100&#x26;sign=6de974ad&#x26;sv=1" alt=""><figcaption></figcaption></figure>

* **DarvasGhostStop** With the DarvasGhostStop, the stop is trailed at so-called ghost boxes, which are a development from Daryl Guppy. This further development of the usual Darvas stop is intended to enable fast, tight trailing of the stop when it comes to market movements with great momentum. A ghost box is formed when the price breaks through a box boundary and the subsequent movement is so fast that for several bars, no new box can be generated. As soon as the price has run the length of the last box above the upper boundary (for long trades) or below the lower boundary (for short trades), the first ghost box is formed, which has exactly the same height as the last active and valid Darvas box. The stop is now trailed at the low (for long trades) or the high (for short trades) of the ghost box, making it possible to place the stop closer to the market. An unlimited number of ghost boxes can form one after the other; the stop is always trailed at the respective high/low of the ghost box, either until the trade is stopped out or a new, valid Darvas box is formed – then the stop is trailed at the high/low of the valid Darvas box.

<figure><img src="https://docs.agenatrader.com/~gitbook/image?url=https%3A%2F%2F2805764894-files.gitbook.io%2F%7E%2Ffiles%2Fv0%2Fb%2Fgitbook-legacy-files%2Fo%2Fassets%252F-MKZSsJBtSP9L4sqIe_q%252F-MQuyUOvSDf10S_TO9Zp%252F-MQw41oQDsNGYKCAVS7h%252FDarvasGhostStop.jpg%3Falt%3Dmedia%26token%3D5abe018b-26b1-429d-986c-1192c491ef5d&#x26;width=768&#x26;dpr=4&#x26;quality=100&#x26;sign=1ace6278&#x26;sv=1" alt=""><figcaption></figcaption></figure>

**Workspace**

* **DarvasStandard** In this workspace, Darvas breakout signals are searched for in the 1Day and 1Week basis; the SP500 stock list is loaded by default. So as not to miss out on any notifications of breakout signals, the daily chart is screened for new signals every 5 minutes, and the weekly chart is screened every hour. Therefore, as soon as the market makes a breakout in the daily or weekly basis, the signal is immediately displayed and you can trade it! Only long signals are searched for in the DarvasLong LCG, and only short signals in the DarvasShort LCG.

<figure><img src="https://docs.agenatrader.com/~gitbook/image?url=https%3A%2F%2F2805764894-files.gitbook.io%2F%7E%2Ffiles%2Fv0%2Fb%2Fgitbook-legacy-files%2Fo%2Fassets%252F-MKZSsJBtSP9L4sqIe_q%252F-MQuyUOvSDf10S_TO9Zp%252F-MQw46JUn_bGSJC8oKig%252FDarvasStandard.jpg%3Falt%3Dmedia%26token%3D03f99dc2-d70a-4a75-9ab8-733ca8db554d&#x26;width=768&#x26;dpr=4&#x26;quality=100&#x26;sign=7b9663ec&#x26;sv=1" alt=""><figcaption></figcaption></figure>

### Professional ADD-ON <a href="#darvas-professional-add-on" id="darvas-professional-add-on"></a>

The Darvas Professional Add-On provides you with optimal support when trading the famous Darvas strategy. From the fully-automated filtering of the instruments according to Darvas’ criteria, all the way to the signal search in the highly potential instruments, everything is integrated and prepared for you in the workspace.

**Indicators:**

* DarvasPro: See DARVAS STANDARD ADD-ON
* **MoveSinceLastHighLow** This indicator calculates the percentage of an instrument’s movement, measured by the high/low of the last x periods. In the parameter settings, under “Last high or low”, you can select whether the calculation should start from the last high or low. Here, the setting “Lookback period” determines how many bars should be used to detect the last highest high or lowest low. This indicator forms the basis for the filter conditions described in the following point.

<figure><img src="https://docs.agenatrader.com/~gitbook/image?url=https%3A%2F%2F2805764894-files.gitbook.io%2F%7E%2Ffiles%2Fv0%2Fb%2Fgitbook-legacy-files%2Fo%2Fassets%252F-MKZSsJBtSP9L4sqIe_q%252F-MQuyUOvSDf10S_TO9Zp%252F-MQw4Ab0G_9EixhcTN18%252FMoveSinceLastHighLow.jpg%3Falt%3Dmedia%26token%3Df986ef45-0fca-4197-9ed0-df3ee90bd2f0&#x26;width=768&#x26;dpr=4&#x26;quality=100&#x26;sign=7ff48c52&#x26;sv=1" alt=""><figcaption></figcaption></figure>

**Conditions**

The following conditions use the MoveSinceLastHighLow indicator to measure the performance of an instrument. Depending on which value this indicator outputs, the respective condition is either “True” or “False”. These conditions are used in the form of filter conditions as an input for the AQConditionFilter to carry out the automatic sorting of the instruments. The names of the conditions here are self-explanatory. The following conditions are included in the DarvasProfessional Add-On:

* * SixtyToSeventyPercentUpmove
  * SeventyToEightyPercentUpmove
  * EightyToNinetyPercentUpmove
  * NinetyToHundredPercentUpmove
  * MoreThanHundredPercentUpmove
  * ThirtyToThirtyFivePercentDownmove
  * ThirtyFiveToFourtyPercentDownmove
  * FourtyToFourtyFivePercentDownmove
  * FourtyFiveToFiftyPercentDownmove
  * MoreThanFiftyPercentDownmove

You can build your own conditions exactly how you would like them, and you can then use these as an input for the ConditionFilter, so you do not have to use the pre-prepared conditions. With the MoveSinceLastHighLow indicator, for this purpose, you can query any performance value since the last highest high / lowest low and include these values in filter conditions.

* **ScriptedConditions**
  * **PotentialDarvasBreakout** The PotentialDarvasBreakout signal is outputted when a value runs right up next to the upper or lower Darvas boundary and, in addition, a confirmed Darvas box is also already present. This means that the signal comes earlier than the DarvasBreakout signal, which is only activated when the price actually exceeds the upper or lower boundary of the box. With the PotentialBreakout signal, you have the possibility to place your orders early on, meaning you no longer miss any top signals.

When you start the PotentialDarvasBreakout signal by double-clicking in the list, the entry order is placed directly at the boundary of the Darvas box, and once this is crossed, the trade is opened in accordance with Nicolas Darvas’ rules.

* * **AQ ConditionFilter** The AQConditionFilter serves to manage the automatic sorting of the values into the corresponding instrument lists. This is a separate product by our tech partner AlgoQuantics that has been integrated into the DarvasProfessional package. You can find a detailed description of this tool in the second attached description, which you should have received when you purchased the DarvasProfessional Add-On.

<figure><img src="https://docs.agenatrader.com/~gitbook/image?url=https%3A%2F%2F2805764894-files.gitbook.io%2F%7E%2Ffiles%2Fv0%2Fb%2Fgitbook-legacy-files%2Fo%2Fassets%252F-MKZSsJBtSP9L4sqIe_q%252F-MQuyUOvSDf10S_TO9Zp%252F-MQw4GnX_RCfktyF56DM%252FAQ%2520ConditionFilter.jpg%3Falt%3Dmedia%26token%3Dd2e2c0ae-4171-4857-9cc2-19de588c0b13&#x26;width=768&#x26;dpr=4&#x26;quality=100&#x26;sign=af5390db&#x26;sv=1" alt=""><figcaption></figcaption></figure>

* **Stops**: Same stops as DarvasStandard
* **Workspace**
  * DarvasProfessional
    * Pre-prepared watch list: With the help of the pre-prepared watch list, you receive an excellent overview of all markets that interest you. From the current bid/ask, the volume, the daily performance, main and sub-sectors and the entire pre-screening to the AQConditionFilter, everything is processed and displayed in the watch list. Here, the Russell1000 is loaded as the default instrument list, but you can load any instrument list you like – depending on which instrument you would like to trade. The AQConditionFilters are loaded in the columns 60-70%, 70-80% etc. Whenever a green “1” appears in a column, the filter condition applies and the value is sorted into the instrument list of the same name. The green column “MoveSinceLastLow” measures the increase of the value since the lowest low of the past year. The value measured here is crucial for the sorting into the lists. If, for example, a value of 62.50 is outputted, the instrument will be sorted into the list 60-70%, and therefore the green “1” will also show up in the 60-70% Upmove column. For the red column “MoveSinceLastHigh”, the same thing goes but vice versa, i.e. here, the decrease since the highest high of the past year is measured and is again a decisive value for sorting the Downmove values.

<figure><img src="https://docs.agenatrader.com/~gitbook/image?url=https%3A%2F%2F2805764894-files.gitbook.io%2F%7E%2Ffiles%2Fv0%2Fb%2Fgitbook-legacy-files%2Fo%2Fassets%252F-MKZSsJBtSP9L4sqIe_q%252F-MQuyUOvSDf10S_TO9Zp%252F-MQw4LrQSoTD6lzprdMe%252FPre-prepared%2520watch%2520list.jpg%3Falt%3Dmedia%26token%3D223a1479-13a8-454a-9939-a658977f5b0f&#x26;width=768&#x26;dpr=4&#x26;quality=100&#x26;sign=a6c493e2&#x26;sv=1" alt=""><figcaption></figcaption></figure>

* Fully automatic pre-screening
  * 60-70 % Upmove
  * 70-80 % Upmove
  * 80-90 % Upmove
  * 90-100 % Upmove
  * \> 100 % Upmove
  * 30-35 % Downmove
  * 35-40 % Downmove
  * 40-45 % Downmove
  * 45-50 % Downmove
  * \> 50 % Downmove

Upmove refers to a movement since the lowest low of the past year. Thus 60-70% Upmove means that all values that have increased their value by 60-70% since the lowest low of the past year are sorted into this list. The opposite goes for Downmove; here, the loss in value is established by the highest high of the past year. So all values that have lost 30-35% of their value since the highest high of the past year are sorted into the list 30-35% Downmove. This pre-sorting makes it possible to determine relatively strong and relatively weak stocks. In the strong values, the software searches only for long signals, and in the weak values, only short signals. Here, the Darvas strategy assumes that the behavior exhibited by a value up to the present moment will continue in the same direction, which is equivalent to a trend-following approach.

* ListChartGroups:

In the individual list chart groups that are set up in the workspace by default, therefore, the values are automatically sorted as described. Then, AT screens for the DarvasBreakout and the PotentialDarvasBreakout signal in the 1Day and 1Week basis directly in the LCGs. The third column in the list is the “MoveSinceLastLow” in the Upmove lists and the “MoveSinceLastHigh” in the Downmove lists, and therefore displays the same values as in the watch list described above.

<figure><img src="https://docs.agenatrader.com/~gitbook/image?url=https%3A%2F%2F2805764894-files.gitbook.io%2F%7E%2Ffiles%2Fv0%2Fb%2Fgitbook-legacy-files%2Fo%2Fassets%252F-MKZSsJBtSP9L4sqIe_q%252F-MQuyUOvSDf10S_TO9Zp%252F-MQw4e_iSHvQe3pdzyvN%252FListChartGroups.jpg%3Falt%3Dmedia%26token%3D9c903718-961f-4fb9-91d3-b7deaa067539&#x26;width=768&#x26;dpr=4&#x26;quality=100&#x26;sign=742da5e9&#x26;sv=1" alt=""><figcaption></figcaption></figure>

To check the superior timeframe, which is located in the bottom right of the ListChartGroup. For additional orientation, the VolumeZoneOscillator is loaded here, with which extreme points in the chart are meant to be determined in order to support your analysis and check that the superior timeframe is not generating any countersignals. Each of the charts discussed has the prefabricated action bar loaded; in the signal and trading levels, in addition, there are also the two EntryEscort buttons “B” and “S”, with which you can enter the entire order construct including stop and targets for trading the volume signals with just one click. For this, you need the Andromeda version of AgenaTrader to be able to use the AT++ functions.

The settings of this setup look like this:

* InitialStop: BarByBar (3BarsBack)
* HardStop: BarByBar (2BarsBack)
* SoftStop: BarByBar (1BarBack)
* Target: Pivot2Levels

Here, again, we are talking about a suggestion that is supposed to give you an idea of how you could trade the volume signals. Obviously, you can modify and change this setup entirely according to your preferences.

Each ListChartGroup also includes a list containing an AnalyzerColumn column that screens according to the eight volume conditions. For the 15-minute lists, it screens for signals every 15 minutes; in the 1-hour lists, the AnalyzerColumns are set to 1 hour – this means that you no longer miss a single signal and can hand over all the screening work to AgenaTrader. In the volume column in the list, the currently traded volume is displayed, so that you can keep an eye on the instruments with the highest activity at all times.

The futures list also contains a column with the expiry dates of the futures, in which you can always check whether the correct contract date is set for every contract. Below the ListChartGroup, there are also two TickCharts including the TickSpeed indicator, which shows when the market exhibits particularly high activity, which can point to changes in the prevailing market direction. The left of the two tick charts is loaded with the DowJones30 values; the most important futures have been deposited into the right-hand tick chart – you can switch between these very simply by clicking on the descriptions beneath the chart. With this, you always have an overview of the most important markets. To finish off, the last component is the DepthOfMarket window including the Times\&Sales list, loaded in the very bottom right of the workspace. Here you can enter any symbol, thereby additionally giving you a precise overview of the processes and the volume on the bid & ask side.

#### 1.1.4. DESCRIPTION OF THE INDICATORS <a href="#id-1.1.4.-description-of-the-indicators" id="id-1.1.4.-description-of-the-indicators"></a>

**1.1.4.1. VolumeSessionPro**

This indicator is equivalent to the well-known VolumeProfile indicator with a display for a specific time span (session). You can determine the start time and the length of a session however you wish. For each session, the VolumeProfile is then shown. Use this indicator only in timeframes smaller than 1 day; the smaller the timeframe selected, the more detailed the display of the VolumeProfile. The price at which the most volume was traded in the respective session is shown as a red bar. The price area in which, for example, 70% of the trading activity for the respective session tookplace, is colored light blue. You can determine this percentage yourself as you wish under the parameter “ValueArea”.

Furthermore, you have four different options for displaying the volume information:

**4.1.1. VOC (Volume on close):** Loads the entire volume of a bar at the closing price of this bar – e.g. if a 5-minute bar has a volume of 280 and a range of 1.5 points with a closing price at 1534.25, all 280 volume units are counted at the closing price of 1534.24.

**4.1.2. TPO (Time price opportunity):** This method does not take the actual traded volume into account, but instead counts an individual volume unit for each price in the traded range of the bar – e.g. if a 5-minute bar has its high at 1534 and its low at 1532.5, then one volume unit is counted for each of the following prices: 1532.50, 1532.75, 1533.0, 1533.25, 1533.50, 1533.75, and 1534.

![](https://docs.agenatrader.com/~gitbook/image?url=https%3A%2F%2F2805764894-files.gitbook.io%2F%7E%2Ffiles%2Fv0%2Fb%2Fgitbook-legacy-files%2Fo%2Fassets%252F-MKZSsJBtSP9L4sqIe_q%252F-MQuyUOvSDf10S_TO9Zp%252F-MQw5LjQqsJjZ6RCtLWr%252F2.png%3Falt%3Dmedia%26token%3D041831ba-8fc5-4c31-9f64-684166beb226\&width=768\&dpr=4\&quality=100\&sign=da5ca0d1\&sv=1)

Figure 1-VolumeSessionPro

**4.1.3. VWTPO (Volume weighted time price opportunity):** This version distributes the traded volume of a bar across its price range – e.g. if a 5-minute bar exhibits a volume of 280 with a range of 1.5 points, with its high at 1534 and low at 1532.5, then 40 volume units (=280/7) are added to each of the seven prices in this range: 1532.50, 1532.75, 1533.0, 1533.25, 1533.50, 1533.75, and 1534.

**4.1.4. VTPO (Volume time price opportunity):** Here, the traded volume is added to each price of the range – e.g. if a 5-minute bar has 280 volume units, a range of 1.5 points with a high at 1534 and low at 1532.5, then 280 volume units are added to each of the seven prices of the range:: 1532.50, 1532.75, 1533.0, 1533.25, 1533.50, 1533.75, and 1534.

**1.1.4.2. VolumeArea**

Similarly, with this indicator you can also have your own volume profiles displayed. Here you can now determine the start and end time completely freely by clicking on your desired position. There are no restrictions as to where the calculation should start and end. In the upper right corner you have the setting options with which you can switch between the profile types (for a description of these, read more under VolumeSessionPro). With a click on the little red “+” under the profile settings, you can add a further volume profile to your chart; you do so by once again determining the start and end time by left-clicking. The settings and the display of the indicator are exactly equivalent to the VolumeSessionPro: via ProfileType you select which calculation method should be used; via ValueArea you determine the percentage for what portion of the volume area should be colored with the highest activity.

![](https://docs.agenatrader.com/~gitbook/image?url=https%3A%2F%2F2805764894-files.gitbook.io%2F%7E%2Ffiles%2Fv0%2Fb%2Fgitbook-legacy-files%2Fo%2Fassets%252F-MKZSsJBtSP9L4sqIe_q%252F-MQuyUOvSDf10S_TO9Zp%252F-MQw740SyuhZ0fn8Kebs%252F3.png%3Falt%3Dmedia%26token%3Dea8dc600-2371-4602-aff3-2b7a8d0f8b81\&width=768\&dpr=4\&quality=100\&sign=a43231fe\&sv=1)

Figure 2-VolumeArea

The most effective way of working with the VolumeArea is to place this indicator in the action bar and assign it a hot key. In this way, if necessary, the indicator can be quickly called up and you can specify the desired volume area.

**1.1.4.3. KlingerVolumeOscillator**

The KlingerVolumeOscillator is a technical indicator that was developed by Stephen Klinger in order to determine long-term trends of the money flow. At the same time, the indicator is sensitive enough to also identify short-term fluctuations, thereby giving the trader the possibility to detect even short-term reversals in the market. The indicator compares the influent and effluent volume of an instrument with its price movements, and is outputted as an oscillator. A signal line (13-period moving average) is used for generating signals. Divergences in the KlingerVolumeOscillator in comparison to the price movement can also be used for entry and exit decisions. A bullish signal is formed when the KlingerVolumeOscillator start to rise while the price continues to fall; the opposite goes for a bearish signal.

![](https://docs.agenatrader.com/~gitbook/image?url=https%3A%2F%2F2805764894-files.gitbook.io%2F%7E%2Ffiles%2Fv0%2Fb%2Fgitbook-legacy-files%2Fo%2Fassets%252F-MKZSsJBtSP9L4sqIe_q%252F-MQuyUOvSDf10S_TO9Zp%252F-MQw7COyKli_2jHN6Oyl%252F4.png%3Falt%3Dmedia%26token%3D75c595bb-864d-4c7d-979d-bce8b44b5ac6\&width=768\&dpr=4\&quality=100\&sign=6579ea38\&sv=1)

Figure 3-KlingerVolumeOscillator

**1.1.4.4. VolumeKeltnerChannels**

The VolumeKeltnerChannels are a great tool to determine very high or very low volume in comparison to past periods. Beginning with an upper Keltner channel line calculated with volume data, this line is shifted ever further upwards or downwards using special multipliers. Volume that is higher than the highest Keltner channel line can be interpreted as extremely high volume that shows that huge numbers of trades have been carried out in the current price period and that an unusually large number of traders are buying or selling positions at the current price level.

![](https://docs.agenatrader.com/~gitbook/image?url=https%3A%2F%2F2805764894-files.gitbook.io%2F%7E%2Ffiles%2Fv0%2Fb%2Fgitbook-legacy-files%2Fo%2Fassets%252F-MKZSsJBtSP9L4sqIe_q%252F-MQuyUOvSDf10S_TO9Zp%252F-MQw7NBFvWKk6zd19VaC%252F5.png%3Falt%3Dmedia%26token%3D2b3eadc7-b0d5-4e77-8461-da216a78f857\&width=768\&dpr=4\&quality=100\&sign=94e5925e\&sv=1)

Figure 4-VolumeKeltnerChannels

On the other hand, a volume smaller than the lowest Keltner channel line is an indication of particularly low activity during the current price period, and only unusually few traders are interested in buying or selling positions at the predominant price.

**1.1.4.5. VolumeUDR**

The VolumeUpDownRatio is the relationship between UpVolume and DownVolume, displayed as an oscillator. Volume is classified as UpVolume when the current close of the price candle is located above the close of the prior candle; the opposite applies for DownVolume. Values above 80 are to be graded as a bearish signal; values under 20 as a bullish signal. Besides this, a moving average can be shown, which can serve as an additional signal generator.

* Using **“DrawCandleOutline”**, you can have the border of your candles colored accordingly when bullish/bearish extreme values occur.
* **PriceWeightChange** regulates whether you would like to have the weighted change of the market price flow into the calculation of the indicator

![](https://docs.agenatrader.com/~gitbook/image?url=https%3A%2F%2F2805764894-files.gitbook.io%2F%7E%2Ffiles%2Fv0%2Fb%2Fgitbook-legacy-files%2Fo%2Fassets%252F-MKZSsJBtSP9L4sqIe_q%252F-MQuyUOvSDf10S_TO9Zp%252F-MQw7SigQKq-O1rvghDM%252F6.png%3Falt%3Dmedia%26token%3D32d8c4b3-1917-4f0f-96c2-808c3acd2b68\&width=768\&dpr=4\&quality=100\&sign=f6ed8154\&sv=1)

Figure 5-VolumeUDR

**1.1.4.6. VolumeTickSpeed**

**ATTENTION!** You can only use this indicator in the tick chart! The indicator measures the number of ticks that are traded during a number of seconds defined by the user. You can set the number of seconds under the parameter “Period”. A high tick speed can, therefore, be equated with high trading intensity, which can in turn often be observed at turning points in the market. With the parameter “LimitValue”, you can specify from which number of ticks during the selected period the background should be colored in order to display extreme values.

![](https://docs.agenatrader.com/~gitbook/image?url=https%3A%2F%2F2805764894-files.gitbook.io%2F%7E%2Ffiles%2Fv0%2Fb%2Fgitbook-legacy-files%2Fo%2Fassets%252F-MKZSsJBtSP9L4sqIe_q%252F-MQuyUOvSDf10S_TO9Zp%252F-MQw7z36_OyVHUUZ7xaI%252F7.png%3Falt%3Dmedia%26token%3Dc3b3619f-829f-4050-8004-901b40d52ff6\&width=768\&dpr=4\&quality=100\&sign=c3404224\&sv=1)

Figure 6-VolumeTickSpeed

**1.1.4.7. VolumeZoneOscillator**

The VolumeZoneOscillator divides the volume activity into UpVolume and DownVolume, similarly to the VolumeUDR. Volume is ranked as UpVolume when the current closing price is located above the prior closing price; vice versa for DownVolume. The oscillator calculated hereby outputs relative percentage values. An instrument is in a positive trend when the VolumeZoneOscillator rises above a level of 5% and vice versa in a negative trend, when it falls below -5%. Values above 40% show overbought situations, while values above 60% are an indication for an extreme exaggeration in the market. On the other hand, values smaller than -40% are deemed oversold and values smaller than -60% to be classified as enormously oversold and exaggerated.

![](https://docs.agenatrader.com/~gitbook/image?url=https%3A%2F%2F2805764894-files.gitbook.io%2F%7E%2Ffiles%2Fv0%2Fb%2Fgitbook-legacy-files%2Fo%2Fassets%252F-MKZSsJBtSP9L4sqIe_q%252F-MQuyUOvSDf10S_TO9Zp%252F-MQw83jxTUc14jD7vKEx%252F8.png%3Falt%3Dmedia%26token%3Db55f33ee-e1ed-4618-aea5-f687fa55ac34\&width=768\&dpr=4\&quality=100\&sign=1b7f7b2b\&sv=1)

Figure 7-Volume Zone Oscillator

**1.1.4.8. VolumeRiseFall**

The VolumeRiseFall indicator is a normal volume display as volume bars, with, however, a different coloring than normal. A volume bar is drawn in green when the volume of this bar is higher than the volume of the previous bar, meaning that rising volume is present.

A volume bar is drawn in gray when the volume of this bar is lower than the volume of the previous bar, thereby showing falling volume.

![](https://docs.agenatrader.com/~gitbook/image?url=https%3A%2F%2F2805764894-files.gitbook.io%2F%7E%2Ffiles%2Fv0%2Fb%2Fgitbook-legacy-files%2Fo%2Fassets%252F-MKZSsJBtSP9L4sqIe_q%252F-MQuyUOvSDf10S_TO9Zp%252F-MQw88lKmTQ7aqy5z6dh%252F9.png%3Falt%3Dmedia%26token%3D84c8631c-4191-4652-b00f-68b79b88b184\&width=768\&dpr=4\&quality=100\&sign=4e1b57b1\&sv=1)

Figure 8-VolumeRiseFall

**1.1.4.9. WyckoffWave**

The WyckoffWave indicator adds the volume for each following bar until a price wave is over / finished. You can set the sensitivity of the price waves. When the volume of a wave rises to particularly high values, is it very often because a turning point in the chart has been reached. When the volume bars are colored red, we are dealing with a short wave; green volume bars indicate a long wave. Using the parameter **“MedianPeriod”** you can select how sensitively the indicator should determine the individual price waves. The smaller the value, the larger the price waves that the indicator calculates. The parameter Poles serves to fine-tune the display of the volume waves; you can select a parameter between 1-4. Changing this value usually causes only imperceptible changes.

![](https://docs.agenatrader.com/~gitbook/image?url=https%3A%2F%2F2805764894-files.gitbook.io%2F%7E%2Ffiles%2Fv0%2Fb%2Fgitbook-legacy-files%2Fo%2Fassets%252F-MKZSsJBtSP9L4sqIe_q%252F-MQuyUOvSDf10S_TO9Zp%252F-MQw8EjLRait6hNIHa6u%252F10.png%3Falt%3Dmedia%26token%3Dbe6fc60a-0018-4aea-90ad-a3439b6b4f26\&width=768\&dpr=4\&quality=100\&sign=d69ef41d\&sv=1)

Figure 9-WaveVolume

**1.1.4.10. VolumeGraph**

This indicator contains a normal volume histogram, but here, the coloring takes place based on price trends. The VolumeGraph determines short- or long-term price trends; you can set the sensitivity for this using the parameter **“SlopeLength”**. A high value delivers long-term trends; low values represent short-term price trends. Using the setting **“Exponential**”, you can select whether the calculation for trend determination should be based on an exponential (=True) or linear (=False) algorithm. This is about the fine-tuning, and no large changes should be expected with this parameter. In addition, the volume histogram also contains a moving average, for which you can enter the period using the parameter **“AvgLength**”.

![](https://docs.agenatrader.com/~gitbook/image?url=https%3A%2F%2F2805764894-files.gitbook.io%2F%7E%2Ffiles%2Fv0%2Fb%2Fgitbook-legacy-files%2Fo%2Fassets%252F-MKZSsJBtSP9L4sqIe_q%252F-MQuyUOvSDf10S_TO9Zp%252F-MQw9lkTLWTesF7r3Kxo%252F11.png%3Falt%3Dmedia%26token%3Dddb660a0-a57f-422a-b9da-054d276fa0e5\&width=768\&dpr=4\&quality=100\&sign=dba23868\&sv=1)

Figure 10-VolumeGraph

**1.1.4.11. VolumeSentimentLong**

This indicator detects bullish volume activity based on the analysis of the volume of a period, the price span of a bar and the close of the bar (=VolumeSpreadAnalysis). It screens for 3 signals (listed are the sub-criteria that must be met for the respective signal):

* **SellingClimax** (dark green)

6.11..1. Lowest low since 50 periods 6.11..2. Bar with large range 6.11..3. Extremely high volume

* **DemandComingIn** (lime green)

6.11..1. UpBar (current close larger than previous close) 6.11..2. Previous Bar: DownBar (close smaller than previous close) 6.11..3. Previous Bar: Bar with large range 6.11..4. Previous Bar: Above-average high volume

* **BagHolding** (light green)

6.11..1. Lowest low since 50 periods 6.11..2. DownBar 6.11..3. Bar with small range 6.11..4. Above-average high volume 6.11..5. Close larger than or equal to the middle of the bar

The VolumeSentiments provide the foundation for the calculation of the volume condition; see point 5. When a bullish VolumeSentiment occurs, the bar is colored in the respective color of the signal; you can change this color in the parameter settings.

![](https://docs.agenatrader.com/~gitbook/image?url=https%3A%2F%2F2805764894-files.gitbook.io%2F%7E%2Ffiles%2Fv0%2Fb%2Fgitbook-legacy-files%2Fo%2Fassets%252F-MKZSsJBtSP9L4sqIe_q%252F-MQuyUOvSDf10S_TO9Zp%252F-MQw9sPCmSR91g8BdgtF%252F12.png%3Falt%3Dmedia%26token%3Dab459df0-b146-48a0-900c-8516f55bd22d\&width=768\&dpr=4\&quality=100\&sign=c50772d4\&sv=1)

Figure 11-VolumeSentimentsLong

**1.1.4.12. VolumeSentimentShort**

This indicator is the counterpart to the VolumeSentimentLong and detects bearish volume activity based on the analysis of the volume of a period, the price span of a bar and the close of the bar (=VolumeSpreadAnalysis). It screens for 3 signals (listed are the sub-criteria that must be met for the respective signal):

* **BuyingClimax** (dark red)

6.12..1. Highest high since 50 periods 6.12..2. Bar with large range 6.12..3. Extremely high volume

* **SupplyComingIn** (red)

6.12..1. DownBar 6.12..2. Previous Bar: UpBar 6.12..3. Previous Bar: Bar with large range 6.12..4.Previous Bar: Above-average high volume

* **EndOfRisingMarket** (coral)

6.12..1. Highest high since 50 periods 6.12..2. UpBar 6.12..3. Bar with small range 6.12..4.Above-average high volume 6.12..5.Close smaller than or equal the middle of the bar

The VolumeSentiments provide the foundation for the calculation of the volume conditions; see point 5. When a bearish VolumeSentiment occurs, the bar is colored in the respective color of the signal; you can change this color in the parameter settings.

![](https://docs.agenatrader.com/~gitbook/image?url=https%3A%2F%2F2805764894-files.gitbook.io%2F%7E%2Ffiles%2Fv0%2Fb%2Fgitbook-legacy-files%2Fo%2Fassets%252F-MKZSsJBtSP9L4sqIe_q%252F-MQuyUOvSDf10S_TO9Zp%252F-MQwA6iTvdIMACGzHxTG%252F13.png%3Falt%3Dmedia%26token%3D72d57648-1ad2-407f-9c6e-0c11c83aa2ad\&width=768\&dpr=4\&quality=100\&sign=d050a8c4\&sv=1)

Figure 12-VolumeSentimentsShort

#### 1.1.5. DESCRIPTION OF THE CONDITIONS <a href="#id-1.1.5.-description-of-the-conditions" id="id-1.1.5.-description-of-the-conditions"></a>

Volume signals should generally not be traded with market orders immediately, but instead one should wait for a confirmation of the signal with stop orders at the high or low of the signal candle. You should avoid trading long signals in downwards trend if at all possible; conversely, we advise you not to trade short signals in upwards trends. The basis for the long signals are the VolumeSentimentsLong; in order for a long signal to occur, a VolumeSentimentLong must have occurred during the last 50 bars; the opposite is true for short signals with the VolumeSentimentsShort.

The signals are based on the VolumeSpread analysis; the principle of this theory states that strength in the market becomes visible in DownBars (a bar that closes lower than the previous bar), and that weakness can be recognized in UpBars (a bar that closes higher than the previous bar). For this, certain conditions regarding the volume, the range of the bar and the position of the closing price must be fulfilled. The conditions can, in general, be applies in all timeframes, but application only makes sense for values for which there is sufficient volume information. For Forex values, therefore, the conditions are not applicable.

**1.1.5.1. Long\_NoSupply**

* UpBar
* Volume larger than volume of the previous bar
* Previous Bar: DownBar
* Previous Bar: Small range
* Previous Bar: Below-average volume
* Previous Bar: Volume smaller than the two previous periods

A NoDemand bar has the largest hit probability when it is in the range of a previous long sentiment with very high volume. The market will very likely not be in a position to break through the VolumeSentiment signal in the opposite direction with the current low volume. NoDemand shows that there is currently no interest in lower prices.

**1.1.5.2. Long\_StoppingVolume**

* UpBar
* Very low volume
* Previous Bar: DownBar
* Previous Bar: Bar with small range
* Previous Bar: Very high volume

Stopping Volume means that after a bar with high volume, the direction cannot be continued. If the high volume were to consist exclusively of sell orders, then the next period would be unable to close higher i.e. the sell direction would have to continue. There would, therefore, have to have been many buy orders included in the high volume, meaning that there is increasing interest in higher prices or at least no more interest in lower prices.

**1.1.5.3. Long\_TestBar**

* DownBar
* Bar with small range
* Very small volume
* Volume smaller than that of the previous period

Professional traders will only open large buy positions in a market when they can be relatively sure that the market is not yet full of sellers. One way of checking this is to drive the market slightly downwards, which is supposed to cause the potential sellers to react to the small short movements. If, despite a sinking of the price, only very low volume with very low price range can be observed, this is an indication that there is no strong pressure to sell weighing on the market – according to this, the test has had a positive outcome and the professional traders are now ready to open their long positions. With this signal, too, it is very clear to see that the future strength of a market can be observed in DownBars.

**1.1.5.4. Long\_TwoBarReversal**

* UpBar
* Range of the bar average to high
* Close of the bar near to the high
* Above-average high volume of the current or previous period
* Close above the high of the previous period
* Previous Bar: DownBar
* Previous Bar: average to high range

A TwoBarReversal optimally occurs at support zones. One of the two bars of the TwoBarReversal has to exhibit above-average high volume, which can be interpreted as high activity of the market participants at the current price level. The second bar changes the market direction, thereby clearly insinuating that the market participants currently have no interest in lower prices.

**1.1.5.5. Short\_UpThrust**

* Highest high since 50 periods
* UpBar
* Close near to the low
* Average or large range of the bar
* Very high volume

Commonly, markets react negatively when a new high with very high volume is reached; it is precisely these situations that are searched for here.

**Attention!** If the market continues to climb further after an upthrust, this is a clear long signal.

**1.1.5.6. Short\_HiddenUpthrust**

Same logic as the upthrust; however, here, the new high is achieved with a DownBar. For details, see point 5.5.

**1.1.5.7. Short\_NoDemand**

* DownBar
* Volume larger than volume of the previous bar
* Previous Bar: UpBar
* Previous Bar: Small range
* Previous Bar: Below-average volume
* Previous Bar: Volume smaller than for the two previous periods

A NoDemand bar has the largest hit probability when it is in the range of a previous short sentiment with very high volume. The market will very likely not be in a position to break through the VolumeSentiment signal in the opposite direction with the current low volume. NoDemand shows that there is currently no interest in higher prices.

**1.1.5.8. Short\_TwoBarReversal**

* DownBar
* Range of the bar average to high
* Close of the bar near to the low
* Above-average high volume of the current of previous period
* Close below the low of the previous period
* Previous Bar: UpBar
* Previous Bar: Average to high range

A TwoBarReversal optimally occurs at resistance zones. One of the two bars of the TwoBarReversal has to exhibit above-average high volume, which can be interpreted as high activity of the market participants at the current price level. The second bar changes the market direction, thereby clearly

## MT on live signal

#### BRIEF DESCRIPTION OF THE ON PACKAGE <a href="#brief-description-of-the-on-package" id="brief-description-of-the-on-package"></a>

**Warning!** Dear customers, before you start working with the ON workspace and indicators, we ask that you read these instructions thoroughly before modifying any settings. The ON-Addon is an advanced tool that contains many settings and parameters – incorrect settings made due to “curiosity” may lead to undesired results. **IMPORTANT!** The ON-indicators in general operates with all kinds of charts, the relevant upper trend size = Grosswetterlage (GWL) needs a time-based chart. The ON-Addon is based on real-time, not on closing prices. In each timeframe, the package displays the relevant trend in the signal size as well its upper timeframe. Different trend sizes are generated with a change of the time frame.

You are free to carry out any and all changes; however, we recommend that you only touch those setting which you are already familiar with. Please ensure to use identical values at “Bars required" in the Chart and in ListChartGroups.

#### INSTRUCTIONS FOR PACKAGE-INSTALLATION <a href="#instructions-for-package-installation" id="instructions-for-package-installation"></a>

* After the purchase, you receive the MTOnLiveSignal.atpack by email: this file is the actual package including all components contained within. **ATTENTION!** If you are using InternetExplorer or MicrosoftEdge, the browser automatically converts the atpack file to a .zip-file. After the download you therefore have to rename the MTOnLiveSignal.zip to MTOnLiveSignal.atpack!
* Save the .atpack file on your hard drive.
* We now still need to enter our license for the package in AgenaTrader. For this, click on the symbol with the question mark, select About -> Entering Activation Key, navigate to “MTOnLiveSignal” and enter your activation key that you have received by email. Click on “Activate”. Once you receive the notice that your license has been successfully activated, close this window.
* Now open Tools -> Packages -> Import Package, read the following backup information and if you have already carried out a backup, click on OK. In the next window, navigate to the storage location of the MTOnLiveSignal.atpack file, click on it and select “Open”. Confirm the Agena restart request with OK so that your AgenaTrader can be restarted.
* After the restart, the first step is to establish a connection to your data feed.
* As soon as you have established a connection to your data feed, select Main -> Workspace -> ON – markttechniktrading.de to load the ON workspace. As soon as all charts are completely loaded, the ON-Package is fully ready to go.

#### CONTENT MT ON LIVE SIGNAL (ON) - ADDON <a href="#content-mt-on-live-signal-on-addon" id="content-mt-on-live-signal-on-addon"></a>

The Market Technical Trading illustrates the current supply-/demand-situation in the form of trends. At this it is critical to consider two associated trend sizes: The signal size, in which you are trading, and the GWL, the relevant upper trend size. For that reason, the ON-Addon always considers the situation in the signal size as well as in the GWL. The assignment of the appropriate trend sizes is not governed by an individual perception, but A) a specialized, professional derivation and B ) by the definition of Spot & Future markets and the connection between them. Ultimately the Futures Market is the hour of birth of the Market Technical Trading.

Since the ON-Addon only needs one time frame to display the trend in both the signal size & the GWL, using AgenaTrader in combination with the new ON-Addon is an extremely efficient way to work and to carry out your analyses. The package masters trading the trend as well as movements, including appropriate stop management (cf. “PREDEFINED SETUPS”).

To bring your attention to particularly interesting constellations and possible entries directly in the chart, the ON-Addon can use different flash techniques. With that you stay on top of even very dynamical market situations and lose no chances.

The package is also capable of recognizing and displaying opposite signals in the signal size as well the GWL – you always stay on top of present market events, independent of their complexity or constellations. Another specialty is the resumption of temporary broken trends in case of their renewed validity. That ensures a so far unmatched closeness to the market that won’t let you miss any trend.

The traffic lights concept of the TradingZone offers a further optical aid in the signal size and GWL. In its overall height, it represents the last correction zone of a valid trend and additionally symbolizes via its color gradient from Red to Green the actual correction-depth/-height. The used traffic lights concept simplifies the orientation during the trading of corrections as the attractivity of any given correction is visible at a glance.

To make trading and analyses using the ON-data as simple and intuitive as possible, the ON-Addon contains the following components:

* ON-Workspace for an effective working- and trading-style
* ON-Indikatoren for the Market Technical Trading
  * ON123Pro
  * ONMarketPhasesPro
  * InsideBarsON
* ON-Conditons for easier execution of your trading
  * Screening
    * ONGwlPhase
    * ONSigPremium
    * ONSigSecond
  * Trading
    * ONDeepReversal
    * ONDeep
    * ONReversal
    * ONEarlyBird
  * Additional-Condition: ONReversalBar
* Predefined Setups for semiautomatic ON-Trading

#### 1.1.1. ON–WORKSPACE <a href="#id-1.1.1.-on-workspace" id="id-1.1.1.-on-workspace"></a>

![](https://docs.agenatrader.com/~gitbook/image?url=https%3A%2F%2F2805764894-files.gitbook.io%2F%7E%2Ffiles%2Fv0%2Fb%2Fgitbook-legacy-files%2Fo%2Fassets%252F-MKZSsJBtSP9L4sqIe_q%252F-MQwOVldyXwhy8nVibxD%252F-MQwOpWRry8pemyvAXb3%252FFigure%25201%2520-%2520ON-Workspace.png%3Falt%3Dmedia%26token%3D99ec3f09-7c71-41d4-b804-026c0e6b6f36\&width=768\&dpr=4\&quality=100\&sign=af3e5f3f\&sv=1)

*Figure 1 - ON-Workspace*

The following content is predefined in the ON-Workspace:

1.1 **Tabs**: Appropriate to a proper work style the workspace is segmented in SCREENER- and Watchlist-Tabs. Due to the used small time frames and the consequent high trading-/signal-frequency the Intraday-Tab is not further segmented in Screener & Watchlist. Within the SCREENERS instruments are scanned for valid trends in signal size and GWL. Instruments that raise your attention and additionally are marked with two identical colored signals (Green=Long or Red=Short) can be added to corresponding watchlists by a mouse click on the respective Actionbar-Button. The successful implementation is displayed by a red coloring of the corresponding Watchlist-Button.

1.2 **Instrument lists** Intraday, 10min-Watchlist, Stunde-Watchlist, Tag-Watchlist, ON SCREENER STUNDE 10min, ON SCREENER TAG Stunde, ON SCREENER WOCHE Tag including indicators. You can pull up these preset indicators to carry out analyses for all asset classes and markets.

The following components are available in the ON GWL+Sig-template (the further Template„ON GWL“ is not including the signal size):

* Trading Chart
  * GWL+SIG: Display of signal size and GWL
  * PHASE: Display of trend direction, -phases & depth of correction
* Relevant upper chart
  * SIG: Display of signal size
* Actionbar
  * Tag-Watchlist
  * Stunde-Watchlist
  * 10min-Watchlist
  * Buy/Sell onmove: Initial- and HardTrail-Stop = ONBewegungsstop
  * Buy/Sell ONP3: Initial- and HardTrail-Stop = ONP3Stop
  * Buy/Sell ONP3 (Fake): s. a.\*
  * Buy/Sell ONP3 (Fake & Close / Tolerance): s. a.\*
  * Buy/Sell ONP3 (Fake & Tolerance): s. a.\*
  * GWL+SIG+Boxes
  * GWL+SIG
  * GWL
  * SIG
  * PHASE
  * InsideBarsON
    * Following Options only for User of the Add-In “Professional Unsharpness”
  * Fake - GWL+SIG+Faketrends
  * Close+Tol - GWL+SIG+Faketrends+Min(Close v Tolerance)
  * Tol - GWL+SIG+Faketrends+Tolerance
  * MP-Fake – PHASES+Faketrends
  * MP-Close+Tol – PHASES+Faketrends+Min(Close v Tolerance)
  * MP-Tol – PHASES+Faketrends+Tolerance

1.3 **Scanner-Templates** with useful information

Available templates are divided in three groups:

* SCREENER
  * WOCHE Tag
  * TAG Stunde
  * STUNDE 10min
* Watchlist
  * Tag
  * Stunde
  * 10min
* Intraday

#### 1.1.2. ON-INDICATORS <a href="#id-1.1.2.-on-indicators" id="id-1.1.2.-on-indicators"></a>

2.1 **ON123Pro** This indicator is the core of the ON-Addon, that can display the high performing trend detection of the signal size as well the GWL. Herein you find the specialty of the ON-Addon – you only need one timeframe to automatically display both corresponding trend sizes of signal size and GWL. That is saving PC-resources, accelerates screenings and reduces sources of error – as e. g. the skipping of trend sizes. Please pay attention to the therefore firmly mapped assignment of signal sizes and GWL in the ON-Addon, compliant with the classic four trend sizes of Market Technical Trading:

| Trend size | Signal size  | GWL        |
| ---------- | ------------ | ---------- |
| Smallest   | < 5 Minutes  | 10 Minutes |
| Small      | >= 5 Minutes | Hour       |
| Medium     | Hour         | Day        |
| Big        | Day          | Week       |

The following options are available for the ON123Pro:

* **Show 123s**: Display P1-P3
* **ShowTradingZone**: Display TradingZone
* **DrawLines**: Display trend lines
* **ShowToleranceZone\***:Display ToleranceZone
* **ShowFakeTrends\***: Display & Consideration of Faketrends
* **UpTrend color**: Color trend lines uptrend
* **DownTrend color**: Color trend lines downtrend
* **NoTrend color**: Color trend lines no trend
* **History Color Uptrend**: Color historical trend lines uptrend
* **History Color Downtrend**: Color historical trend lines downtrend
* **History Color NoTrend**: Color historical trend lines no trend
* **History Color Faketrends\***: Color historical trend lines Faketrends
* **Text color**: Color P1-P3
* **Schriftgroesse**: Font size P1-P3
* **Linienstaerke**: Thickness trend lines
* **Linienart**: Style trend lines
* **Lineart Faketrends\***: Style trend lines Faketrends
* **BlinkType**: Choice of BlinkType during interesting chart constellations and possible entries directly in the chart
* **TradingZoneTransparency**: Transparency TradingZone
* **ToleranceZoneTransparency\***: Transparency ToleranceZone
* **HistoryMode**: Choice of displaying invalid historical trend lines
* **GwlBoxes** (only @Grosswetterlage)
  * **ShowGwlBars**: Display GWL-timeframe & -direction in the form of boxes
  * **UpColor**: Color during uptrend
  * **DownColor**: Color during downtrend
  * **HistoryColor**: Color during invalid historical trends
  * **Transparency**: Transparency boxes
* **GwlPeriode** (only @Grosswetterlage and solely for visualization within charts)
  * **Day**: Assignment of aGWL
  * **Hour**: Assignment of aGWL
  * **>=5 Minutes**: Assignment of a GWL
  * **<5 Minutes**: Assignment of a GWL
  * **Seconds**: Assignment of aGWL
  * **Ticks**: Assignment of a GWL

The following parameters are available for the ON123Pro:

* **OutputTimeFrame**: Choice of Trendsize
* *Placeholder UNSCHÄRFE SIG:*
* **Trendbreak on Close\***: Activation Unsharpness: Trendbreak only @Close
* **Faketrend Filter\***: Aktivation Unsharpness: Faketrends
* **Tolerance Factor\***: Aktivation Unsharpness: Tolerance (0-2x)
* **Trigger all selected filter\***: Activation Unsharpness: AND correlation Unsharpnessn
* *Placeholder UNSCHÄRFE GWL:*
* **Trendbreak on Close\***: Aktiviation Unsharpness: Trendbreak only @Close
* **Faketrend Filter\***: AktivationUnsharpness: Faketrends
* **Tolerance Factor**\*: Aktiviation Unsharpness: Tolerance (0-2x)
* **Trigger all selected filter\***: Activation Unsharpness: AND correlation Unsharpnessn

![](https://docs.agenatrader.com/~gitbook/image?url=https%3A%2F%2F2805764894-files.gitbook.io%2F%7E%2Ffiles%2Fv0%2Fb%2Fgitbook-legacy-files%2Fo%2Fassets%252F-MKZSsJBtSP9L4sqIe_q%252F-MQwOVldyXwhy8nVibxD%252F-MQwOupq6_hyEswTE_Xd%252FFigure%25202%2520%25E2%2580%2593%2520ON123Pro%2520Indicator.png%3Falt%3Dmedia%26token%3De1d8c2c4-fc41-475a-9f86-bd42894c5812\&width=768\&dpr=4\&quality=100\&sign=da0f8132\&sv=1)

*Figure 2 – ON123Pro Indicator*

2.2 **ONMarketPhasesPro**

This indicator displays the current trend directions & -phases as well as the respective depth of correction of signal size and GWL, including graphical illustration of the phases.

The following parameters are available for the ONMarketPhasesPro

* **OutputTimeFrame**: Choice of Trendsize
* *Placeholder UNSCHÄRFE SIG:*
* **Trendbreak on Close\***: Aktiviation Unsharpness: Trendbreak only @Close
* **Faketrend Filter\***: Aktivation Unsharpness: Faketrends
* **Tolerance Factor\***: Aktivation Unsharpness: Tolerance (0-2x)
* **Trigger all selected filter\***: Aktivation Unsharpness: AND correlation Unsharp.
* *Placeholder UNSCHÄRFE GWL:*
* **Trendbreak on Close\***: Aktiviation Unsharpness: Trendbreak only @Close
* **Faketrend Filter\***: AktivationUnsharpness: Faketrends
* **Tolerance Factor\***: Aktiviation Unsharpness: Tolerance (0-2x)
* **Trigger all selected filter\***: Aktivation Unsharpness: AND correlation Unsharpness

Explanation of the different Phases of the ON123MarketPhasesPro:

* Phase 1: Undefined Trend
* Phase 2: Arising Trend
* Phase 3: Trend beyond P2
* Phase 4: Trend in Correction
* Phase 5: Trend in Correction, but in P2-Direction
  * 5.0: No deep Correction
  * 5.1: Deep Correction
  * 5.2: Prom Queen (Trends in GWL & Sig): No deep Correction
  * 5.3: Prom Queen (Trends in GWL & Sig): Deep Correction
* Phase 6: Trend in Correction, but in P2-Direction & just before P2-Breakthrough
* Phase 7: Trend beyond P2 (min. 2 P3s)
* Phase 8: Broken Trend
* Phase 9: Trendreversal

![](https://docs.agenatrader.com/~gitbook/image?url=https%3A%2F%2F2805764894-files.gitbook.io%2F%7E%2Ffiles%2Fv0%2Fb%2Fgitbook-legacy-files%2Fo%2Fassets%252F-MKZSsJBtSP9L4sqIe_q%252F-MQwOVldyXwhy8nVibxD%252F-MQwP-rIIgRlqBTIFH_F%252FFigure%25203%2520%25E2%2580%2593%2520ONMarketPhasesPro%2520Indicator.png%3Falt%3Dmedia%26token%3Dd744100e-d810-4a0e-92e1-9e8ed72cf3d3\&width=768\&dpr=4\&quality=100\&sign=d2efb520\&sv=1)

*Figure 3 – ONMarketPhasesPro Indicator*

2.3 **InsideBarsON** This indicator visualizes present inside bars.

The following parameters are available for the InsideBarsON:

* Parameters
  * Tolerance unit: Choice of tolerance unit
  * Tolerance value: Choice of tolerance value
* Visual Parameters
  * Color: Choice of background color of inside bars
  * Opacity: Choice of opacity of background color

![](https://docs.agenatrader.com/~gitbook/image?url=https%3A%2F%2F2805764894-files.gitbook.io%2F%7E%2Ffiles%2Fv0%2Fb%2Fgitbook-legacy-files%2Fo%2Fassets%252F-MKZSsJBtSP9L4sqIe_q%252F-MQwOVldyXwhy8nVibxD%252F-MQwP8ud5Cn9WeTlkqRS%252FFigure%25204%2520%25E2%2580%2593InsideBarsON%2520Indicator.png%3Falt%3Dmedia%26token%3D1372b95a-33be-4781-8fc5-c738a60c1196\&width=768\&dpr=4\&quality=100\&sign=be3b48c4\&sv=1)

*Figure 4 –InsideBarsON Indicator*

#### 1.1.3. ON-CONDITIONS <a href="#id-1.1.3.-on-conditions" id="id-1.1.3.-on-conditions"></a>

Scripted Conditions include diverse requirements, which are validated by the PC. Please refer to the recorded descriptions within AgenaTrader for all factored in qualifications per condition.

3.1 **Screening-Conditions** These conditions serve the market screening process and illustrate at a glance present interesting market situations, which are represented by parallel valid trends in signal size as well GWL (cf. ON-Workspace):

* ONGwlPhase
* ONSigPremium
* ONSigSecond

3.2 **Trading-Conditions** These conditions are used in the Trade-column and signalize definite entries, which are displayed as proposal directly in the chart by a mouse click:

* ONDeepReversal: Upper Trend & Signal Trend & Deep Correction & Reversal Bar
* ONDeep: Upper Trend & Signal Trend & Deep Correction
* ONReversal: Upper Trend & Signal Trend & Reversal Bar
* ONEarlyBird: Signal occurs if a P2-breach is imminent

Following conditions do not represent explicit entry-signals, but ReversalBars, which serve within the aforementioned Reversal-conditions:

* ONReversalBar

#### 1.1.4. PREDEFINED SETUPS <a href="#id-1.1.4.-predefined-setups" id="id-1.1.4.-predefined-setups"></a>

Setups for the semiautomatic trading are included, which enable you to conduct a proper Market Technical Trading by just one mouse klick. In case of an existing spread that is automatically considered. You can deactivate that functionality or switch to “bid”, respectively “ask” – depending on your data feed. The stop position is changed in real-time, hence on a tick by tick basis.

4.1 **Trend trading**: The Trading-Conditions (except for the Reversal-condition), as well as the mapped ONP3-Buttons within the Actionbar, use the corresponding P3 as Trailing-Stop with the following configuration:

* InitialStop: ONP3Stop\_Spread
* HardStop: ONP3Stop\_Spread
* SoftStop: InitialStopOnly
* Targets: NoTarget

4.2 **Movement trading**: The mapped onmove-Buttons within the Actionbar as well as the Reversal-condition use the InsideBars as Trailing-Stop with the following configuration:

* InitialStop: ONBewegungsstop\_Spread
* HardStop: ONBewegungsstop\_Spread (InitialStopOnly)
* SoftStop: InitialStopOnly (ONBewegungsstop\_Spread)
* Targets: NoTarget


# Using AddOn- and package-indicators in scripted components

When you for example have purchased an AddOn like COT-, Volume-, Rimes,…. you might want to script your individual extensions for that.

Due to technical reasons it is not possible to address those indicators directly e.g. in Scripted Indicators, Strategies or Conditions via Intellisense, as it is possible with the directly integrated system indicators.

But you can use the SignalBuilder to set the correct signature of the respective AddOn indicators in your scripted components.

Therefore please do the following:

1\) Create a pseudo-condition in SignalBuilder with exact those settings as you want to use the respective component in your scripting code and save this condition:

<figure><img src="https://docs.agenatrader.com/~gitbook/image?url=https%3A%2F%2F2805764894-files.gitbook.io%2F%7E%2Ffiles%2Fv0%2Fb%2Fgitbook-legacy-files%2Fo%2Fassets%252F-MKZSsJBtSP9L4sqIe_q%252F-MQuyUOvSDf10S_TO9Zp%252F-MQw372sI7WTG7bQE5_Y%252FPic1.png%3Falt%3Dmedia%26token%3De45b3661-fe8e-4920-90f6-211de7719b3e&#x26;width=768&#x26;dpr=4&#x26;quality=100&#x26;sign=b8ecc37e&#x26;sv=1" alt=""><figcaption></figcaption></figure>

2\) Switch to your usercode file in the Scanns-folder and open the condition with the notepad-editor:

<figure><img src="https://docs.agenatrader.com/~gitbook/image?url=https%3A%2F%2F2805764894-files.gitbook.io%2F%7E%2Ffiles%2Fv0%2Fb%2Fgitbook-legacy-files%2Fo%2Fassets%252F-MKZSsJBtSP9L4sqIe_q%252F-MQuyUOvSDf10S_TO9Zp%252F-MQw3BCrB8GVggLdlPJB%252Fpic2.png%3Falt%3Dmedia%26token%3Ddcfa10de-bade-4273-8087-4f90d912a198&#x26;width=768&#x26;dpr=4&#x26;quality=100&#x26;sign=bb8e9297&#x26;sv=1" alt=""><figcaption></figcaption></figure>

3\) Select and copy the indicator signature from the condition:

<figure><img src="https://docs.agenatrader.com/~gitbook/image?url=https%3A%2F%2F2805764894-files.gitbook.io%2F%7E%2Ffiles%2Fv0%2Fb%2Fgitbook-legacy-files%2Fo%2Fassets%252F-MKZSsJBtSP9L4sqIe_q%252F-MQuyUOvSDf10S_TO9Zp%252F-MQw3I_G5ymXiN-WzObj%252Fpic3.png%3Falt%3Dmedia%26token%3D6211b4d1-9e8f-487a-8d8a-d9879f7c76d9&#x26;width=768&#x26;dpr=4&#x26;quality=100&#x26;sign=d2f05dd0&#x26;sv=1" alt=""><figcaption></figcaption></figure>

4\) Now add it to the scripting environment where you want to script your own component:

<figure><img src="https://docs.agenatrader.com/~gitbook/image?url=https%3A%2F%2F2805764894-files.gitbook.io%2F%7E%2Ffiles%2Fv0%2Fb%2Fgitbook-legacy-files%2Fo%2Fassets%252F-MKZSsJBtSP9L4sqIe_q%252F-MQuyUOvSDf10S_TO9Zp%252F-MQw3OdRd3F-f4mIJuj3%252Fpic4.png%3Falt%3Dmedia%26token%3D97743896-e8d2-4073-bd8b-fcc6a2000091&#x26;width=768&#x26;dpr=4&#x26;quality=100&#x26;sign=d2ac8338&#x26;sv=1" alt=""><figcaption></figcaption></figure>

<br>


# AgenaTrader Online-Hilfe

Um Ihr Wissen Schritt für Schritt aufzubauen, legen wir großen Wert darauf, möglichst detaillierte Informationen bereitzustellen. Hier werden Sie durch die umfangreiche Funktionalität von AgenaTrader geführt und finden umfassende Produktbeschreibungen.&#x20;

Zusätzlich stehen Ihnen verwandte Dokumentationsseiten zur Verfügung, die Sie bei Ihrem Lernprozess unterstützen. Der Abschnitt **Indikatoren** bietet eine vollständige Liste und Beschreibung aller AgenaTrader-Indikatoren. Im Bereich **AgenaScript** finden Sie fortgeschrittenes Wissen zur Skripterstellung, um Ihre Handelsstrategien zu erstellen und anzupassen. Abschließend liefert der Abschnitt **Release Notes** detaillierte Informationen zu allen Versionen und Änderungen, damit Sie stets über die neuesten Verbesserungen und Funktionen informiert bleiben.

<table data-view="cards"><thead><tr><th></th><th></th><th></th><th data-hidden data-card-cover data-type="files"></th><th data-hidden data-card-target data-type="content-ref"></th></tr></thead><tbody><tr><td><a href="https://indicators.agenatrader.com/"><strong>Indicators</strong></a></td><td><img src="/files/u9nvmccayYfIxbWNOuzu" alt="" data-size="original"></td><td></td><td><a href="/files/VoswoYLlAUCgokpsDOnM">/files/VoswoYLlAUCgokpsDOnM</a></td><td><a href="https://indicators.agenatrader.com/">https://indicators.agenatrader.com/</a></td></tr><tr><td><a href="https://script.agenatrader.com/"><strong>AgenaScript</strong></a></td><td><img src="/files/25Vm6Ut1WhV3MZNKsx7a" alt="" data-size="original"></td><td></td><td><a href="/files/ygQqflpnEMhW7BDH3qzC">/files/ygQqflpnEMhW7BDH3qzC</a></td><td></td></tr><tr><td><a href="https://release.agenatrader.com/"><strong>Release Notes</strong></a></td><td><img src="/files/Aw4xWifxbwHnrbvuVF6a" alt="" data-size="original"></td><td></td><td><a href="/files/lp6oVqsZlP90F5wCJuAF">/files/lp6oVqsZlP90F5wCJuAF</a></td><td><a href="https://release.agenatrader.com/v/german-2">https://release.agenatrader.com/v/german-2</a></td></tr></tbody></table>

​​​


# Übersicht

**AgenaTrader** ist eine leistungsstarke Handelsplattform, die sowohl für Einsteiger als auch für professionelle Trader entwickelt wurde. Sie bietet eine flexible und effiziente Handelsumgebung mit einer Vielzahl an Werkzeugen und Funktionen, die den Handelsprozess optimieren, fundierte Entscheidungen unterstützen und fortgeschrittene Strategien ermöglichen.

## Hauptfeatures:

### Signal Builder

Mit dem **Signal Builder** können Sie ohne Programmierkenntnisse ganz einfach Ihre Signale mittels Drag\&Drop erstellen.

Mit der richtigen Idee sind Ihrer Phantasie nahezu keine Grenzen gesetzt. Sie haben fast alle Möglichkeiten einer echten Programmierung, müssen aber keine Programmiersprache beherrschen.

### **Strategy Builder**

Der **Strategy Builder** hilft Ihnen die von Ihnen erstellten Signale mit Stop/Trailing bzw. TakeProfit Logiken auszustatten.

Basierend auf Ihren Setups bzw. Ihren Ideen übernimmt der Semi-Automatismus des AgenaTraders anschließend die Verwaltung Ihrer Trades.

### Riskmanagement <a href="#riskmanagement" id="riskmanagement"></a>

**Risiko- und Moneymanagement** stellt sicher, dass Sie Ihr Traderisiko bei jedem einzelnen Trade voll im Griff haben.

Die Positionsgröße wird automatisch berechnet, parallel dazu werden laufend Ihr Risiko, sowie die eingesetzten Mittel berücksichtigt.

### Backtesting <a href="#backtesting" id="backtesting"></a>

Unser **Backtesting-Tool** wurde in Zusammenarbeit mit der renommierten Uni Aachen entwickelt.

Das Tool hilft Ihnen Ihre Signale zu validieren. Eine umfangreiche Auswertung visualisiert wie erfolgreich Ihre Idee gewesen ist.

### Advanced Scanner <a href="#advanced-scanner" id="advanced-scanner"></a>

Der **Advanced-Scanner** ermöglicht es Ihnen hunderte von Werten in Echtzeit zu scannen.

Wenn eines Ihrer Signale auftritt, wird das entsprechende Symbol markiert. Mit einem Klick auf das Signal wird Ihnen die dazugehörige Strategie risikogemanagt ins Chart gelegt.

### Erweitertes Charting <a href="#erweitertes-charting" id="erweitertes-charting"></a>

Die ListChartGruppen und die TabchartGruppen werden Ihnen dabei helfen, sich ganz auf den Markt zu fokussieren.

Eine ListChartGruppe ist ein Chart Container, der einen Echtzeit-Scanner und einen Chartingbereich beinhaltet. Innerhalb dieser Chartingbereiche können Sie 1-4 Charts mit verschiedenen Zeiteinheiten auswählen, die mit der Scannerliste verbunden sind.

Eine TabChartGruppe ist ein Chart Container, der gleichzeitig Charts in unterschiedlichen Zeiteinheiten für hunderte Instrumente öffnet um damit eine große Vielfalt von Symbolen in kürzester Zeit visuell zu analysieren um daraus effizient z.b. Long und Shortlisten zu bauen.

### News Feedreader <a href="#news-feedreader" id="news-feedreader"></a>

Mit dem integrierten Feedreader haben Sie die Möglichkeit ganz bequem aus der Plattform heraus aggregierte News in NearTime zu erhalten.

Der Feedreader erlaubt es Ihnen auf wichtige Ereignisse wie z.B. Analystenmeinungen / Gewinnwarnungen oder Game-Changer zu reagieren. Unser Nachrichtenaggregator hält Sie über Marktgeschehnisse am laufendem.

Sie bekommen NearTime News zu fast allen an offiziellen Börsen gehandelten Werten.

### Trading Tagebuch <a href="#trading-tagebuch" id="trading-tagebuch"></a>

Unsere oberste Priorität ist es Ihnen zu helfen, mit mehr Erfolg und Stabilität zu traden.

Dies möchten wir erreichen, indem wir einen strukturierten Ansatz für die Einrichtung Ihrer Trades, der Positionsgrößenbestimmung und dem Risiko- und Geldmanagement bieten, in Kombination mit einem einfachen und benutzerfreundlichen Trading-Tagebuch.

Das Tagebuch macht es Ihnen leicht, durchgeführte Trades zu überprüfen und daraus zu lernen, wodurch Ihre Handelsfähigkeiten täglich verbessert werden können.

Das Trading Tagebuch ist logisch aufgebaut und bietet Ihnen die wichtigsten Kennzahlen zur Auswertung an.

### Marktscreener <a href="#end-of-day-marktscreener" id="end-of-day-marktscreener"></a>

Verwenden Sie unseren integrierten Aktien End-of-Day Screener um potentielle Chancen im Markt zu entdecken.

Mit Hilfe von benutzerdefinierten Auswahlkriterien und einer großen Anzahl an Datenkomponenten können Sie über 7000 US Aktien nach Ihren Wünschen screenen. Alle Einstellungen lassen sich in komfortable Templates abspeichern um bei Bedarf erneut genutzt zu werden.

Eine große Auswahl an Fundamentaldaten rundet unseren EOD-Scanner ab.

## **Handeln mit absoluter Vertraulichkeit**

**AgenaTrader gibt Ihnen vollkommene Sicherheit!**

Da Ihre Trades lokal auf Ihrem PC oder in Ihrer privaten Cloud ausgeführt werden, hat keine Drittpartei Zugriff auf Ihre Trades, Indikatoren oder Strategien – nicht einmal Ihr Broker!

Warum sollten Sie unzählige Stunden, Tage oder Wochen in die Entwicklung Ihrer Handelsstrategien investieren, nur damit jemand anderes Ihre wertvolle Arbeit kopiert und für sich nutzt?

Wir setzen uns dafür ein, Insiderhandel zu verhindern und sicherzustellen, dass große Unternehmen und Broker Ihre Daten nicht weiterverkaufen, um daraus Profit zu schlagen. Wir wissen, dass Handelsstrategien und Setups für Trader wertvoller als Gold sind – deshalb tun wir alles, um Ihnen eine absolut vertrauliche Handelsumgebung zu bieten.

***

## **Ihre All-in-One-Lösung**

**Mehrere Broker und Datenfeeds gleichzeitig nutzen – ohne Tool-Wechsel!**

Mit AgenaTrader können Sie sich gleichzeitig mit verschiedenen Brokern und Datenfeeds verbinden. Schluss mit ständigem Wechsel zwischen verschiedenen Anwendungen – alles ist direkt in AgenaTrader integriert.

Ob Markt-Scans, Analysen oder automatisierter Handel – all das können Sie direkt in AgenaTrader umsetzen, ohne auf zusätzliche Drittanbieter-Software angewiesen zu sein.

***

#### **Effizientes Arbeiten – selbst mit nur einem Monitor!**

**Optimale Handelsumgebung – egal, ob mit einem oder mehreren Bildschirmen**

Sie benötigen nicht zwangsläufig mehrere Monitore für effizientes Trading. Wir verstehen, dass viele Trader mobil unterwegs sind und ein Laptop oft die praktischere Wahl ist. Natürlich ist eine Multi-Screen-Umgebung für viele Trader ideal, aber AgenaTrader wurde mit unserer innovativen **Docking Tabs Technologie** entwickelt.

Das bedeutet: Selbst mit nur einem einzigen Monitor haben Sie alle wichtigen Werkzeuge übersichtlich im Blick! Die AgenaTrader-Arbeitsbereiche sind hochgradig flexibel und lassen sich individuell anpassen, sodass Sie Ihr Layout genau nach Ihren Bedürfnissen gestalten können.


# Unterstützte Handelsinstrumente und Orderabwicklung

## **Unterstützte Assetklassen**

AgenaTrader unterstützt eine Vielzahl von Anlageklassen, darunter:

* Aktien
* CFDs
* Futures
* Forex
* Optionen
* Indizes

Welche Instrumententypen tatsächlich zum Handel verfügbar sind, hängt jedoch von Ihrem Broker ab. Bitte erkundigen Sie sich bei Ihrem Broker, welche Anlageklassen unterstützt werden.

#### Unterstützte Orderverknüpfungen

Orderverknüpfungen sind Mechanismen, die Ihre Einstiegsorders mit Ziel- und Stop-Orders verbinden und so eine automatisierte Orderverwaltung ermöglichen. Es gibt drei Haupttypen von Orderverknüpfungen:

**OCO (One Cancels the Other):**\
Wird Ihre Stop-Order ausgeführt, wird die Ziel-Order automatisch storniert und umgekehrt.

**IfDone:**\
Sobald Ihre Einstiegsorder ausgeführt wurde, werden die zugehörigen Stop- und Ziel-Orders automatisch platziert.

**ORO (One Reduces the Other):**\
Wird eine Ihrer Ziel-Orders ausgeführt, wird die Größe Ihrer Stop-Order um den ausgeführten Anteil reduziert, sodass sie der verbleibenden Positionsgröße entspricht.

Bitte beachten Sie, dass die Handhabung und Unterstützung dieser Orderverknüpfungen je nach Broker unterschiedlich sein kann. Weitere Informationen finden Sie auf den jeweiligen Broker-Seiten in diesem Wiki oder im entsprechenden FAQ-Artikel.

#### Orderausführung

AgenaTrader selbst führt keine Orders aus. Stattdessen übernimmt Ihr Broker die Orderausführung und informiert AgenaTrader über ausgeführte Orders sowie deren Ausführungspreise.

Wenn die Daten Ihres Marktdatenanbieters für ein bestimmtes Instrument nicht mit den Kursen auf der Plattform Ihres Brokers übereinstimmen, werden Ein- und Ausstiegspreise möglicherweise nicht korrekt im Chart dargestellt.

<br>


# Lizenzmodelle

## **Andromeda & Andromeda SIM**

**AgenaTrader ist in zwei Lizenzversionen verfügbar, um unterschiedlichen Benutzeranforderungen gerecht zu werden: Andromeda und Andromeda SIM.**

#### ⚙️ Was ist der Unterschied?

Beide Versionen bieten den gleichen Funktionsumfang, einschließlich des vollständigen Zugriffs auf die professionellen Chart-, Handels- und Automatisierungsfunktionen der Plattform. Der einzige Unterschied besteht darin, wo und wie Sie handeln können.

#### 💻 Andromeda SIM (Kostenlos)

Andromeda SIM ist die Standardlizenz, die allen Benutzern nach der erstmaligen Einrichtung von AgenaTrader zugewiesen wird. Sie ist vollständig kostenlos und bietet den vollen Funktionsumfang der Plattform, ist jedoch auf folgende Handelsumgebungen beschränkt:

* SimAccount (Demohandel)
* AgenaBroker-Konten

✅ Ideal für Trader, die Strategien testen oder an Wettbewerben teilnehmen möchten.\
❌ Verbindungen zu externen Brokern sind nicht möglich.

Zusätzlich können Sie weiterhin Datenfeed-Anbieter verbinden (sofern diese keine Broker sind). Diese sind im Abschnitt **Datenfeeds** der Dokumentation aufgeführt.

#### 🚀 Andromeda (Vollversion)

Mit einer vollständigen Andromeda-Lizenz erhalten Sie den vollen Multi-Broker-Funktionsumfang und können mit einer Vielzahl von Brokern handeln. Sie können sich verbinden mit:

* Jedem Broker, der einen unserer unterstützten Technologieanbieter-Verbindungstypen unterstützt.
* Allen Brokern, die in unserer Liste der unterstützten Broker aufgeführt sind.

Die Andromeda-Lizenz kann direkt über den **AgenaTrader Shop** gemietet werden.

✅ Entwickelt für professionelle und aktive Trader.\
✅ Unterstützt den Live-Handel mit mehreren Brokern und individuellen Konfigurationen.

## 🧾 Zusammenfassung

| Funktion                   | Andromeda SIM (Kostenlos) | Andromeda (Vollversion)       |
| -------------------------- | ------------------------- | ----------------------------- |
| SimAccount-Handel          | ✅                         | ✅                             |
| AgenaBroker-Handel         | ✅                         | ✅                             |
| Externe Brokerverbindungen | ❌                         | ✅                             |
| Multibroker-Unterstützung  | ❌                         | ✅                             |
| Datenfeeds (keine Broker)  | ✅                         | ✅                             |
| Lizenzkosten               | Kostenlos                 | Mietlizenz im Shop erhältlich |


# Hardware und Systemanforderungen

<table data-header-hidden><thead><tr><th width="197"></th><th></th><th></th></tr></thead><tbody><tr><td>​</td><td><strong>Minimum</strong></td><td><strong>Empfohlen</strong></td></tr><tr><td><strong>Betriebssystem</strong></td><td>Windows 10, 11</td><td>Windows 10, 11</td></tr><tr><td>​</td><td>(Apple IOS with a virtual machine only)</td><td>(Apple IOS with a virtual machine only)</td></tr><tr><td><strong>Auflösung</strong></td><td>1024 x 768</td><td>1920 x 1080</td></tr><tr><td>​</td><td>​</td><td>maximale Auflösung 4.096 x 2.160 pixel</td></tr><tr><td><strong>Prozessor</strong></td><td>Dual Core (Intel I5 or AMD A8) 2 GHz+</td><td>Hz+ Quad Core (Intel I7 or AMD A10) 3 GHz+</td></tr><tr><td><strong>Arbeitsspeicher</strong></td><td>8 GB</td><td>16 GB und mehr</td></tr><tr><td><strong>Festplatte</strong></td><td>Standard SATA</td><td>SSD</td></tr><tr><td>​</td><td>(needed Memory: 200 MB for installation and up to 10 GB or more for user data)</td><td>(needed Memory: 200 MB for installation and up to 10 GB or more for user data)</td></tr><tr><td><strong>Architektur</strong></td><td>​<a href="http://windows.microsoft.com/de-at/windows/32-bit-and-64-bit-windows">64-bit-operating system</a>​</td><td>​<a href="http://windows.microsoft.com/de-at/windows/32-bit-and-64-bit-windows">64-bit-operating system</a>​</td></tr><tr><td><strong>Leitung</strong></td><td>16 Mbit/s</td><td>32 Mbit/s oder mehr</td></tr><tr><td><strong>Microsoft .NET Framework</strong></td><td>4.7.2</td><td>Neuste Version</td></tr></tbody></table>

**Wichtig:** Bitte überprüfen Sie Ihre Energieeinstellungen und deaktivieren Sie den Ruhezustand!

{% hint style="info" %}
Windows 7 / 8 / 8.1 werden nicht mehr als unterstützte Betriebssysteme aufgeführt, da Microsoft deren Support eingestellt hat. Weitere Informationen finden Sie hier: [Link](https://www.microsoft.com/en-us/windows/end-of-support?r=1)
{% endhint %}


# Lizenzierung, Programmierung, Kosten und Support

**Lizenz: Eigentum und Nutzungsrecht**

Das Eigentum an der Software verbleibt jederzeit beim Hersteller. Mit dem Kauf einer AgenaTrader-Lizenz erwirbt der Kunde das Recht zur Nutzung der Software. Weitere Informationen finden Sie in unseren **Allgemeinen Geschäftsbedingungen (AGB)**.

#### Programmierung und Sprache

AgenaTrader wurde in **C# .NET** programmiert und basiert auf einer **Plug-in-Architektur**.

**AgenaScript**, unsere interne Skriptsprache, basiert ebenfalls auf **C#**. Eine ausführlichere Beschreibung von AgenaScript finden Sie in der Skripthilfe oder auf unserem **Discord-Kanal**.

AgenaScript ist der Programmiersprache von **NinjaTrader** sehr ähnlich, sodass **NinjaScript** bis zu einem gewissen Grad importiert werden kann.

#### Mögliche Zusatzkosten

Mit jeder AgenaTrader-Version erhalten Sie eine **dauerhafte Lizenz**. Das bedeutet, dass innerhalb derselben Version keine zusätzlichen Kosten für Updates anfallen.

Kosten entstehen nur, wenn Sie auf eine höhere AgenaTrader-Version wechseln möchten (z. B. von **Basic** auf **Andromeda**).

Für **Datenfeeds**, **Brokerverbindungen**, **Add-ons** und **Add-ins** können jedoch zusätzliche Kosten anfallen.

Weitere Informationen finden Sie in unserem **Shop**.

#### Produkt- oder Versionswechsel

Online-Produkte müssen vom Kunden über unseren **Online-Shop** selbst bestellt oder gekündigt werden.

Für einen Produktwechsel muss das bestehende Produkt zunächst gekündigt und anschließend das neue Produkt über den regulären Bestellprozess bestellt werden.

Jeder Produktschlüssel wird Ihnen über den Online-Shop zugesendet. Nach dem Kauf erhalten Sie per E-Mail eine Rechnung mit Ihrem Lizenzschlüssel (bitte prüfen Sie auch Ihren Spam-Ordner).

Sie finden Ihre Rechnung mit dem Lizenzschlüssel außerdem in Ihrem Kundenkonto im Shop.

Nach der Anmeldung haben Sie die Möglichkeit, Ihre Produkte zu verwalten (kündigen, beenden oder neue Bestellungen aufgeben).

#### AgenaTrader Online-Medien und Support

Alle Links zu unseren Online-Angeboten (Tutorials, Modulvideos, Wiki, Webinare, Partnerangebote und vieles mehr) finden Sie in unserem Medienbereich.

Dort finden Sie auch Informationen darüber, wie Sie unser Vertriebs- oder Support-Team kontaktieren können.

Für allgemeine Fragen zur Nutzung der Software empfehlen wir unseren **Discord-Kanal**, auf dem sowohl andere Nutzer als auch das AgenaTrader-Team Ihre Fragen beantworten.

Zusätzlich steht Ihnen unser **YouTube-Kanal** mit Webinaren zur Trading-Ausbildung, Softwareschulungen und weiteren Lerninhalten zur Verfügung.


# Download & Installation TBD

### Download

AgenaTrader kann unter folgendem Link heruntergeladen werden:&#x20;

{% embed url="<https://agenatrader.com/download/AgenaTrader_Setup.exe>" fullWidth="false" %}
Klicken Sie auf den Link um AgenaTrader herunterzuladen
{% endembed %}

Nach dem Herunterladen können Sie den Installationsprozess von AgenaTrader durch Doppelklick auf die .exe-Datei starten. Folgen Sie diesem Video, wie Sie AgenaTrader installieren:

{% embed url="<https://www.youtube.com/watch?t=1s&v=kzwPWMJsTXo>" %}

<details>

<summary><em>Empfehlungen zur Installation der AgenaTrader Software</em></summary>

1\. Firewall / Virenschutzprogramm.

AgenaTrader führt beim Start der Applikation eine Lizenzschlüssel-Validierung durch und versucht dabei unseren Lizenzserver zu kontaktieren. Bitte achten Sie darauf, dass dies von Ihrer FireWall, SpySoftware o.ä erlaubt wird andernfalls erhalten Sie eine Lizenzschlüssel-Ablauf Meldung und es werden Ihnen die Rechte an AgenaTrader auf die einer Gratis-Lizenz eingeschränkt.

Sobald die Installation abgeschlossen ist, lesen Sie bitte den entsprechenden [**Connection Guide**](/german/main/broker-und-datenfeed/verbindungsanleitungen-fur-konten), um eine Verbindung zu Ihrem Broker oder DatenFeed Dienstleister herzustellen.

2\. TCP ports used by AgenaTrader. For properly AgenaTrader work, they should not be used by any other application:

**7778**: Main AgenaTrader service, licensing.\
**7779**: Connection to instrument database.\
**7780**:  Service dedicated for sending Support User Data.

### Clear Browser Cache <a href="#clear_browser_cache" id="clear_browser_cache"></a>

Wenn Sie eine neue AgenaTrader-Version downloaden bzw. upgraden (erneuern) möchten kann es passieren, dass Sie ihren Browser-Cache entleeren müssen.\
Fehler mit temporären Daten bzw. sogenannte 'Cabinet File Errors' können beim Download bzw. während der Installation auftreten.

*Wenn einer dieser Fehler auftritt befolgen Sie bitte folgende Schritte:*

* Öffnen Sie Ihren WebBrowser
* Löschen Sie den Browserverlauf
* Starten Sie einen neuen Download-Versuch

Wenn es wider Erwarten immer noch nicht funktioniert, versuchen Sie es mit einem anderen Web-Browser (Firefox, Chrom, IE, o.ä.).

</details>

## **Lizenzschlüssel TBD**

Um den AgenaTrader nutzen zu können, benötigen Sie einen Lizenzschlüssel.

Ihr Lizenzschlüssel wurde Ihnen von unserem Online Shop per Email gesendet. Bitte bewahren Sie diese Email gut auf und speichern den Lizenzschlüssel sicher auf einem Speichermedium. Sie finden die rechnung mit dem Key außerdem in Ihrem Online Shop Account. Dort können Sie schnell und einfach Ihre Produkte bearbeiten und Abos stornieren und neu bestellen.

Sollten Sie diese Email nicht erhalten haben, so sehen Sie bitte in Ihrem Spam-Ordner nach - hin und wieder verirren sich auch reguläre Emails dorthin. Sollte auch dort keine Email von uns eingegangen sein, so wenden Sie sich bitte an unseren Support.

### Lizenzaktivierung

Öffnen Sie die Datei *key.dat* mit einem Textbearbeitungsprogramm wie **Editor** oder **Notepad** unter Windows. Für Apple-Geräte stehen ebenfalls Textbearbeitungsprogramme zur Verfügung, mit denen Sie diese Datei öffnen können.

<figure><img src="https://files.gitbook.com/v0/b/gitbook-legacy-files/o/assets%2F-MKZSsJBtSP9L4sqIe_q%2F-MP94sEHsBtunBqWgdf0%2F-MP990pkLT9SW-MKOoRf%2Factivation.png?alt=media&#x26;token=4e803ddb-05ce-4954-8aa1-736e0b87c4c6" alt=""><figcaption></figcaption></figure>

Nach dem Sie nun den Aktivierungsschlüssel auslesen können, geben Sie bitte im AgenaTrader im Feld **Activation Key** den Aktivierungsschlüssel ein und drücken Sie den Activate-Button, wodurch sich der endgültigen Lizenzschlüssel automatisch kreiert. Erst die Kombination der beiden Keys berechtigt Sie zur Verwendung von AgenaTrader.

<figure><img src="https://docs.agenatrader.com/~gitbook/image?url=https%3A%2F%2F1347375179-files.gitbook.io%2F%7E%2Ffiles%2Fv0%2Fb%2Fgitbook-legacy-files%2Fo%2Fassets%252F-MKZSsJBtSP9L4sqIe_q%252F-MPF2GKRtXhoOgYaA79S%252F-MPF3SodYEbAavqujS3D%252FLizenzaktivierung.png%3Falt%3Dmedia%26token%3Dfca9dd03-37d4-4ef7-9b0b-4d74a711656b&#x26;width=768&#x26;dpr=4&#x26;quality=100&#x26;sign=eecff364&#x26;sv=1" alt=""><figcaption></figcaption></figure>

### **Demo version**

Zur Demo-Version ist vorweg zu sagen, dass diese Version eine Komplett-Version, mit - fast - allen Features bestückt, darstellt, mit der einzigen Beschränkung, dass der EoD-Scanner und der Finanzkalender hier deaktiviert sind und die Demo-Zeit auf 30 Tage limitiert ist.

Um eine Demo-Version zu erhalten, klicken Sie auf die Schaltfläche Request Demo Key. Im geöffneten Dialog füllen Sie die Formulare aus: Vorname, Nachname, E-Mail, Sprache und aktivieren Sie Checkboxen. Nachdem klicken Sie auf die Schaltfläche Request Demo Key. Den Demo-Schlüssel erhalten Sie über die von Ihnen eingegebenen E-Mails.

![](https://docs.agenatrader.com/~gitbook/image?url=https%3A%2F%2F1347375179-files.gitbook.io%2F%7E%2Ffiles%2Fv0%2Fb%2Fgitbook-legacy-files%2Fo%2Fassets%252F-MKZSsJBtSP9L4sqIe_q%252F-MPF2GKRtXhoOgYaA79S%252F-MPF3icsjjCP5vb7IEiT%252FDemo%2520Request.png%3Falt%3Dmedia%26token%3D5351746f-e903-4cc7-ba8c-9b0b1a71add4\&width=768\&dpr=4\&quality=100\&sign=2772878b\&sv=1)

Es ist möglich beim Start von AgenaTrader auszuwählen, ob eine Datenfeed Demo der Partner Lenz+Partner (Tai-Pan) installiert werden soll. Die Demos können auch zu einem späteren Zeitpunkt installiert werden.

Jetzt benötigen Sie noch ein [Simulations-Konto](https://agenatrader.com/de/broker/) und dann können Sie Ihre ersten Schritte gehen.

Falls Sie noch keine Demo-Version besitzen, können Sie hier eine [kostenlose AgenaTrader Demo-Version](https://agenatrader.com/de/demo/) anfordern!

Sie gehen KEINE Verpflichtung ein, Sie müssen NICHTS kündigen und es geht auch NICHT in einen automatischen Kauf über.

### **AgenaTrader auf mehreren Rechnern** <a href="#agenatrader-auf-mehreren-rechnern" id="agenatrader-auf-mehreren-rechnern"></a>

Sie können somit mit einem Aktivierungsschlüssel von mehreren Geräten (PC, Laptop, etc.) aus arbeiten. Es ist aber nicht möglich, *zur gleichen Zeit* von mehreren Geräten auf den AgenaTrader Lizenzschlüssel zuzugreifen. Der Lizenzschlüssel erlaubt nur eine Instanz/Zugriff zur gleichen Zeit.

### **AgenaTrader auf ältere Einstellungen zurücksetzen: Backup** <a href="#agenatrader-auf-altere-einstellungen-zurucksetzen-backup" id="agenatrader-auf-altere-einstellungen-zurucksetzen-backup"></a>

Aus datenschutzrechtlichen Gründen speichern wir keine Kundendaten auf unserem Server. AgenaTrader ist eine reine Client-Software. Wir empfehlen Ihnen daher sogar dringend, Ihre Daten zu sichern!

### **Unterstützt AgenaTrader MAC OSX (Apple)?** <a href="#unterstutzt-agenatrader-mac-osx-apple" id="unterstutzt-agenatrader-mac-osx-apple"></a>

AgenaTrader wurde für Windows entwickelt und kann auf Mac (Apple) nicht installiert werden. Viele Kunden verwenden jedoch erfolgreiche virtuelle Maschinen, welcher auf Mac (Apple) installiert werden können, um Windows zu starten. (Bsp. Paralells).

### **Bleiben meine Daten bei einem Update erhalten?** <a href="#bleiben-meine-daten-bei-einem-update-erhalten" id="bleiben-meine-daten-bei-einem-update-erhalten"></a>

Sie werden per PopUp darüber informiert, sobald ein neues Update zu Verfügung steht und wir raten Ihnen, dieses zu installieren. Hier werden lediglich Systemdaten erneuert. Ihre persönlichen Daten im Beispiel: User-Verzeichnis (Arbeitsplatz – Instrumente – Konditionen etc.), bleiben erhalten.

### **Download der aktellen AgenaTrader Release** <a href="#download-der-aktellen-agenatrader-release" id="download-der-aktellen-agenatrader-release"></a>

Ein Download ist 24/7 über unsere [Homepage ](https://agenatrader.com/download/AgenaTrader_Setup.exe)möglich. Grundsätzlich werden Sie jedoch ohnehin beim Neustart per Popup zum updaten aufgefordert, wenn ein Update zur Verfügung steht. Zusätzlich zeigt Ihnen der AgenaTrader am rechten unter Bildschirmrand an, ob ein neues Update zu Verfügung steht.

![](https://docs.agenatrader.com/~gitbook/image?url=https%3A%2F%2F1347375179-files.gitbook.io%2F%7E%2Ffiles%2Fv0%2Fb%2Fgitbook-legacy-files%2Fo%2Fassets%252F-MKZSsJBtSP9L4sqIe_q%252F-MPEsNvvtjP2k0b1-L-6%252F-MPEvzdGw3YxJg_eV0ph%252FUpdate%2520%281%29.png%3Falt%3Dmedia%26token%3Dae1f783e-e496-4410-8ad8-77658d1a741f\&width=768\&dpr=4\&quality=100\&sign=39f27889\&sv=1)


# Education Mode

## Education Mode

Für neue AgenaTrader-User, und alle, die etwas dazulernen möchten oder spontan Informationen zu einer Funktion benötigen, haben wir den **Education Mode** implementiert. Dieser Feature wird es den Usern leichter machen, schnell und unkompliziert die Funktionen des AgenaTrader kennen zu lernen und zu verstehen. Er ermöglicht raschen Zugang zur Online-Hilfe, ohne den Web-Browser nutzen zu müssen.

Wenn Sie mit der Maus über einen Feature fahren, erscheint ein kurzer Tooltipp:

<figure><img src="https://docs.agenatrader.com/~gitbook/image?url=https%3A%2F%2F1347375179-files.gitbook.io%2F%7E%2Ffiles%2Fv0%2Fb%2Fgitbook-legacy-files%2Fo%2Fassets%252F-MKZSsJBtSP9L4sqIe_q%252F-MP8fsMF4q1UaIfWtFf4%252F-MP8vrYVQrAEk0vK4G6R%252Feducation.png%3Falt%3Dmedia%26token%3D60c0d4bf-68db-4699-b75c-6bbbe7c77306&#x26;width=768&#x26;dpr=4&#x26;quality=100&#x26;sign=e31f7713&#x26;sv=1" alt=""><figcaption></figcaption></figure>

Um den **Education Mode** zu aktivieren, klicken Sie einfach auf den <img src="/files/b5gML1v7XK6kiQaryw3O" alt="" data-size="line">[ ](https://agenatrader.com/wiki/tiki-download_file.php?fileId=2184\&display)Button im Haupt-Toolbar. Danach erscheint bei jedem Funktionsnamen eine kleine Glühbirne.

Ein Klick auf die Glühbirne öffnet ein kleines Fenster mit dem Wiki-Artikel zur entsprechenden Funktion:

<figure><img src="/files/UzZAso0gBiINmb1bCYCn" alt=""><figcaption></figcaption></figure>

Wenn eine Funktion in mehreren Artikel beschrieben wird, so können SIe mit folgenden Buttons dahin navigieren:

<figure><img src="/files/2hVs3mp07xrKDp4kE16h" alt=""><figcaption></figcaption></figure>

Sie können den Education Mode deaktivieren, indem Sie einfach nochmal auf die Glühbirne im Haupt-Toolbar klicken.


# Video Guide

Um Ihnen Zeit zu sparen, haben wir für Sie eine Übersicht für unsere Education-Videos erstellt. Sie beinhaltet Antworten auf die häufigsten Fragen.

Mit einem auf den Videoplayer gegenüber der gewünschten Frage werden Sie direkt zu exakt dem Moment im Youtube-Video geleitet, in dem die Frage beantwortet wird. Zusätzlich finden Sie jeweils den Link zum passenden Wiki-Artikel.

{% hint style="info" %}
***Hinweis***: Die Videos sind auf Englisch, durch die Bilder jedoch auch für nicht-englischsprachige User sehr einfach verständlich und nachvollziehbar.
{% endhint %}

Hier finden Sie die Videos zu den 6 Modulen für den optimalen Einstieg in den AgenaTrader:\
Modul Videos

* Modul 1: Download - Installation - Erster Trade: [LINK](https://www.youtube.com/playlist?list=PLLftyBhQjHrVx1_2e0dA5NDNAvtojaRKF)
* Modul 2: Alle Asset Klassen handeln (Aktien, Forex, Futures, CFD): [LINK](https://www.youtube.com/playlist?list=PLLftyBhQjHrUv6jwhApeUADBP29XiEHrE)
* Modul 3: Mit dem DOM (Depth Of Market) handeln: [LINK](https://www.youtube.com/playlist?list=PLLftyBhQjHrWHX3CFdhs4VOpug43A0hAo)
* Modul 4: Einen individuellen Arbeitsplatz und Charts erstellen: [LINK](https://www.youtube.com/playlist?list=PLLftyBhQjHrXg3WwTRi3DtkjvWjjcrki1)
* Modul 5: ActionBar und Chart-Kurzbefehle: [LINK](https://www.youtube.com/playlist?list=PLLftyBhQjHrWJKjdaX7SJ1bBmmlAtweeq)
* Modul 6: AgenaTrader plusplus (AT++) automatisierter Handel: [LINK](https://www.youtube.com/playlist?list=PLLftyBhQjHrUXWq1xAjW-0mRuUTSUDCg6)

### Chart Typen <a href="#chart-typen" id="chart-typen"></a>

#### **Ein SingleChart öffnen** <a href="#ein-singlechart-offnen" id="ein-singlechart-offnen"></a>

{% embed url="<https://youtu.be/UKh3viLMTys>" %}

#### **Eine SingleChartGruppe öffnen** <a href="#eine-singlechartgruppe-offnen" id="eine-singlechartgruppe-offnen"></a>

{% embed url="<https://youtu.be/JAmHD_MzpzE>" %}

**Eine ListChartGruppe öffnen**

{% embed url="<https://youtu.be/JAmHD_MzpzE>" %}

#### **Eine TabChartGruppe öffnen** <a href="#eine-tabchartgruppe-offnen" id="eine-tabchartgruppe-offnen"></a>

{% embed url="<https://youtu.be/JAmHD_MzpzE>" %}

#### **Eine Chart Galerie öffnen** <a href="#eine-chart-galerie-offnen" id="eine-chart-galerie-offnen"></a>

{% embed url="<https://youtu.be/JAmHD_MzpzE>" %}

#### **Dynamic Scanner** <a href="#dynamic-scanner" id="dynamic-scanner"></a>

{% embed url="<https://youtu.be/JAmHD_MzpzE>" %}

#### **Ein neues Symbol zur ListChartGruppe hinzufügen** <a href="#ein-neues-symbol-zur-listchartgruppe-hinzufugen" id="ein-neues-symbol-zur-listchartgruppe-hinzufugen"></a>

{% embed url="<https://youtu.be/UKh3viLMTys>" %}

### Chart Toolbar <a href="#chart-toolbar" id="chart-toolbar"></a>

#### **Einen eigenen Arbeitsplatz erstellen** <a href="#einen-eigenen-arbeitsplatz-erstellen" id="einen-eigenen-arbeitsplatz-erstellen"></a>

{% embed url="<https://youtu.be/UKh3viLMTys>" %}

#### **Alarme ins Chart legen** <a href="#alarme-ins-chart-legen" id="alarme-ins-chart-legen"></a>

{% embed url="<https://youtu.be/UKh3viLMTys>" %}

#### **Den Instrument**Editor **öffnen** <a href="#den-instrumenteditor-offnen" id="den-instrumenteditor-offnen"></a>

{% embed url="<https://youtu.be/UKh3viLMTys>" %}

#### **Die Zeiteinheit ändern** <a href="#die-zeiteinheit-andern" id="die-zeiteinheit-andern"></a>

{% embed url="<https://youtu.be/UKh3viLMTys>" %}

#### **Mehrere Instrumente in einem Chart hinzufügen** <a href="#mehrere-instrumente-in-einem-chart-hinzufugen" id="mehrere-instrumente-in-einem-chart-hinzufugen"></a>

{% embed url="<https://youtu.be/UKh3viLMTys>" %}

#### **Den ChartStyle ändern** <a href="#den-chartstyle-andern" id="den-chartstyle-andern"></a>

{% embed url="<https://youtu.be/UKh3viLMTys>" %}

#### **Ein Zeichenobjekt hinzufügen** <a href="#ein-zeichenobjekt-hinzufugen" id="ein-zeichenobjekt-hinzufugen"></a>

{% embed url="<https://youtu.be/UKh3viLMTys>" %}

#### **Indikatoren hinzufügen** <a href="#indikatoren-hinzufugen" id="indikatoren-hinzufugen"></a>

{% embed url="<https://youtu.be/UKh3viLMTys>" %}

#### **Eine Strategie starten** <a href="#eine-strategie-starten" id="eine-strategie-starten"></a>

{% embed url="<https://youtu.be/UKh3viLMTys>" %}

#### **Ein Symbol zur InstrumentListe hinzufügen** <a href="#ein-symbol-zur-instrumentliste-hinzufugen" id="ein-symbol-zur-instrumentliste-hinzufugen"></a>

{% embed url="<https://youtu.be/UKh3viLMTys>" %}

#### **Preis-Marker und Linien hinzufügen** <a href="#preis-marker-und-linien-hinzufugen" id="preis-marker-und-linien-hinzufugen"></a>

{% embed url="<https://youtu.be/UKh3viLMTys>" %}

#### **TradeBars anzeigen/verbergen** <a href="#tradebars-anzeigen-verbergen" id="tradebars-anzeigen-verbergen"></a>

{% embed url="<https://youtu.be/UKh3viLMTys>" %}

#### **Die Chart-Farbe ändern** <a href="#die-chart-farbe-andern" id="die-chart-farbe-andern"></a>

{% embed url="<https://youtu.be/UKh3viLMTys>" %}

#### **Den ActionBar bearbeiten** <a href="#den-actionbar-bearbeiten" id="den-actionbar-bearbeiten"></a>

{% embed url="<https://youtu.be/UKh3viLMTys>" %}

#### **Allgemeine Chart Settings** <a href="#allgemeine-chart-settings" id="allgemeine-chart-settings"></a>

{% embed url="<https://youtu.be/UKh3viLMTys>" %}

### Chart Trading Strategien <a href="#chart-trading-strategien" id="chart-trading-strategien"></a>

#### **Symbol-informationen sehen** <a href="#symbol-informationen-sehen" id="symbol-informationen-sehen"></a>

{% embed url="<https://youtu.be/UKh3viLMTys>" %}

#### **Das Chart Trading Pad nutzen** <a href="#das-chart-trading-pad-nutzen" id="das-chart-trading-pad-nutzen"></a>

{% embed url="<https://youtu.be/ghxFIE6y-nI>" %}

#### **Den Trading Manager öffnen** <a href="#den-trading-manager-offnen" id="den-trading-manager-offnen"></a>

{% embed url="<https://youtu.be/ghxFIE6y-nI>" %}

#### **Orders direkt im Chart erstellen** <a href="#orders-direkt-im-chart-erstellen" id="orders-direkt-im-chart-erstellen"></a>

{% embed url="<https://youtu.be/qoHlRWgTTyc>" %}

#### **IFDone Verbindung erstellen** <a href="#ifdone-verbindung-erstellen" id="ifdone-verbindung-erstellen"></a>

{% embed url="<https://youtu.be/qoHlRWgTTyc>" %}

#### **OCO Verbindung erstellen** <a href="#oco-verbindung-erstellen" id="oco-verbindung-erstellen"></a>

{% embed url="<https://youtu.be/qoHlRWgTTyc>" %}

#### **ORO Veknüpfung erstellen** <a href="#oro-veknupfung-erstellen" id="oro-veknupfung-erstellen"></a>

{% embed url="<https://youtu.be/qoHlRWgTTyc>" %}

#### **Eine Order-Vorlage speichern** <a href="#eine-order-vorlage-speichern" id="eine-order-vorlage-speichern"></a>

{% embed url="<https://youtu.be/qoHlRWgTTyc>" %}

#### Automatisiertes Trading Setup <a href="#automatisiertes_trading_setup" id="automatisiertes_trading_setup"></a>

#### **Order Rundung** <a href="#order-rundung" id="order-rundung"></a>

{% embed url="<https://youtu.be/F5M24O5DVb8>" %}

#### **Das Risk Management nutzen** <a href="#das-risk-management-nutzen" id="das-risk-management-nutzen"></a>

{% embed url="<https://youtu.be/F5M24O5DVb8>" %}

#### **Eine Analyzer Session erstellen** <a href="#eine-analyzer-session-erstellen" id="eine-analyzer-session-erstellen"></a>

{% embed url="<https://youtu.be/F5M24O5DVb8>" %}

#### **Signale aktivieren** <a href="#signale-aktivieren" id="signale-aktivieren"></a>

{% embed url="<https://youtu.be/F5M24O5DVb8>" %}

#### **Signale konfigurieren** <a href="#signale-konfigurieren" id="signale-konfigurieren"></a>

{% embed url="<https://youtu.be/F5M24O5DVb8>" %}

#### **Zusätzliche Signal-Parameter** <a href="#zusatzliche-signal-parameter" id="zusatzliche-signal-parameter"></a>

{% embed url="<https://youtu.be/F5M24O5DVb8>" %}

#### **Eine automatisierte Strategie erstellen** <a href="#eine-automatisierte-strategie-erstellen" id="eine-automatisierte-strategie-erstellen"></a>

{% embed url="<https://youtu.be/F5M24O5DVb8>" %}

#### **Analyzer hinzufügen** <a href="#analyzer-hinzufugen" id="analyzer-hinzufugen"></a>

{% embed url="<https://youtu.be/F5M24O5DVb8>" %}

#### **HardTrail und Softtrail Stops** <a href="#hardtrail-und-softtrail-stops" id="hardtrail-und-softtrail-stops"></a>

{% embed url="<https://youtu.be/F5M24O5DVb8>" %}

#### **Trading Setups im Actionbar hinzufügen** <a href="#trading-setups-im-actionbar-hinzufugen" id="trading-setups-im-actionbar-hinzufugen"></a>

{% embed url="<https://youtu.be/F5M24O5DVb8>" %}

### DOM/QuickTrader <a href="#dom-quicktrader" id="dom-quicktrader"></a>

#### **DOM Anforderungen** <a href="#dom-anforderungen" id="dom-anforderungen"></a>

{% embed url="<https://youtu.be/JXdJRELCmDU>" %}

#### **Den DOM öffnen** <a href="#den-dom-offnen" id="den-dom-offnen"></a>

{% embed url="<https://youtu.be/JXdJRELCmDU>" %}

#### **Welche Orders im Orderbuch dargestellt sind** <a href="#welche-orders-im-orderbuch-dargestellt-sind" id="welche-orders-im-orderbuch-dargestellt-sind"></a>

{% embed url="<https://youtu.be/JXdJRELCmDU>" %}

#### **DOM Einstellungen bearbeiten** <a href="#dom-einstellungen-bearbeiten" id="dom-einstellungen-bearbeiten"></a>

{% embed url="<https://youtu.be/JXdJRELCmDU>" %}

#### **Time & Sales Einstellungen bearbeiten** <a href="#time-and-sales-einstellungen-bearbeiten" id="time-and-sales-einstellungen-bearbeiten"></a>

{% embed url="<https://youtu.be/JXdJRELCmDU>" %}

#### **Quantity-Alarme hinzufügen** <a href="#quantity-alarme-hinzufugen" id="quantity-alarme-hinzufugen"></a>

{% embed url="<https://youtu.be/JXdJRELCmDU>" %}

#### **Diskretionäre Orders über den DOM** <a href="#diskretionare-orders-uber-den-dom" id="diskretionare-orders-uber-den-dom"></a>

{% embed url="<https://youtu.be/JXdJRELCmDU>" %}

#### **AT++ Orders über den DOM** <a href="#at-orders-uber-den-dom" id="at-orders-uber-den-dom"></a>

{% embed url="<https://youtu.be/JXdJRELCmDU>" %}

#### **Den Quick Trader öffnen** <a href="#den-quick-trader-offnen" id="den-quick-trader-offnen"></a>

{% embed url="<https://youtu.be/JXdJRELCmDU>" %}

#### **Die Quick Trader Farbe ändern** <a href="#die-quick-trader-farbe-andern" id="die-quick-trader-farbe-andern"></a>

{% embed url="<https://youtu.be/JXdJRELCmDU>" %}

#### **Orders über den QuickTrader absetzen** <a href="#orders-uber-den-quicktrader-absetzen" id="orders-uber-den-quicktrader-absetzen"></a>

{% embed url="<https://youtu.be/JXdJRELCmDU>" %}

<br>


# Glossar

#### **Allgemeine Begriffe** <a href="#allgemeine_begriffe" id="allgemeine_begriffe"></a>

| Begriff             | Erklärung                                                                                                                                                                                            | Link                                                                                                                                   |
| ------------------- | ---------------------------------------------------------------------------------------------------------------------------------------------------------------------------------------------------- | -------------------------------------------------------------------------------------------------------------------------------------- |
| Briefkurs, Ask      | Börsenkurs, zu welchem Finanzinstrumente oder Finanzprodukte von einem Wirtschaftssubjekt verkauft werden.                                                                                           | [**Link**](http://de.wikipedia.org/wiki/Briefkurs)                                                                                     |
| Asset               | Anlagevermögen, Kapitalanlage                                                                                                                                                                        | [**Link**](htt://de.wikipedia.org/wiki/Asset)                                                                                          |
| Baisse, Bullenmarkt | Phase anhaltender Kursrückgänge                                                                                                                                                                      | [**Link**](http://boersenlexikon.faz.net/baisse.htm)                                                                                   |
| Geldkurs, Bid       | Preis, zu dem Verkäufer bereit sind, Wertpapiere zu kaufen                                                                                                                                           | [**Link**](http://boersenlexikon.faz.net/geldkurs.htm)                                                                                 |
| Hausse, Bullenmarkt | Nachhaltiger Anstieg der Wertpapierkurse                                                                                                                                                             | [**Link**](http://boersenlexikon.faz.net/hausse.htm)                                                                                   |
| CFD                 | Contract for Difference, Derivate, die auf der Differenz zwischen Geld- und Briefkurs aufbauen                                                                                                       | [**Link**](http://boersenlexikon.faz.net/contract.htm)                                                                                 |
| Schlusskurs         | Letzter festgestellter Kurs des Börsentages                                                                                                                                                          | [**Link**](http://boersenlexikon.faz.net/schlussk.htm)                                                                                 |
| Kommission          | Eine Provision (Kommission) ist die Gebühr, die ein Investment Broker für die Ausführung von Trades im Namen Dritter verlangt.                                                                       | [**Link**](http://de.wikipedia.org/wiki/Provision#Maklergesch.C3.A4ft)                                                                 |
| Währung             | Eine Währung ist im weiten Sinne die Verfassung und Ordnung des gesamten Geld­wesens eines Staates, die insbesondere die Festlegung des Münz- und Notensystems innerhalb des Währungsraums betrifft. | [**Link**](http://de.wikipedia.org/wiki/W%C3%A4hrung)                                                                                  |
| Derivat             | Ein derivatives Finanzinstrument oder kurz Derivat ist ein gegenseitiger Vertrag, der seinen wirtschaftlichen Wert vom beizulegenden Zeitwert einer markt­bezogenen Referenzgröße ableitet.          | [**Link**](http://de.wikipedia.org/wiki/Derivat_\(Wirtschaft\))                                                                        |
| Dividende           | ...ist der auf eine Aktie entfallende Anteil an der Gewinnausschüttung einer Aktiengesellschaft.                                                                                                     | [**Link**](http://boersenlexikon.faz.net/dividend.htm)                                                                                 |
| Dow Jones Index     | … spiegelt die Kursentwicklung von 30 der bedeutendsten Aktien der amerikanischen Börsen wider.                                                                                                      | [**Link**](http://boersenlexikon.faz.net/dowjones.htm)                                                                                 |
| ETF                 | Abkürzung für Exchange Traded Funds                                                                                                                                                                  | [**Link**](http://boersenlexikon.faz.net/etf.htm)                                                                                      |
| Börse               | Als Börsen werden Märkte bezeichnet, auf denen bestimmte handelbare Güter (Waren, Wertpapiere, Edelmetalle, Devisen, Unternehmensanteile, Kreditverbriefungen usw.) gehandelt werden.                | [**Link**](http://boersenlexikon.faz.net/boerse.htm)                                                                                   |
| Verfallsdatum       | Der Zeitpunkt, an dem eine Position automatisch geschlossen wird.                                                                                                                                    | [**Link**](htt://agenatrader.com/wiki/tiki-index.php?page=Instrument-Escort%3A+Futures+Kontrakt+Rollover)                              |
| Forex               | Jener Markt, an dem Devisenangebot und Devisennachfrage aufeinandertreffen und zum ausgehandelten Devisenkurs getauscht werden.                                                                      | [**Link**](http://de.wikipedia.org/wiki/Devisenmarkt)                                                                                  |
| Futures-Kontrakt    | Als Terminkontrakt oder Future wird die börsengehandelte Form eines unbedingten Termingeschäfts bezeichnet.                                                                                          | [**Link**](https://docs.agenatrader.com/v/german/menue-erklaerungen-and-inhalt/tool-menue/instrument-escort/futures-kontrakt-rollover) |
| Index               | Ein Aktienindex ist eine Kennzahl für die Entwicklung von ausgewählten Aktienkursen. Er soll die Entwicklung auf diesem Teilmarkt des weltweiten Finanzgeschehens repräsentativ dokumentieren.       | [**Link**](http://de.wikipedia.org/wiki/Aktienindex)                                                                                   |
| Inflation           | Geldentwertung (Sinken des Geldwertes), die sich durch ständiges Steigen des Preisniveaus für Endprodukte (Konsumgüter, Investitionsgüter) ausdrückt.                                                | [**Link**](http://boersenlexikon.faz.net/inflatio.htm)                                                                                 |
| Investor            | Ein Anleger ist ein Marktteilnehmer, der am Finanzmarkt ein Finanzprodukt erwirbt oder am Gütermarkt eine Investition tätigt.                                                                        | [**Link**](http://de.wikipedia.org/wiki/Anleger_\(Finanzmarkt\))                                                                       |
| Hebel               | Der Leverage-Effekt ist ein finanzwirtschaftlicher Begriff, der allgemein Situationen beschreibt, bei denen kleine Änderungen einer Variablen zu großen Ausschlägen im Resultat führen.              | [**Link**](http://de.wikipedia.org/wiki/Leverage-Effekt#Leverage-Effekt_bei_Derivaten)                                                 |
| Mappings            | Symbolnamen, die für unterschiedliche Broker und Datenfeeds verschieden sein können.                                                                                                                 | [**Link**](https://docs.agenatrader.com/v/german/menue-erklaerungen-and-inhalt/tool-menue/instrumente-maerkte-und-mappings)            |
| Margin              | Mit Marge / Margin wird im Derivatehandel diejenige Sicherheitsleistung bezeichnet, die der Erwerber der Papiere leisten muss.                                                                       | [**Link**](http://boersenlexikon.faz.net/marge.htm)                                                                                    |
| Marktdaten          | Preis- und Handelsdaten für ein Finanzinstrument, die von einem Handelsplatz, wie einer Börse gemeldet werden.                                                                                       | [**Link**](http://de.wikipedia.org/wiki/Marktdaten)                                                                                    |
| Option              | Ein Kontrakt, der dem Käufer das Recht und dem Verkäufer (Stillhalter) die Verpflichtung gibt, bis zum Verfalldatum der Option zum Basispreis den Basiswert zu kaufen oder zu verkaufen              | [**Link**](http://boersenlexikon.faz.net/option.htm)                                                                                   |
| Risiko              | Als Finanzrisiken werden die Risiken eines Wirtschaftssubjekts bezeichnet, die ihren Ursprung im Finanzbereich haben und sich unmittelbar auf die Gewinn- und Verlustrechnung auswirken.             | [**Link**](http://de.wikipedia.org/wiki/Finanzrisiko)                                                                                  |
| Rollover            | Bedeutet, dass man eine Position über sein Verfallsdatum hinaus offen hält.                                                                                                                          | [**Link**](https://docs.agenatrader.com/v/german/menue-erklaerungen-and-inhalt/tool-menue/instrument-escort/futures-kontrakt-rollover) |
| Aktie               | Das Eigentum an einer Aktiengesellschaft ist in Bruchteile unterteilt, die durch Aktien verbrieft sind.                                                                                              | [**Link**](http://boersenlexikon.faz.net/aktie.htm)                                                                                    |
| Handelsstrategie    | Eine Handelsstrategie (auch Handelssystem) ist ein Regelwerk zum Handel von Wertpapieren oder Futures. Man unterscheidet manuelle und automatisch ausgeführte Strategien.                            | [**Link**](http://de.wikipedia.org/wiki/Handelsstrategie)                                                                              |
| ISIN                | International Securities Identification Number: Die ISIN ist eine zwölfstellige Buchstaben-Zahlen-Kombination und stellt eine Identifikation für ein Wertpapier auf internationaler Ebene dar.       | [**Link**](http://www.wienerborse.at/wissen/boersenlexikon/buchstabe-i/isin/)                                                          |
| Arbeitsplatz        | Aktuelle Anzeige aller Tabs, Diagramme und weiterer Inhalte, die Sie in einer bestimmten Vorlage angeordnet haben                                                                                    | [**Link**](https://docs.agenatrader.com/v/german/menue-erklaerungen-and-inhalt/hauptmenue/arbeitsplatz)                                |

#### **AgenaTrader Funktionen** <a href="#agenatrader_funktionen" id="agenatrader_funktionen"></a>

| Begriff                  | Erklärung                                                                                                                                                                                                                                                                                    | Link                                                                                                                                                 |
| ------------------------ | -------------------------------------------------------------------------------------------------------------------------------------------------------------------------------------------------------------------------------------------------------------------------------------------- | ---------------------------------------------------------------------------------------------------------------------------------------------------- |
| ActionBar                | Der ActionBar befindet sich rechts vom Chart und ist mit diversen Funktionen bestückt um die Ergonomie zu verbessern.                                                                                                                                                                        | [**Link**](https://docs.agenatrader.com/v/german/menue-erklaerungen-and-inhalt/hauptmenue/actionbar)                                                 |
| Alarme                   | Hier kann der User sich Alarme nach gewissen Kriterien konfigurieren und wird sofort benachrichtigt, wenn diese erfüllt werden.                                                                                                                                                              | [**Link**](https://docs.agenatrader.com/v/german/menue-erklaerungen-and-inhalt/tool-menue/alarme)                                                    |
| Analyzer Spalte          | Bei der Analyzer-Spalte handelt es sich um eine erweiterte Scanner-Spalte für die Watch-Liste oder die List Chart Gruppe, welche nach denen im Setup-Builder definierten und aktivierten Conditions/Signalen sucht und über deren Auftreten in der Spalte visuell oder akustisch informiert. | [**Link**](https://docs.agenatrader.com/v/german/menue-erklaerungen-and-inhalt/tool-menue/konfigurations-escort/setup-escort#analyzer-escort-spalte) |
| Backtest                 | Das Backtesting einer Strategie ist relevant, um die Performance dieser Strategie auf historischer Basis zu überprüfen.                                                                                                                                                                      | [**Link**](https://docs.agenatrader.com/v/german/menue-erklaerungen-and-inhalt/hauptmenue/backtest)                                                  |
| Signal-Builder           | Über den Signal-Builder ist es möglich sehr komplexe Conditions/Signale für Scans über den Scanner und Analyzer Spalte per Mausklick zu erstellen.                                                                                                                                           | [**Link**](https://docs.agenatrader.com/v/german/menue-erklaerungen-and-inhalt/tool-menue/konfigurations-escort/condition-escort)                    |
| Correlation Matrix       | Mit der Korrelations-Marix können Sie die Performance von einzelnen Instrumenten und sogar ganzen Instrument-Listen in Echtzeit (!) in einer beliebigen Zeiteinheit vergleichen.                                                                                                             | [**Link**](https://docs.agenatrader.com/v/german/menue-erklaerungen-and-inhalt/hauptmenue/correlation-matrix)                                        |
| Teil-Trades              | Meint ein Trading-Setup, das mehr als einen Stopp oder Target enthält.                                                                                                                                                                                                                       | [**Link**](https://docs.agenatrader.com/v/german/menue-erklaerungen-and-inhalt/tool-menue/handelsinformationen#teil-trades)                          |
| Preis Style              | Ein Angebot von unterschiedlichen Preisdarstellungen im Chart.                                                                                                                                                                                                                               | [**Link**](https://docs.agenatrader.com/v/german/menue-erklaerungen-and-inhalt/hauptmenue/chart-toolbar/preis-style)                                 |
| Quick Trader             | Der QuickTrader ermöglicht eine schnelle Order- bzw. Strategieeingabe im Chart.                                                                                                                                                                                                              | [**Link**](https://docs.agenatrader.com/v/german/menue-erklaerungen-and-inhalt/hauptmenue/actionbar#AktionsBar__Quick_Trader_anzeigen)               |
| Bid/Ask Spread           | Die Geld-Brief-Spanne (englisch bid-ask spread) ist bei Wertpapieren, Devisen, Sorten, Edelmetallen (Finanzinstrumente) und Waren (englisch Commodities) die Differenz zwischen Geld- und Briefkurs.                                                                                         | [**Link**](https://de.wikipedia.org/wiki/Spread_\(Wirtschaft\)#Kursbezogene_Spreads)                                                                 |
| Record and Replay Escort | Mit dem Record/Replay-Escort können Tickdaten aus dem laufenden Betrieb aufgezeichnet und wieder abgespielt werden.                                                                                                                                                                          | [**Link**](https://docs.agenatrader.com/v/german/menue-erklaerungen-and-inhalt/tool-menue/record-und-replay-escort)                                  |
| Instrument Editor        | Der Instrument-Editor ist das Werkzeug um Instrumente und Instrumentlisten zu verwalten.                                                                                                                                                                                                     | [**Link**](https://docs.agenatrader.com/v/german/menue-erklaerungen-and-inhalt/tool-menue/instrument-escort)                                         |
| Aktien EOD Screener      | Im Aktien EOD Screener ist es möglich knapp 7000 US-Werte auf fundamentale und technische Kriterien zu scannen.                                                                                                                                                                              | [**Link**](https://docs.agenatrader.com/v/german/menue-erklaerungen-and-inhalt/hauptmenue/aktien-eod-screener)                                       |
| Programmierung           | In der Programmierumgebung von AgenaTrader können Komponenten selbst programmiert werden                                                                                                                                                                                                     | [**Link**](https://docs.agenatrader.com/v/german/erstellen-sie-ihre-eigene-handelsstrategie/programmierung)                                          |
| DOM (Orderbuch)          | AgenaTrader verfügt über ein Orderbuch zur Anzeige der Markttiefe (DOM - depth of the market), über welches Orders abgesetzt werden können.                                                                                                                                                  | [**Link**](https://docs.agenatrader.com/v/german/menue-erklaerungen-and-inhalt/hauptmenue/depth-of-market-dom)                                       |
| Dynamic Scanner          | Der Dynamic Scanner sammelt automatisch alle verfügbaren Signale ein, die in einem der geöffneten Watch-Listen, Charts/ChartGruppen und Scanner (Analyzer Spalten) aktiv sind.                                                                                                               | [**Link**](https://docs.agenatrader.com/v/german/menue-erklaerungen-and-inhalt/hauptmenue/hauptmenue/dynamic-scanner)                                |

#### **Ordertypen und Setups** <a href="#ordertypen_und_setups" id="ordertypen_und_setups"></a>

| Begriff                 | Erklärung                                                                                                                                                                                                                         | Link                                                                                                                                      |
| ----------------------- | --------------------------------------------------------------------------------------------------------------------------------------------------------------------------------------------------------------------------------- | ----------------------------------------------------------------------------------------------------------------------------------------- |
| Order                   | Eine Wertpapierorder (Wertpapierauftrag) ist im Bankwesen der Auftrag zum Kauf oder Verkauf einer bestimmten Art und Menge von Wertpapieren.                                                                                      | [**Link**](http://de.wikipedia.org/wiki/Wertpapierorder)                                                                                  |
| Long Order              | Kauf eines Wertpapiers über einen Broker                                                                                                                                                                                          | [**Link**](https://docs.agenatrader.com/v/german/menue-erklaerungen-and-inhalt/hauptmenue/chart-menu/chart-trading)                       |
| Short Order             | Verkauf eines Wertpapiers über einen Broker                                                                                                                                                                                       | [**Link**](https://docs.agenatrader.com/v/german/menue-erklaerungen-and-inhalt/hauptmenue/chart-menu/chart-trading)                       |
| Market Order            | Auftrag ohne Angabe eines Preislimits, bei welchem der gesamte Auftrag so schnell wie möglich zum nächstmöglichen Preis ausgeführt werden soll.                                                                                   | [**Link**](https://docs.agenatrader.com/v/german/menue-erklaerungen-and-inhalt/hauptmenue/order-escort#Order_Escort__Order_Buttons)       |
| Limit Order             | Auftrag mit Angabe eines Preislimits                                                                                                                                                                                              | [**Link**](https://docs.agenatrader.com/v/german/menue-erklaerungen-and-inhalt/hauptmenue/order-escort#Order_Escort__Order_Buttons)       |
| Stop Order              | Eine Stop Order ist dadurch gekennzeichnet, dass sie - sobald das vorgegebene Preislevel erreicht wird - automatisch als „Bestens Order“ (Market) in den Markt (Orderbuch) gestellt wird.                                         | [**Link**](https://docs.agenatrader.com/v/german/menue-erklaerungen-and-inhalt/hauptmenue/order-escort#Order_Escort__Order_Buttons)       |
| Stop Limit Order        | Eine Stop Limit Order ist dadurch gekennzeichnet, dass sie - sobald das vorgegebene Preislevel erreicht wird - automatisch als limitierter Auftrag (Limit) in den Markt (Orderbuch) gestellt wird.                                | [**Link**](https://docs.agenatrader.com/v/german/menue-erklaerungen-and-inhalt/hauptmenue/order-escort#Order_Escort__Order_Buttons)       |
| OCO (One Cancels Other) | OCO bedeutet, dass sobald die eine Order ausgeführt wurde, die zweite verbundene Order gelöscht wird.                                                                                                                             | [**Link**](https://docs.agenatrader.com/v/german/menue-erklaerungen-and-inhalt/hauptmenue/chart-menu/chart-trading#oco-verknuepfungen)    |
| IfDone Order            | Der Sinn einer If-Done-Verknüpfung ist es, eine bestätigte und eine unbestätigte Order zu verknüpfen.                                                                                                                             | [**Link**](https://docs.agenatrader.com/v/german/menue-erklaerungen-and-inhalt/hauptmenue/chart-menu/chart-trading#ifdone-verknuepfungen) |
| ORO (One reduces Other) | Der Sinn einer ORO-Verknüpfung ist es, wenn man mehrere Targets hat, eine Stop-Order mit einer Target-Order zu verbinden, da beim Ausführen einer Target-Order die Stop-Order mit genau dieses Ordervolumen reduziert werden muss | [**Link**](https://docs.agenatrader.com/v/german/menue-erklaerungen-and-inhalt/hauptmenue/chart-menu/chart-trading#oro-verknuepfungen)    |
| Direkt Orders           | Eine direkte Order wird an den Broker weitergeleitet. D.h. wird eine Order platziert, so liegt sie an der Börse.                                                                                                                  | [**Link**](https://docs.agenatrader.com/v/german/menue-erklaerungen-and-inhalt/hauptmenue/order-escort#Direkte_Orders)                    |
| Synthetische Orders     | Synthetische Orders werden nicht an die Börse weitergeleitet und liegen nur lokal am Rechner.                                                                                                                                     | [**Link**](https://docs.agenatrader.com/v/german/menue-erklaerungen-and-inhalt/hauptmenue/order-escort#Synthetische_Orders)               |
| Dynamic orders          | Dynamische Orders sind eine AgenaTrader++ Innovation. Im Grunde handelt es sich um eine synthetische Order, die jedoch nur "auf Verdacht" platziert wird.                                                                         | [**Link**](https://docs.agenatrader.com/v/german/menue-erklaerungen-and-inhalt/hauptmenue/order-escort#Dynamische_Orders)                 |
| Scale-in orders         | Eine Scale-In Order schickt nacheinander mehrere Orders (Tranchen) in den Markt, bis die gewünschte Positionsgröße erreicht ist.                                                                                                  | [**Link**](https://docs.agenatrader.com/v/german/menue-erklaerungen-and-inhalt/hauptmenue/order-escort#Scale-In-Orders)                   |
| GTC (Good til Cancel )  | Diese Order bleibt aktiv, bis sie entweder vom Investor aufgehoben wird oder der Trade ausgeführt wird.                                                                                                                           | [**Link**](https://docs.agenatrader.com/v/german/menue-erklaerungen-and-inhalt/hauptmenue/chart-toolbar/standard-chart-trading-pad)       |
| GTD (Good til Cancel)   | Die Order bleibt aktiv bis zu dem vom User festgelegten Zeitpunkt, falls sie nicht vorher gefillt oder gecancelt wird.                                                                                                            | [**Link**](https://docs.agenatrader.com/v/german/menue-erklaerungen-and-inhalt/hauptmenue/chart-toolbar/standard-chart-trading-pad)       |
| Tag                     | Diese Order verfällt automatisch mit Ende der regulären Trading Session, wenn sie nicht ausgeführt worden ist.                                                                                                                    | [**Link**](https://docs.agenatrader.com/v/german/menue-erklaerungen-and-inhalt/hauptmenue/chart-toolbar/standard-chart-trading-pad)       |
| Out RTH                 | Ermöglicht das Ausführen von Orders außerhalb der regulären Börsenöffnungszeiten                                                                                                                                                  | [**Link**](https://docs.agenatrader.com/v/german/menue-erklaerungen-and-inhalt/hauptmenue/chart-toolbar/standard-chart-trading-pad)       |

#### **AT plus-plus** <a href="#at_plus-plus" id="at_plus-plus"></a>

| Begriff           | Erklärung                                                                                                                                                              | Link                                                                                                                                             |
| ----------------- | ---------------------------------------------------------------------------------------------------------------------------------------------------------------------- | ------------------------------------------------------------------------------------------------------------------------------------------------ |
| AT++              | Halb-automatisiertes Trading mit Trading-Setups                                                                                                                        | [**Link**](https://docs.agenatrader.com/v/german/menue-erklaerungen-and-inhalt/tool-menue/konfigurations-escort#at-plus-plus-manager)            |
| Setup Builder     | Über den Setup-Builder kann man sich per Mausklick vollständige Setups definieren und parametrisieren bzw. aktivieren und deaktivieren.                                | [**Link**](https://docs.agenatrader.com/v/german/menue-erklaerungen-and-inhalt/tool-menue/konfigurations-escort/setup-escort)                    |
| Analyzer Session  | Erlaubt das verwalten von mehreren Trading Strategien/Setups in verschiedenen Sessions.                                                                                | [**Link**](https://docs.agenatrader.com/v/german/menue-erklaerungen-and-inhalt/tool-menue/konfigurations-escort/setup-escort#analyzer-sessions)  |
| Einstieg          | Wird verwendet, um einen Trade bei einem bestimmten Preislevel zu eröffnen.                                                                                            | [**Link**](https://docs.agenatrader.com/v/german/menue-erklaerungen-and-inhalt/tool-menue/konfigurations-escort/at-plus-plus#einstiege)          |
| HardStop          | Hard Stops sind jene Stopp-Methoden, die auf die Stop-Orders angewandt werden.                                                                                         | [**Link**](https://docs.agenatrader.com/v/german/faqs/frequently-asked-questions-top-10-faqs-1/hard-und-soft-stops-automatische-stoppversetzung) |
| SoftStop          | Soft Stops schließen eine Position nicht sofort, wenn der Stopp vom Closing-Preis gekreuzt wird.                                                                       | [**Link**](https://docs.agenatrader.com/v/german/faqs/frequently-asked-questions-top-10-faqs-1/hard-und-soft-stops-automatische-stoppversetzung) |
| Target            | Vorher festgelegter Punkt, an dem der Investor den Trade mit einer profitablen Position schließen wird.                                                                | [**Link**](https://docs.agenatrader.com/v/german/menue-erklaerungen-and-inhalt/tool-menue/konfigurations-escort/setup-escort#targetescorts)      |
| Buying Power      | Der gesamte im Brokerage-Konto gehaltene Barbetrag zuzüglich der verfügbaren Höchstmarge                                                                               | [**Link**](https://docs.agenatrader.com/v/german/menue-erklaerungen-and-inhalt/tool-menue/konfigurations-escort/at-plus-plus#risikoverwaltung)   |
| Cash Value        | Geld des Users, das auf dem Brokerkonto gehalten wird                                                                                                                  | [**Link**](https://docs.agenatrader.com/v/german/menue-erklaerungen-and-inhalt/tool-menue/konfigurations-escort/at-plus-plus#risikoverwaltung)   |
| Initial Stop      | Der InitialStop wird aufgrund der InitialStop-Methode berechnet.                                                                                                       | [**Link**](https://docs.agenatrader.com/v/german/menue-erklaerungen-and-inhalt/tool-menue/konfigurations-escort/setup-escort#InitialStop)        |
| Risk/Trade        | Dabei handelt es sich um den Prozentsatz Ihres Kontos/Kapitals, den Sie bereit sind pro Trade zu riskieren.                                                            | [**Link**](https://docs.agenatrader.com/v/german/menue-erklaerungen-and-inhalt/tool-menue/konfigurations-escort/at-plus-plus#risikoverwaltung)   |
| Initial Risk      | Wird verwendet, um das maximale Verlustpotenzial festzulegen, das normalerweise der anfängliche investierte Betrag ist.                                                | [**Link**](https://docs.agenatrader.com/v/german/menue-erklaerungen-and-inhalt/tool-menue/konfigurations-escort/at-plus-plus#risikoverwaltung)   |
| Risk Amount       | Legt den absoluten Betrag fest, den Sie bereit sind, pro Trade zu riskieren.                                                                                           | [**Link**](https://docs.agenatrader.com/v/german/menue-erklaerungen-and-inhalt/tool-menue/konfigurations-escort/at-plus-plus#risikoverwaltung)   |
| Max. Investiert % | Definiert den Maximalbetrag an Buying Power oder Cash Value , der pro Trade investiert werden kann.                                                                    | [**Link**](https://docs.agenatrader.com/v/german/menue-erklaerungen-and-inhalt/tool-menue/konfigurations-escort/at-plus-plus#risikoverwaltung)   |
| Daily Loss Limit  | Legt den Maximalbetrag der erlaubten Verluste für Trades pro Tag fest.                                                                                                 | [**Link**](https://docs.agenatrader.com/v/german/menue-erklaerungen-and-inhalt/tool-menue/konfigurations-escort/at-plus-plus#risikoverwaltung)   |
| InitialStopOnly   | Erlaubt es Ihnen, den Initial-Stop in den Markt zu übermitteln. Sie wählen diesen, wenn Sie nicht den HardTrail StopEscort oder SoftTrail StopEscort verwenden wollen. | [**Link**](https://docs.agenatrader.com/v/german/menue-erklaerungen-and-inhalt/tool-menue/konfigurations-escort/setup-escort#initialstoponly)    |
| Risiko            | Im Trading-Setup ist ein Risiko der initiale Abstand zwischen Stop- und Entry-Order. Kann so eingestellt werden, dass Ihr G\&V im Chart Trader Balken angezeigt wird.  | [**Link**](https://docs.agenatrader.com/v/german/menue-erklaerungen-and-inhalt/hauptmenue/chart-menu/chart-trading#charttrader-balken)           |
| Strategien        | Eine Reihe objektiver Regeln, welche die Bedingungen festlegen, die eintreten müssen, damit ein Trade-Entry und -Exit stattfinden.                                     | [**Link**](http://de.wikipedia.org/wiki/Handelsstrategie)                                                                                        |

#### **Chart Container** <a href="#chart_container" id="chart_container"></a>

| Begriff             | Erklärung                                                                                                                                                      | Link                                                                                                                                                               |
| ------------------- | -------------------------------------------------------------------------------------------------------------------------------------------------------------- | ------------------------------------------------------------------------------------------------------------------------------------------------------------------ |
| EinzelChart         | Zeigt ein Chart pro Tab an.                                                                                                                                    | [**Link**](https://docs.agenatrader.com/v/german/menue-erklaerungen-and-inhalt/hauptmenue/hauptmenue/einzelchart)                                                  |
| EinzelChart Gruppe  | Zeigt bis zu 4 Charts des selben Instruments in einem Chartcontainer an.                                                                                       | [**Link**](https://docs.agenatrader.com/v/german/menue-erklaerungen-and-inhalt/hauptmenue/hauptmenue/einzelchart-gruppe)                                           |
| List Chart Gruppe   | Ermöglicht das Erstellen einer Listen-basierten Chartgruppe inklusive Scanner und Charting-Area.                                                               | [**Link**](https://docs.agenatrader.com/v/german/menue-erklaerungen-and-inhalt/hauptmenue/hauptmenue/listchart-gruppe)                                             |
| Tab Chart Gruppe    | Chartcontainer, der gleichzeitig zahlreiche Charts für unterschiedliche Instrumente öffnet und die Symbole der Instrumente unterhalb in einem Tab-Bar anzeigt. | [**Link**](https://docs.agenatrader.com/v/german/menue-erklaerungen-and-inhalt/hauptmenue/hauptmenue/tabchart-gruppe)                                              |
| EinzelChart Galerie | Ermöglicht das Ansehen eines Symbols in zahlreichen Zeiteinheiten.                                                                                             | [**Link**](http://agenatrader.com/wiki/tiki-index.php?page=Chart+Container%3A+Chart+Galerie\&structure=Trading+Plattform+AgenaTrader+%28de%29#EinzelChart_Galerie) |
| List Chart Galerie  | Ermöglicht das Erstellen einer Listen-basierten Chart-Galerie, in dem Sie zahlreiche Symbole in vielen Zeiteinheiten ansehen können.                           | [**Link**](https://docs.agenatrader.com/v/german/menue-erklaerungen-and-inhalt/hauptmenue/hauptmenue/chart-galerie#EinzelChart_Galerie)                            |
| Tab Chart Galerie   | Ermöglicht das Erstellen einer Tab-basierten Chart-Galerie, in der Sie zahlreiche Symbole in vielen Zeiteinheiten ansehen können.                              | [**Link**](https://docs.agenatrader.com/v/german/menue-erklaerungen-and-inhalt/hauptmenue/hauptmenue/chart-galerie#TabChart_Galerie)                               |

#### **Charttypen** <a href="#charttypen" id="charttypen"></a>

| Begriff                | Erklärung                                                                                                                                                                                                             | Link                                                                                                                                   |
| ---------------------- | --------------------------------------------------------------------------------------------------------------------------------------------------------------------------------------------------------------------- | -------------------------------------------------------------------------------------------------------------------------------------- |
| CandleChart            | Die Candle Charts zeigen zur ausgewählten Perioden/Intervall-Kombination an: Open - High - Low - Close                                                                                                                | [**Link**](https://docs.agenatrader.com/v/german/menue-erklaerungen-and-inhalt/hauptmenue/chart-toolbar/preis-style#candle-chart)      |
| LinienChart            | Im Linien Chart werden die Schlusskurse der Periode miteinander verbunden.                                                                                                                                            | [**Link**](https://docs.agenatrader.com/v/german/menue-erklaerungen-and-inhalt/hauptmenue/chart-toolbar/preis-style#linien-chart)      |
| MountainChart          | Im Mountain Chart werden wie im Linien Chart die Schlusskurse der Periode miteinander verbunden, und noch zusätzlich der untere Bereich farblich eingefärbt.                                                          | [**Link**](https://docs.agenatrader.com/v/german/menue-erklaerungen-and-inhalt/hauptmenue/chart-toolbar/preis-style#mountain-chart)    |
| BarChart               | Im Bar(Balken)Chart werden die Kurse ähnlich wie im CandleChart dargestellt. Der Unterschied ist, dass der Eröffnungskurs anhand des kurzen Striches links bzw. der Schlusskurs rechts vom Kursbalken ersichtlich ist | [**Link**](https://docs.agenatrader.com/v/german/menue-erklaerungen-and-inhalt/hauptmenue/chart-toolbar/preis-style#bar-chart)         |
| EquiVolumeChart        | Das EquiVolume-Chart ist eine Chart-Darstellungs-Art in der die Preis/Zeit-Komponente und die Volumens-Komponente miteinander verbunden werden.                                                                       | [**Link**](https://docs.agenatrader.com/v/german/menue-erklaerungen-and-inhalt/hauptmenue/chart-toolbar/preis-style#equivolume)        |
| EquiVolume ShadowChart | Der Kerzenkörper wird bei steigendem Kurs vom Tief- bis zum Schlusskurs bzw. bei fallendem Kurs vom Hoch- bis zum Schlusskurs dargestellt.                                                                            | [**Link**](https://docs.agenatrader.com/v/german/menue-erklaerungen-and-inhalt/hauptmenue/chart-toolbar/preis-style#equivolume-shadow) |
| Candle Volume Chart    | Die KerzenVolume Darstellung verhält sich gleich wie die Candle Chart-Darstellung. Die Stärke der Kerzen richtet sich nach dem Volumen.                                                                               | [**Link**](https://docs.agenatrader.com/v/german/menue-erklaerungen-and-inhalt/hauptmenue/chart-toolbar/preis-style#candle-volumen)    |
| Point\&Figure          | Der P\&F-Chart besteht aus 'X'-Säulen, die steigende Kurse repräsentieren und 'O'-Säulen, die fallende Kurse repräsentieren.                                                                                          | [**Link**](https://docs.agenatrader.com/v/german/menue-erklaerungen-and-inhalt/hauptmenue/chart-toolbar/zeiteinheit#point-and-figure)  |
| Renko                  | Dieser Chart besteht aus schwarzen und weißen "Ziegel" den so genannten Bricks, wobei ein schwarzer Brick für fallende Kurse steht und ein weißer Brick für steigende Kurse.                                          | [**Link**](https://docs.agenatrader.com/v/german/menue-erklaerungen-and-inhalt/hauptmenue/chart-toolbar/zeiteinheit#renko)             |
| Kagi                   | Kagi Charts können behilflich sein, um die Hauptstrecke eines Trends zu handeln, denn sie zeigen das zugrundeliegende Angebot-Nachfrage-Kräfteverhältnis eines Wertes an.                                             | [**Link**](https://docs.agenatrader.com/v/german/menue-erklaerungen-and-inhalt/hauptmenue/chart-toolbar/zeiteinheit#kagi)              |
| Three Line Break       | Der Three Line Break Chart passt sich der Dynamik der Kurse automatisch an und hat den Ruf Trendwenden anzuzeigen.                                                                                                    | [**Link**](https://docs.agenatrader.com/v/german/menue-erklaerungen-and-inhalt/hauptmenue/chart-toolbar/zeiteinheit#three-line-break)  |
| Heikin Ashi            | Visuelle Technik, die Unregelmäßigkeiten aus dem normalen Chart eliminiert, um ein besseres Bild von Trends und Konsolidierungen zu ermöglichen.                                                                      | [**Link**](https://docs.agenatrader.com/v/german/menue-erklaerungen-and-inhalt/hauptmenue/chart-toolbar/zeiteinheit#heikin-ashi)       |
| Volume                 | Bei Volume Charts wird immer dann eine neue Kerze gezeichnet wenn ein bestimmtes Volumen (z.B. 200 Aktien/Kontrakte) gehandelt worden ist.                                                                            | [**Link**](https://docs.agenatrader.com/v/german/menue-erklaerungen-and-inhalt/hauptmenue/chart-toolbar/zeiteinheit#volume)            |
| Range                  | Bei Range Charts wird immer dann eine neue Kerze gezeichnet wenn eine bestimmte Preisspanne (z.B. 30 Ticks/Points/Cents/Pips) zurückgelegt worden ist.                                                                | [**Link**](https://docs.agenatrader.com/v/german/menue-erklaerungen-and-inhalt/hauptmenue/chart-toolbar/zeiteinheit#range)             |

#### **Zeichenobjekte** <a href="#zeichenobjekte" id="zeichenobjekte"></a>

| Begriff                               | Erklärung                                                                                                                                                                                                           | Link                                                                                                                                                            |
| ------------------------------------- | ------------------------------------------------------------------------------------------------------------------------------------------------------------------------------------------------------------------- | --------------------------------------------------------------------------------------------------------------------------------------------------------------- |
| Fibonacci Retracement                 | Weisen auf Bereiche mit Unterstützungen bzw. Widerständen an den Schlüssel-Fibonacco-Levels hin hin, ehe der Trend in die originale Richtung weitergeht.                                                            | [**Link**](https://docs.agenatrader.com/v/german/menue-erklaerungen-and-inhalt/hauptmenue/chart-toolbar/zeichenwerkzeuge#fibonacci)                             |
| Fibonacci Bögen                       | Erweiterte Version der Fibonacci Retracements. Verwendet Kreise statt Linien.                                                                                                                                       | [**Link**](https://docs.agenatrader.com/v/german/menue-erklaerungen-and-inhalt/hauptmenue/chart-toolbar/zeichenwerkzeuge#fibonacci)                             |
| Fibonacci Zeitzonen                   | Wird verwendet, um Zeitperioden von Aktiencharts hervorzuheben, wenn der Preistrend der Aktie (Indices oder andere handelbare Handelswaren) im Bezug auf Änderungen verletzlich ist.                                | [**Link**](https://docs.agenatrader.com/v/german/menue-erklaerungen-and-inhalt/hauptmenue/chart-toolbar/zeichenwerkzeuge#fibonacci)                             |
| Gann Fächer Rauf / Gann Fächer Runter | Der Gann Fan indiziert Zeit- und Preisbewegungen, die ihren Ursprungspunkt von wichtigen Hochs oder Tiefs haben und kann so helfen mögliche Ausbruch- bzw. Einbruchsszenarien zu erkennen.                          | [**Link**](https://docs.agenatrader.com/v/german/menue-erklaerungen-and-inhalt/hauptmenue/chart-toolbar/zeichenwerkzeuge#gann-faecher-rauf-gann-faecher-runter) |
| Andrew's Pitchfork                    | Andrew´s Pitchfork besteht aus drei parallelen Trendlinien, die in ein Chartbild gezeichnet werden.                                                                                                                 | [**Link**](https://docs.agenatrader.com/v/german/menue-erklaerungen-and-inhalt/hauptmenue/chart-toolbar/zeichenwerkzeuge#andrews-pitchfork)                     |
| Tirone Levels                         | Tirone Levels (entwickelt von John Tirone) sind drei horizontale Linien, welche z.B. wie Fibonacci Levels oder Quadrant Lines als Unterstützung/Widerstand dienen können.                                           | [**Link**](https://docs.agenatrader.com/v/german/menue-erklaerungen-and-inhalt/hauptmenue/chart-toolbar/zeichenwerkzeuge#tirone-levels)                         |
| Quadrant Linien                       | Quadrant Linien teilen einen Preisbereich in vier gleich große Bereiche                                                                                                                                             | [**Link**](https://docs.agenatrader.com/v/german/menue-erklaerungen-and-inhalt/hauptmenue/chart-toolbar/zeichenwerkzeuge#quadrant-linien)                       |
| Raff Regression Kanal                 | Der Raff Regression Kanal ist eine lineare Regression-Methode, die sich auf der bestmöglichen Anpassung einer Linie zu der Preisreihe basiert (diese wird mit einer OLS (ordinal least squares) Methode berechnet). | [**Link**](https://docs.agenatrader.com/v/german/menue-erklaerungen-and-inhalt/hauptmenue/chart-toolbar/zeichenwerkzeuge#raff-regression-kanal)                 |
| Trendkanal                            | Trendkanal ist eine Begrenzungslinie für die Preisbewegung eines Wertes. Die gegenüber liegende parallele Linie wird entsprechend angepasst.                                                                        | [**Link**](https://docs.agenatrader.com/v/german/menue-erklaerungen-and-inhalt/hauptmenue/chart-toolbar/zeichenwerkzeuge#trendkanal)                            |
| Free Hand Drawing                     | Mit dem Free Hand Drawing kann man diverse Markierungen, Notizen, etc. am Chart machen.                                                                                                                             | [**Link**](https://docs.agenatrader.com/v/german/menue-erklaerungen-and-inhalt/hauptmenue/chart-toolbar/zeichenwerkzeuge#free-hand-drawing)                     |
| Chart Distanzmesser                   | Mit dem Chart Distanzmesser kann man sich den Abstand vom Preis, Bars & Prozent anzeigen lassen.                                                                                                                    | [**Link**](https://docs.agenatrader.com/v/german/menue-erklaerungen-and-inhalt/hauptmenue/chart-toolbar/zeichenwerkzeuge#chart-distanzmesser)                   |
| Text                                  | Mit dem Text Objekt können beliebige Texte in den Chart eingefügt werden.                                                                                                                                           | [**Link**](https://docs.agenatrader.com/v/german/menue-erklaerungen-and-inhalt/hauptmenue/chart-toolbar/zeichenwerkzeuge#text)                                  |

Last updated 7 months ago


# FAQ

<details>

<summary>Unterstützt AgenaTrader macOS (Apple)?</summary>

AgenaTrader wurde für **Windows entwickelt** und kann nicht direkt auf macOS (Apple) installiert werden. Viele unserer Kunden nutzen jedoch erfolgreich **virtuelle Maschinen** wie **Parallels**, um Windows auf einem Mac auszuführen.

</details>

<details>

<summary><strong>Bleiben meine Daten bei einem Update erhalten?</strong></summary>

Wir arbeiten kontinuierlich daran, AgenaTrader zu verbessern und Fehler zu beheben. Sobald ein neues Update verfügbar ist, werden Sie über ein **Popup-Fenster** benachrichtigt – wir empfehlen, das Update zu installieren.

🔹 **Wichtige Information:**\
Nur **Systemdaten** werden aktualisiert – **Ihre persönlichen Daten** (z. B. Benutzerverzeichnis, Workspaces, Instrumente, Bedingungen) bleiben **erhalten**.

Zur zusätzlichen Sicherheit können Sie Ihre Daten problemlos **sichern und wiederherstellen**. Informationen zur Speicherung Ihrer Benutzerdaten sowie zur Datensicherung finden Sie **hier**.

</details>

<details>

<summary><strong>Ich sehe keine Marktdaten und kann nicht handeln</strong></summary>

Gelegentlich können Probleme bei der Verbindung zu einem Broker oder Datenfeed auftreten. In den meisten Fällen liegt dies daran, dass die Verbindung nicht **korrekt eingerichtet** wurde.

**Empfohlene Maßnahmen:**

* Überprüfen Sie, ob Sie ein aktives **Abonnement für den entsprechenden Dienst** besitzen oder ein Konto beim jeweiligen Anbieter eröffnet haben.
* Einige Broker und Datenanbieter erfordern zusätzliche **Einstellungen oder Aktivierungen** (z. B. spezielle Funktionen in der **TWS**, Synchronisierung der **Ports** etc.).
* Detaillierte Anleitungen zur Verbindung mit verschiedenen Brokern und Datenfeeds finden Sie in unseren **Online-Connection-Guides**.

</details>

<details>

<summary>Wo kann ich die neueste AgenaTrader-Version herunterladen?</summary>

Der Download von AgenaTrader ist **rund um die Uhr** auf unserer [**Homepage**](https://agenatrader.com/download_area/) verfügbar.

* Falls ein Update verfügbar ist, werden Sie beim Neustart von AgenaTrader durch ein **Popup-Fenster** darauf hingewiesen.
* Zusätzlich wird am **unteren rechten Bildschirmrand** eine Update-Benachrichtigung angezeigt.
* Updates sind **kostenlos**.

</details>


# Top


# Chart tickt, jedoch ohne Candles

**Häufigste Ursachen und Lösungen**

**Wenn die Handelszeiten eines Instruments im Instrument Editor nicht den tatsächlichen Handelszeiten der Börse entsprechen.**\
→ Wir empfehlen dringend, die Handelszeiten nicht zu ändern, sofern Sie nicht über fortgeschrittene Kenntnisse in AgenaTrader verfügen.

**Wenn die Handelszeiten einer gesamten Börse im Marketplace Escort nicht den tatsächlichen Handelszeiten der Börse entsprechen.**\
→ Wir empfehlen dringend, die Handelszeiten nicht zu ändern, sofern Sie nicht über fortgeschrittene Kenntnisse in AgenaTrader verfügen.

**Wenn die Einstellung „Wochenenden ausschließen“ unter „GlobalConfiguration → Chart“ aktiviert ist, werden am Wochenende keine neuen Kerzen gezeichnet. Werden die Von-/Bis-Einstellungen dieser Funktion geändert, kann dies dazu führen, dass auch andere Tage wie Montag oder Freitag im Chart ausgeschlossen werden.**\
→ Wir empfehlen, die Einstellungen für **„Wochenenden ausschließen“** nicht zu ändern. Die Standardeinstellungen finden Sie unten:

<figure><img src="https://docs.agenatrader.com/~gitbook/image?url=https%3A%2F%2F1347375179-files.gitbook.io%2F%7E%2Ffiles%2Fv0%2Fb%2Fgitbook-legacy-files%2Fo%2Fassets%252F-MKZSsJBtSP9L4sqIe_q%252F-MPF2GKRtXhoOgYaA79S%252F-MPF3nuCw2-Ae8YARrSA%252FFromToDefault.png%3Falt%3Dmedia%26token%3D4880c02a-f2b2-4573-85c5-898974694917&#x26;width=768&#x26;dpr=4&#x26;quality=100&#x26;sign=8c1297af&#x26;sv=1" alt=""><figcaption></figcaption></figure>


# Gewinn- und Verlust-Anzeige im Positionsbalken

**Gewinn/Verlust** zeigt den aktuellen Gewinn- bzw. Verlust der Position an. Mit einem Klick auf das Feld erscheint eine Auswahl von folgenden Darstellungsvarianten: Betrag Prozent Risiken (AgenaTrader++) Ticks

![](https://docs.agenatrader.com/~gitbook/image?url=https%3A%2F%2F1347375179-files.gitbook.io%2F%7E%2Ffiles%2Fv0%2Fb%2Fgitbook-legacy-files%2Fo%2Fassets%252F-MKZSsJBtSP9L4sqIe_q%252F-MPF2GKRtXhoOgYaA79S%252F-MPF3vOtYrukd0tYCjNN%252FOpenPL.png%3Falt%3Dmedia%26token%3De8041ede-acb2-4930-abf6-399457ebc663\&width=768\&dpr=4\&quality=100\&sign=9abc2ef9\&sv=1)![](https://docs.agenatrader.com/~gitbook/image?url=https%3A%2F%2F1347375179-files.gitbook.io%2F%7E%2Ffiles%2Fv0%2Fb%2Fgitbook-legacy-files%2Fo%2Fassets%252F-MKZSsJBtSP9L4sqIe_q%252F-MPF2GKRtXhoOgYaA79S%252F-MPF3z89OMah_AeDwV0X%252FPL%2520Anzeige.png%3Falt%3Dmedia%26token%3Dcfe92af6-73be-4dfe-9ea0-0903e173d99a\&width=768\&dpr=4\&quality=100\&sign=1641afac\&sv=1)

**Achtung:** Außerhalb der Handelszeiten können die Ask/ Bid Preise von den regulären Ask / Bid Preisen abweichen. Dies beeinflusst die Anzeige des aktuellen offenen G / V. Normalerweise, wenn die Märkte öffnen löst sich das automatisch. Wir wollen diese Ask / Bid-Preise nicht ignorieren, da es möglich ist, dass sich der Markt mit einem Gap öffnet und dieses G / V realisiert wird.


# Mit mehreren CDF-Brokern gleichzeitig verbinden

**Problemstellung:**

Sie möchten zu zwei oder mehreren Brokern gleichzeitig verbinden, erhalten dann jedoch immer eine Fehlermeldung wie diese:

<figure><img src="https://docs.agenatrader.com/~gitbook/image?url=https%3A%2F%2F1347375179-files.gitbook.io%2F%7E%2Ffiles%2Fv0%2Fb%2Fgitbook-legacy-files%2Fo%2Fassets%252F-MKZSsJBtSP9L4sqIe_q%252F-MPF2GKRtXhoOgYaA79S%252F-MPF41uw_ZKcrcsLyDFy%252FErrorMultiBroker.png%3Falt%3Dmedia%26token%3Df9c048ba-2bec-4550-97d2-1281ffeb7700&#x26;width=768&#x26;dpr=4&#x26;quality=100&#x26;sign=12e86aa3&#x26;sv=1" alt=""><figcaption></figcaption></figure>

**Lösungsmöglichkeit:**

Wir haben für den InstrumentEditor virtuelle CFD-Börsen ("CFD1" - "CFD10") implementiert. Sie können daher ab sofort manuell jeweils Broker-spezifische CFDs einer dieser "Börsen" zuweisen.

Dafür müssen Sie zuvor in den Kontoverbindungs-Einstellungen im Reiter "Konten" bei den jeweiligen Brokern bei Instrument-Typen "Markets only" auswählen und anschließend je eine unterschiedliche virtuelle Börse zuordnen. Nun können Sie zu mehreren CFD-Brokern gleichzeitig verbinden.

<figure><img src="https://docs.agenatrader.com/~gitbook/image?url=https%3A%2F%2F1347375179-files.gitbook.io%2F%7E%2Ffiles%2Fv0%2Fb%2Fgitbook-legacy-files%2Fo%2Fassets%252F-MKZSsJBtSP9L4sqIe_q%252F-MPF2GKRtXhoOgYaA79S%252F-MPF44scUdoMYp9DTTr8%252FVirtualExchanges2.png%3Falt%3Dmedia%26token%3D76d441b6-a4c0-441a-87d3-a96054f7f0e0&#x26;width=768&#x26;dpr=4&#x26;quality=100&#x26;sign=56d07066&#x26;sv=1" alt=""><figcaption></figcaption></figure>


# Hard und Soft stops: Automatische Stoppversetzung

## Hard und Soft stops <a href="#hard_und_soft_stops" id="hard_und_soft_stops"></a>

Der User kann vollständige Trading-Setups im SetupBuilder festlegen, aktivieren und deaktivieren.

*Weitere Informationen dazu finden Sie im Abschnitt* [***Setup Builder***](https://docs.agenatrader.com/german/menue-erklaerungen-and-inhalt/tool-menue/konfigurations-escort/setup-escort)

Für jedes Setup sollte der User Hard und Soft Stops anpassen.

*Details dazu finden Sie im Abschnitt* [***Setup Builder: Konfiguration***](https://docs.agenatrader.com/german/menue-erklaerungen-and-inhalt/tool-menue/konfigurations-escort/setup-escort#Setup_Escort__Konfiguration)

### **Hard Stops**&#x20;

Sind jene Stopp-Methoden, die auf die Stop-Orders angewandt werden.

Grundsätzlich ist der Hard-Stopp für den Worst Case da. Der HardTrail-Stopp steht immer in Verbindung mit der tatsächlichen Stopp-Order, sobald eine Position eröffnet wurde.

Das bedeutet: Sobald das Level des HardTrail-Stopps gekreuzt wurde, wird die gesamte Position geschlossen.

*Details dazu finden sie im Abschnitt* [***Hard Trail Stop***](https://docs.agenatrader.com/german/menue-erklaerungen-and-inhalt/tool-menue/konfigurations-escort/setup-escort#HardTrailStop)

### **Soft Stops**&#x20;

Schließen eine Position nicht sofort, wenn der Stopp vom Closing-Preis gekreuzt wird. Wenn der SortStop vom Closing-Preis gekreuzt wird, wird der HardStop getriggert und nachgezogen.

*Informationen dazu finden Sie im Abschnitt* [***Soft Trail Stop***](https://docs.agenatrader.com/german/menue-erklaerungen-and-inhalt/tool-menue/konfigurations-escort/setup-escort#SoftTrailStop)

### Beispiel <a href="#beispiel" id="beispiel"></a>

Als Beispiel konfigurieren wir folgendes Trading Setup:

<figure><img src="https://docs.agenatrader.com/~gitbook/image?url=https%3A%2F%2F1347375179-files.gitbook.io%2F%7E%2Ffiles%2Fv0%2Fb%2Fgitbook-legacy-files%2Fo%2Fassets%252F-MKZSsJBtSP9L4sqIe_q%252F-MPF2GKRtXhoOgYaA79S%252F-MPF495p-TwXnhNfwBjN%252Fconfiguration.png%3Falt%3Dmedia%26token%3D73f028a6-3017-44d3-95c6-f1e644ef083a&#x26;width=768&#x26;dpr=4&#x26;quality=100&#x26;sign=b1a26767&#x26;sv=1" alt=""><figcaption></figcaption></figure>

* **Initial Stop Escort** ist als ein Pivot Slow gesetzt. Das bedeutet, dass dieser Stop den Swing (30) Indikator als Stopp verwendet.
* **HardTrail Stop** ist als Keltner Channel gesetzt. Dieser Stop verwendet Keltner Linien als Stopp (die untere für eine Long und die obere für eine Short Position)
* **SoftTrail Stop** ist als SuperTrend festgelegt. Dieser Stopp nutzt den SuperTrend Indikator als Stop.
* **Target Escort** ist als No Target gesetzt. Das bedeutet, dass wir in diesem Setup keine Targets verwenden.

Sie finden mehr Details zu den Stop Setups auf der Seite [**Setup Builder: Stop Escorts**](https://docs.agenatrader.com/german/menue-erklaerungen-and-inhalt/tool-menue/konfigurations-escort/setup-escort#stopescorts).

Zuerst startet der Stop bei der **Initial Stop** Position (Pivot Slow). Nachdem die erste Kerze abgeschlossen ist, bewegt sich der Stopp automatisch auf die gleiche Weise wie die untere Keltner Linie (gemäß **HardTrail Stop** Setting). Im Chart wird der HardTrail Stop als eine durchgehende Linie dargestellt.

Der SoftTrail Stop beginnt auch, nachdem die erste Kerze abgeschlossen ist. Er bewegt sich gleich wie der SuperTrend Indikator (gemäß dem **SoftTrail Stop** Setting). Der SoftTrail Stop wird als gepunktete Linie im Chart dargestellt.

<figure><img src="https://docs.agenatrader.com/~gitbook/image?url=https%3A%2F%2F1347375179-files.gitbook.io%2F%7E%2Ffiles%2Fv0%2Fb%2Fgitbook-legacy-files%2Fo%2Fassets%252F-MKZSsJBtSP9L4sqIe_q%252F-MPF2GKRtXhoOgYaA79S%252F-MPF4BTUUlNFpON8qGEq%252Fchart.png%3Falt%3Dmedia%26token%3D581b73da-1a69-4bd6-b2f5-ab8a359ea82e&#x26;width=768&#x26;dpr=4&#x26;quality=100&#x26;sign=ba0431e1&#x26;sv=1" alt=""><figcaption></figcaption></figure>

Für den Fall, dass der User die automatische Stopversetzung ausschalten will, muss er einfach das Trading Setup gemäß den Angaben in unten stehendem Bild konfigurieren. Danach wird der Stop gemäß den Initial Stop Settings gesetzt und kann nur manuell vom User versetzt werden.

<figure><img src="https://docs.agenatrader.com/~gitbook/image?url=https%3A%2F%2F1347375179-files.gitbook.io%2F%7E%2Ffiles%2Fv0%2Fb%2Fgitbook-legacy-files%2Fo%2Fassets%252F-MKZSsJBtSP9L4sqIe_q%252F-MPF2GKRtXhoOgYaA79S%252F-MPF4EPF-Q2rRrKNl8M8%252Fstop.png%3Falt%3Dmedia%26token%3D2dba54ca-cc58-47fc-835d-0ccc1b71808d&#x26;width=768&#x26;dpr=4&#x26;quality=100&#x26;sign=7490cb45&#x26;sv=1" alt=""><figcaption></figcaption></figure>

**Achtung!** Hard und Soft Stops ziehen automatisch nach bezogen auf Ihre Stop-Setups!

*Informationen dazu finden Sie im Abschnitt* [***Setup Builder: Stop Escorts***](https://docs.agenatrader.com/german/menue-erklaerungen-and-inhalt/tool-menue/konfigurations-escort/setup-escort#Setup_Escort__Stop_Escorts)


# Welche Orderverknüpfungen unterstützt mein Broker

## **Übersicht Orderverknüpfungen**

Sie haben im AgenaTrader die Möglichkeit, komplexe Orderkonstrukte abzubilden.

Ihnen stehen dafür die Orderverknüpfungen "IfDone", "OCO" (one cancels other) und "ORO" (one reduces other) zur Verfügung. IfDone wird erstellt mit "ALT" und Klicks auf die erste und die zweite Order. OCO wird erstellt mit "STRG" und Klicks auf die erste und zweite Order. ORO wird erstellt mit "STRG"+"ALT" und Klicks auf die erste und zweite Order. Hier finden Sie die detaillierte Erklärung mit Workflow zu den einzelnen [Orderverknüpfungen](https://docs.agenatrader.com/german/menue-erklaerungen-and-inhalt/hauptmenue/chart-menu/chart-trading#orderverknuepfungen).

### **Unterstützte versus lokal simulierte Verknüpfungen**

**Achtung!**

IfDone und ORO werden ausschließlich lokal im AgenaTrader simuliert, die Software muss daher laufen und mit dem Broker verbunden sein, damit die jeweils verknüpfte zweite Order an den Broker gesandt wird! OCO-Verknüpfungen werden von einigen Brokern unterstützt - die entsprechenden Informationen dazu finden Sie in der Online-Hilfe beim [jeweiligen Broker](https://docs.agenatrader.com/german/general/broker). Einschränkend ist jedoch zu berücksichtigen, dass dies nur für SingleTarget-Orders gilt. Orderverknüpfungen in einem MultiTarget-Setting sind ORO-Verknüpfungen und werden daher nur lokal simuliert. Dies wird Ihnen als Meldung im Protokoll folgendermaßen angezeigt:

<figure><img src="https://docs.agenatrader.com/~gitbook/image?url=https%3A%2F%2F1347375179-files.gitbook.io%2F%7E%2Ffiles%2Fv0%2Fb%2Fgitbook-legacy-files%2Fo%2Fassets%252F-MKZSsJBtSP9L4sqIe_q%252F-MPF2GKRtXhoOgYaA79S%252F-MPF4YU6l_IpVZQ2WrF2%252FMultiTargetOCO.png%3Falt%3Dmedia%26token%3Deed0a689-a462-4310-9243-c9535d55d0f4&#x26;width=768&#x26;dpr=4&#x26;quality=100&#x26;sign=5c691908&#x26;sv=1" alt=""><figcaption></figcaption></figure>

Sie finden die Information, ob Ihr Broker OCO unterstützt, hier in der Online-Hilfe auf der Seite des [jeweiligen Brokers](https://agenatrader.com/wiki/tiki-index.php?page=Broker%20\(de\)) sowie im Essential Informations-Fenster, das sich öffnet und dessen Inhalt Sie zur Kenntnis nehmen und bestätigen müssen, wenn Sie eine neue Broker-Verbindung anlegen:

<figure><img src="https://docs.agenatrader.com/~gitbook/image?url=https%3A%2F%2F1347375179-files.gitbook.io%2F%7E%2Ffiles%2Fv0%2Fb%2Fgitbook-legacy-files%2Fo%2Fassets%252F-MKZSsJBtSP9L4sqIe_q%252F-MPF2GKRtXhoOgYaA79S%252F-MPF4aihUgyWZznR04pv%252FDisclaimerOrderConnections.png%3Falt%3Dmedia%26token%3D604c2a85-25e3-400a-9046-e9ebf2b4e7ae&#x26;width=768&#x26;dpr=4&#x26;quality=100&#x26;sign=3dc4cc46&#x26;sv=1" alt=""><figcaption></figcaption></figure>


# Сonditions und Skripte sind verschwunden

Hier gibt es mehrere Möglichkeiten, dieses Problem zu lösen:

* Laden Sie die aktuelle Version des Agena Trader herunter und installieren Sie diese: Download Link [**hier**](https://agenatrader.com/download/AgenaTrader_Setup.exe)
* Öffnen Sie **Strategie Handling->Scripting** und klicken auf den **Kompilieren-**&#x42;utton

<figure><img src="https://docs.agenatrader.com/~gitbook/image?url=https%3A%2F%2F1347375179-files.gitbook.io%2F%7E%2Ffiles%2Fv0%2Fb%2Fgitbook-legacy-files%2Fo%2Fassets%252F-MKZSsJBtSP9L4sqIe_q%252F-MPF2GKRtXhoOgYaA79S%252F-MPF4gjitivYVPTys5PT%252Fcompile.png%3Falt%3Dmedia%26token%3Dbcd52eab-a17a-44ea-8454-65abd188646a&#x26;width=768&#x26;dpr=4&#x26;quality=100&#x26;sign=c5011c66&#x26;sv=1" alt=""><figcaption></figcaption></figure>

**Wichtig!** In manchen Fällen können Sie Kompilierfehler-Meldungen erhalten. Hinweise, wie Sie dies lösen können, finden SIe auf dieser Seite [**Compile Error**](https://docs.agenatrader.com/german/faqs/mehr-faqs/compile-error)

* Bitte überprüfen Sie, an welchem Speicherort Sie Ihre Scripts abgelegt haben. Hier sollten Sie gespeichert sein: **C:\Users\\'User\_name'\Documents\AgenaTrader\UserCode\ folders: Indicators, Scanns, ScriptedConditions, Strategies oder AlertHandlers** (dies hängt vom Script-Typ ab). Sollten SIe diese an einem anderen Speicherort vorfinden, kopieren Sie sie in den Zielordner und klicken den **Kompilieren**-Button.

<figure><img src="https://docs.agenatrader.com/~gitbook/image?url=https%3A%2F%2F1347375179-files.gitbook.io%2F%7E%2Ffiles%2Fv0%2Fb%2Fgitbook-legacy-files%2Fo%2Fassets%252F-MKZSsJBtSP9L4sqIe_q%252F-MPF2GKRtXhoOgYaA79S%252F-MPF4ltfUgeXBd5woCRB%252FUserCode.png%3Falt%3Dmedia%26token%3Dbd12dc17-c2f0-498f-89f4-3679048ba5d8&#x26;width=768&#x26;dpr=4&#x26;quality=100&#x26;sign=2961b9c6&#x26;sv=1" alt=""><figcaption></figcaption></figure>

* Conditions können verschwinden, weil eines Ihrer Pakete nicht auf die aktuellste Version upgedated wurde. In diesem Fall gehen Sie bitte in **Tools -> Pakete -> Importierte Pakete.**

<figure><img src="https://docs.agenatrader.com/~gitbook/image?url=https%3A%2F%2F1347375179-files.gitbook.io%2F%7E%2Ffiles%2Fv0%2Fb%2Fgitbook-legacy-files%2Fo%2Fassets%252F-MKZSsJBtSP9L4sqIe_q%252F-MPF2GKRtXhoOgYaA79S%252F-MPF4pFLRIN91T-r_Vt5%252FPAckage.png%3Falt%3Dmedia%26token%3D24d41753-3e93-49bf-a59d-818bf4b81612&#x26;width=768&#x26;dpr=4&#x26;quality=100&#x26;sign=cc2f0634&#x26;sv=1" alt=""><figcaption></figcaption></figure>

Im geöffneten Tab überprüfen Sie bitte die Version Ihres AddOns. **Up-to-date** bedeutet, dass Ihr AddOn bereits upgedated ist.

<figure><img src="https://docs.agenatrader.com/~gitbook/image?url=https%3A%2F%2F1347375179-files.gitbook.io%2F%7E%2Ffiles%2Fv0%2Fb%2Fgitbook-legacy-files%2Fo%2Fassets%252F-MKZSsJBtSP9L4sqIe_q%252F-MPF2GKRtXhoOgYaA79S%252F-MPF4yl9EVQe2AxB6sIK%252F1.png%3Falt%3Dmedia%26token%3D045595d6-5c7f-4761-b678-dbe79bb30ec9&#x26;width=768&#x26;dpr=4&#x26;quality=100&#x26;sign=d549b1f4&#x26;sv=1" alt=""><figcaption></figcaption></figure>

**Update Available** bedeutet, dass Ihre Version veraltet ist.

<figure><img src="https://docs.agenatrader.com/~gitbook/image?url=https%3A%2F%2F1347375179-files.gitbook.io%2F%7E%2Ffiles%2Fv0%2Fb%2Fgitbook-legacy-files%2Fo%2Fassets%252F-MKZSsJBtSP9L4sqIe_q%252F-MPF2GKRtXhoOgYaA79S%252F-MPF53ipZc8Op5lqv6jP%252Fupdate.png%3Falt%3Dmedia%26token%3D8deefa17-f14d-44ec-bf70-327186e1870e&#x26;width=768&#x26;dpr=4&#x26;quality=100&#x26;sign=85401caf&#x26;sv=1" alt=""><figcaption></figcaption></figure>

Um upzudaten, klicken Sie den **Update Available** Button und bestätigen dann im Dialogfenster mit **Yes.**

<figure><img src="https://docs.agenatrader.com/~gitbook/image?url=https%3A%2F%2F1347375179-files.gitbook.io%2F%7E%2Ffiles%2Fv0%2Fb%2Fgitbook-legacy-files%2Fo%2Fassets%252F-MKZSsJBtSP9L4sqIe_q%252F-MPF2GKRtXhoOgYaA79S%252F-MPF56XwNOPTPfBO81IU%252FUpdate_routine.png%3Falt%3Dmedia%26token%3D2449b5dd-ab1d-479e-b7fa-2edb2de9520c&#x26;width=768&#x26;dpr=4&#x26;quality=100&#x26;sign=db45fc10&#x26;sv=1" alt=""><figcaption></figcaption></figure>


# Trading oder Orderübermittlung funktioniert nicht

## **Trading Funktionen sind deaktiviert** <a href="#trading-funktionen-sind-deaktiviert" id="trading-funktionen-sind-deaktiviert"></a>

#### **Problemstellung:** <a href="#problemstellung" id="problemstellung"></a>

Die Trading-Funktion im Chart-Kontextmenü und/oder die QuickSetup-Buttons sind deaktiviert:

<figure><img src="https://docs.agenatrader.com/~gitbook/image?url=https%3A%2F%2F1347375179-files.gitbook.io%2F%7E%2Ffiles%2Fv0%2Fb%2Fgitbook-legacy-files%2Fo%2Fassets%252F-MKZSsJBtSP9L4sqIe_q%252F-MPEsNvvtjP2k0b1-L-6%252F-MPEudZGYMarQV_m6M6i%252FTradingFunctions.png%3Falt%3Dmedia%26token%3D97568b7c-4f3b-405b-b132-76468b4413a3&#x26;width=768&#x26;dpr=4&#x26;quality=100&#x26;sign=613b5151&#x26;sv=1" alt=""><figcaption></figcaption></figure>

#### **Ursachen und Lösungsansätze:** <a href="#ursachen-und-losungsansatze" id="ursachen-und-losungsansatze"></a>

* Die Kontoeinstellungen zur Multibrokerage sind inkorrekt. -> Bitte überprüfen Sie, ob Sie in Tools -> Einstellungen -> Kontoverbindungen Ihren Broker sowie die gewünschten Assetklassen und Märkte aktiviert haben. Hier finden Sie wichtige Informationen zu den [Multibroker-Einstellungen](https://docs.agenatrader.com/german/general/multi-account-einstellungen).
* Sie sind nicht mit Ihrem Broker-Konto verbunden. -> Bitte stellen Sie in Haupt -> Verbindungen -> Verbinden die Kontoverbindung zu Ihrem Broker-Konto her.
* Die Handelszeiten bzw. -pausen wurden verstellt. -> Bitte überprüfen Sie im InstrumentEditor sowie im Allgemeine Einstellungen Ihre Einstellungen der Handelszeiten bzw. -pausen. Hier finden Sie wichtige Informationen zum [MarktplatzEscort](https://docs.agenatrader.com/german/menue-erklaerungen-and-inhalt/tool-menue/konfigurations-escort#Konfigurations_Escort__Marktplatz_Escort).
* Die vor- und nachbörslichen Handelszeiten wurden aktiviert. -> Bitte überprüfen Sie, ob Sie im MarktplatzEscort die [außerbörslichen Kursbewegungen](https://docs.agenatrader.com/german/menue-erklaerungen-and-inhalt/hauptmenue/chart-toolbar/wechsel-ausserboerslicher-modus) verändert und im Chart über den Toolbar-Button ![Prepost](https://docs.agenatrader.com/~gitbook/image?url=https%3A%2F%2F1347375179-files.gitbook.io%2F%7E%2Ffiles%2Fv0%2Fb%2Fgitbook-legacy-files%2Fo%2Fassets%252F-MKZSsJBtSP9L4sqIe_q%252F-MP9WizlMGepocaibx8N%252F-MP9bx727IvXlgJL6aoE%252Ficon10.png%3Falt%3Dmedia%26token%3D9322c0da-7cd0-4022-83d2-a0849b079668\&width=300\&dpr=4\&quality=100\&sign=d1d9ca4f\&sv=1) eingeschaltet haben und deaktivieren Sie diese Funktion.

## **Fehler beim Übermitteln einer Order** <a href="#fehler-beim-ubermitteln-einer-order" id="fehler-beim-ubermitteln-einer-order"></a>

**Problemstellung:**

Ihre Order wird nicht an den Broker übermittelt.

**Ursachen und Lösungsansätze:**

* Die Mappings wurden nicht oder nicht vollständig importiert oder sind falsch. Sie erhalten folgende Fehlermeldung:

<figure><img src="https://docs.agenatrader.com/~gitbook/image?url=https%3A%2F%2F1347375179-files.gitbook.io%2F%7E%2Ffiles%2Fv0%2Fb%2Fgitbook-legacy-files%2Fo%2Fassets%252F-MKZSsJBtSP9L4sqIe_q%252F-MPEsNvvtjP2k0b1-L-6%252F-MPEumWotJnaYfO29Gfg%252FSecurityDefinition.png%3Falt%3Dmedia%26token%3Dac61ae4e-ca18-41a1-956e-e3f4ed4c4f8a&#x26;width=768&#x26;dpr=4&#x26;quality=100&#x26;sign=e483537e&#x26;sv=1" alt=""><figcaption></figcaption></figure>

-> Bitte importieren Sie die Mappings neu. Sollte das Mapping für das entsprechende Instrument nach wie vor fehlen oder nicht korrekt sein, können Sie es im InstrumentEditor mit dem "Feedback"-Button und einer kurzen Anmerkung dazu anfordern.

* Die Ticksize im Instrument ist nicht korrekt eingestellt. Sie erhalten folgende Fehlermeldung:

<figure><img src="https://docs.agenatrader.com/~gitbook/image?url=https%3A%2F%2F1347375179-files.gitbook.io%2F%7E%2Ffiles%2Fv0%2Fb%2Fgitbook-legacy-files%2Fo%2Fassets%252F-MKZSsJBtSP9L4sqIe_q%252F-MPEsNvvtjP2k0b1-L-6%252F-MPEuqexdNK6GU3QtJkf%252FTicksizeError.png%3Falt%3Dmedia%26token%3D688ee23b-1eb8-4f2e-953d-4ff8780ef11a&#x26;width=768&#x26;dpr=4&#x26;quality=100&#x26;sign=34b273b8&#x26;sv=1" alt=""><figcaption></figcaption></figure>

-> Bitte passen Sie die Ticksize an die des Brokers an. Sie finden die entsprechenden Informationen auf der Website bzw in der Referenzplattform Ihres Brokers.

* Ihre Kontogröße ist nicht ausreichend für die Ordergröße. -> Bitte buchen Sie Geld auf Ihr Broker-Konto oder verringern Sie die Ordersize.
* Die Margin-Anforderungen Ihres Brokers sind nicht erfüllt. -> Bitte buchen Sie Geld auf Ihr Broker-Konto oder schließen Sie offene Positionen.


# IB chart missing candles or not loading

**Problemstellung**

**Was ist passiert?**

* AgenaTrader gibt per PopUp eine Warnung aus:

<figure><img src="https://docs.agenatrader.com/~gitbook/image?url=https%3A%2F%2F1347375179-files.gitbook.io%2F%7E%2Ffiles%2Fv0%2Fb%2Fgitbook-legacy-files%2Fo%2Fassets%252F-MKZSsJBtSP9L4sqIe_q%252F-MPEsNvvtjP2k0b1-L-6%252F-MPEvEEetFJDGOf0p4al%252FHistorienRequestOverflow.png%3Falt%3Dmedia%26token%3D75c1cb9a-681b-4d50-ac26-6ad5dafe30dc&#x26;width=768&#x26;dpr=4&#x26;quality=100&#x26;sign=9ee67c32&#x26;sv=1" alt=""><figcaption></figcaption></figure>

* Charts werden teilweise nicht richtig dargestellt und enthalten fehlerhafte Daten
* Historien fehlen und Charts ticken nicht

**Was bedeutet das?**

Die maximale Anzahl der gleichzeitig offenen historischen Daten-Requests von der IB API beträgt 50. Daher sollten Sie darauf achten, dass Sie eine kleinere Anzahl von Anfragen gleichzeitig anstehend haben.

**Pacing Violations bei kleinen Bars (30 Sekunden oder weniger)** Eine Pacing Violation tritt auf, wenn Sie eine oder mehrere der folgenden Einschränkungen nicht beachten: -> Identische Abfrage historischer Daten innerhalb von 15 Sekunden. -> Sechs oder mehr historische Daten-Requests für denselben Contract, Exchange und Tick Typ innerhalb von zwei Sekunden. -> Mehr als 60 Anfragen innerhalb eines Zeitraums von zehn Minuten.

Seien Sie jedoch vorsichtig, wenn Sie große Mengen an historischen Daten anfordern oder historische Daten-Requests senden, da weiterhin ein "Soft Limit" implementiert ist. Wenn Sie zu viele historische Daten anfordern, werden Sie vom API-Client getrennt. Weitere Informationen zu den Tempoverstößen für kleine Balken finden Sie [in diesem IB-Artikel](https://interactivebrokers.github.io/tws-api/historical_limitations.html).

*Hinweis:*

1 Instrument in 3 Zeiteinheiten = 3 Historien 1 Analyzer Escort Spalte = 1 Historie Watchlisten, Backtest-Listen, Indikatoren und Alarme benötigen evenfalls Historien.

**Lösungsmöglichkeiten**

Reduzieren Sie Ihre Instrumente und historische Anfragen an den Interactive Broker Server. Beachten Sie dabei den grünen Verbindungsbalken links unten in Ihrem AgenaTrader:

![](https://docs.agenatrader.com/~gitbook/image?url=https%3A%2F%2F1347375179-files.gitbook.io%2F%7E%2Ffiles%2Fv0%2Fb%2Fgitbook-legacy-files%2Fo%2Fassets%252F-MKZSsJBtSP9L4sqIe_q%252F-MPEsNvvtjP2k0b1-L-6%252F-MPEvIk3zMGd8jTgwhAS%252FVerbindungsbalken.png%3Falt%3Dmedia%26token%3Dda177b86-41ae-4550-9d82-73b19268c4da\&width=768\&dpr=4\&quality=100\&sign=3a98536a\&sv=1)

Weitere Historien können nach erstmaliger Verbindung alle 10 Minuten angefordert werden. Bitte beachten Sie jedoch: Daten neu laden würde dann aber zu einem erneuten Historien Overflow führen.

Alternativ dazu würde sich auch ein externer - in den meisten Fällen jedoch kostenpflichtiger - Datenfeed empfehlen.

Hier geht es zur [Datenfeed Übersicht](https://agenatrader.com/de/marktdaten-echtzeit/).

Gilt auch für CapTrader, Banx, Lynx und andere Broker, welche an die API Schnittstellen der TWS anbinden.


# Broker- und Datenfeed-Einstellungen bei IB

**Kann ich mit IB als Broker auch einen zusätzlichen Datenfeed anbinden?**

Sie können den Datenfeed von Interactive Brokers nutzen, sind hier jedoch hinsichtlich der Historien etwas eingeschränkt. Lesen Sie mehr zum Historien Request Overflow sowie die alle wichtigen Details über Interactive Brokers in den [Essential Informations von IB](https://docs.agenatrader.com/german/general/technology-provider#Technology_Provider__Interactive_Brokers__de_).

Daher haben Sie im AgenaTrader die Möglichkeit, einen zusätzlichen Profi-Datenfeed (Teletrader, Taipan, Barchart, IQFeed) anzubinden. Dazu benötigen Sie einen Account beim jeweiligen Anbieter.

Unter Haupt -> Verbindungen können Sie mit "neues Konto hinzufügen" direkt in der Software den Datenfeed als Verbindung anlegen:

<figure><img src="https://docs.agenatrader.com/~gitbook/image?url=https%3A%2F%2F1347375179-files.gitbook.io%2F%7E%2Ffiles%2Fv0%2Fb%2Fgitbook-legacy-files%2Fo%2Fassets%252F-MKZSsJBtSP9L4sqIe_q%252F-MPEsNvvtjP2k0b1-L-6%252F-MPEw9w3ofdym_yvqObJ%252FZuKontohinzuf%25C3%25BCgen.png%3Falt%3Dmedia%26token%3Da5d60ecb-ea1f-4232-bcc6-484eadb96f72&#x26;width=768&#x26;dpr=4&#x26;quality=100&#x26;sign=9c8b4c31&#x26;sv=1" alt=""><figcaption></figcaption></figure>

Wählen Sie Ihren Datenfeed aus, weisen Sie ihm einen Verbindungsnamen zu (der Einfachheit halber empfehlen wir, den Datenfeed-Namen als Verbindungsnamen zu wählen) und geben Sie im Kontext-Fenster Ihre Zugangsdaten ein.

**Achtung!** Nun ist es wichtig, dass Sie in den Kontoverbindungen definieren, welche Daten Sie vom Datenfeed-Provider bzw IB erhalten möchten. Dies ist deshalb relevant, weil die IB Index-CFDs nicht von einem externen Datenfeed angefragt werden können, sondern von IB direkt.

**Beispiel: Taipan als Datenfeed-Anbieter**

In den Kontoverbindungen, im Tab "Verbindungen" müssen Sie nun IB als Datenfeed und Broker aktivieren, Taipan nur als Datenfeed:

<figure><img src="https://docs.agenatrader.com/~gitbook/image?url=https%3A%2F%2F1347375179-files.gitbook.io%2F%7E%2Ffiles%2Fv0%2Fb%2Fgitbook-legacy-files%2Fo%2Fassets%252F-MKZSsJBtSP9L4sqIe_q%252F-MPEsNvvtjP2k0b1-L-6%252F-MPEwEF2yNmHhfx-JQ4U%252FBSPVerbindungen.png%3Falt%3Dmedia%26token%3Da3a8e064-30bd-40a2-99d1-698d63b63d23&#x26;width=768&#x26;dpr=4&#x26;quality=100&#x26;sign=5295d121&#x26;sv=1" alt=""><figcaption></figcaption></figure>

Nun müssen im Tab "Datenfeeds" die Instrumenten-Typen definiert werden. Dabei ist darauf zu achten, dass nicht dieselben Instrumententypen angewählt werden, da dies zu einer Fehlermeldung führen würde, wenn Sie im Anschluss sowohl IB als auch Taipan gleichzeitig mit dem AgenaTrader verbinden. Wählen Sie daher bei IB nur "CFD" und bei Taipan alle jene Instrumententypen, für die Sie Daten abonniert haben. Achten Sie dabei darauf, CFD *nicht* anzuklicken:

<figure><img src="https://docs.agenatrader.com/~gitbook/image?url=https%3A%2F%2F1347375179-files.gitbook.io%2F%7E%2Ffiles%2Fv0%2Fb%2Fgitbook-legacy-files%2Fo%2Fassets%252F-MKZSsJBtSP9L4sqIe_q%252F-MPEsNvvtjP2k0b1-L-6%252F-MPEwKCSewwfg13qhTCj%252FDF.png%3Falt%3Dmedia%26token%3D27c868ed-f500-4402-8ac7-536c5f17d9b8&#x26;width=768&#x26;dpr=4&#x26;quality=100&#x26;sign=a3456c55&#x26;sv=1" alt=""><figcaption></figcaption></figure>

Eine ausführliche Anleitung zum Thema Multibrokerage und Datenfeeds finden Sie in diesem [Webinar](https://www.youtube.com/watch?v=c1kshs3HO-U\&t=12s\&index=28\&list=PLLftyBhQjHrX0Qpi--gcLZEh3YojWGZ53)


# Kontakt Support

## Effiziente Fehlerbehebung vor der Kontaktaufnahme mit dem Support

Falls Sie auf ein Problem mit AgenaTrader stoßen, empfehlen wir Ihnen, zunächst mögliche Ursachen selbst zu überprüfen, bevor Sie den Support kontaktieren. Unser **technischer Support** ist speziell für die **Behebung von Systemfehlern und technischen Problemen** der Software zuständig. Er kann daher **keine individuelle Schulung oder Hilfe zu allgemeinen Einstellungen und zur Bedienung der Plattform** anbieten. Anfragen dieser Art können zu **längeren Antwortzeiten** für alle Nutzer führen – also auch für Sie.

In vielen Fällen lassen sich Probleme durch eine **kurze Überprüfung der Einstellungen, Konfigurationen oder bereits bekannte Lösungen** schnell beheben. Selbst erfahrene Entwickler stellen oft fest, dass die Ursache eines Problems nicht in der Software, sondern in einer bestimmten Konfiguration liegt – ein kurzer Check kann also oft schon zur Lösung führen.

Um Ihnen bei der Fehlerbehebung zu helfen, stellen wir Ihnen **ausführliche Dokumentationen, FAQs, Tutorials und unsere Community auf Discord** zur Verfügung. Dort finden Sie hilfreiche Anleitungen und können sich mit anderen Nutzern sowie unserem Team austauschen, um das Beste aus AgenaTrader herauszuholen – und gleichzeitig Wartezeiten auf Support-Antworten zu minimieren.

### **Wenn Probleme auftauchen...**

...bzw. etwas nicht so funktioniert wie erwartet, dann versuchen Sie bitte zuerst sicherzustellen, dass Sie:

1. Die aktuellste Version besitzen, welche in den Release-Notes beschrieben ist.
2. Ihre Fragen zu Ihrem Problem zunächst in der OnlineHilfe zu beantworten versuchen.
3. Nur danach wird es empfohlen sich an das Support-Team zu wenden. Wir möchten die Email-Kommunikation auf tradingkritische Fälle beschränken.

*In 9 von 10 Fällen finden Sie Hilfe in unseren* [*FAQs*](/german/einfuhrung/faq)*.*

## Effiziente Einreichung eines Support-Tickets

Um eine Support-Anfrage zu stellen, klicken Sie bitte auf den **kleinen Pfeil neben „Support“** in der **Toolbar** und wählen Sie im Dropdown-Menü **„Verkaufs-/Support-Ticket erstellen“**.

* Wählen Sie die **passende Kategorie und Unterkategorie**
* Geben Sie eine **detaillierte Beschreibung** Ihrer Anfrage an
* Fügen Sie **Screenshots** hinzu, falls relevant

Sobald wir Ihre Anfrage und die zugehörigen Daten erhalten haben, wird diese **je nach Anliegen an unser Test-Team weitergeleitet oder direkt bearbeitet**.

**Wichtige Hinweise zur weiteren Kommunikation**

* Die weitere **Kommunikation mit dem Support-Team erfolgt per E-Mail**.
* Für **neue Probleme, Anfragen oder technische Schwierigkeiten** erstellen Sie bitte **immer ein neues Ticket**, um eine **reibungslose und vollständige Bearbeitung** sicherzustellen.

Wir verstehen, dass es manchmal Geduld erfordert, bis eine Lösung gefunden wird. Unser Team arbeitet so schnell wie möglich, aber die **Analyse, Behebung und abschließende Prüfung eines technischen Problems** erfordert Sorgfalt und kann etwas Zeit in Anspruch nehmen.

Auch wenn wir Ihr Interesse an einer schnellen Lösung nachvollziehen können, führen **mehrfache Rückfragen nicht zu einer schnelleren Bearbeitung** – im Gegenteil, sie können den Prozess sogar **verzögern**. Sobald ein Ticket an die Testabteilung weitergeleitet wird, ist es für das Support-Team nicht mehr sichtbar. **Unnötige Nachfragen können dazu führen, dass Tickets zwischen den Abteilungen hin und her verschoben werden**, was wiederum Verzögerungen verursacht.

Um eine **schnelle und effiziente Bearbeitung** sicherzustellen, bitten wir Sie daher, **von wiederholten Nachfragen abzusehen oder kein neues Ticket für dasselbe Problem zu eröffnen**, es sei denn, Sie haben wirklich **wesentliche neue Informationen**, die zur Lösung beitragen.

Vielen Dank für Ihr Verständnis und Ihre Kooperation!

<div data-full-width="false"><figure><img src="/files/K9nK4N8TLWEBVuGR0UK7" alt=""><figcaption></figcaption></figure></div>

{% hint style="info" %}
**Achtung:** Support-Anfragen können nur über die AgenaTrader-Plattform abgesandt werden. Einzig für den – äußerst selten auftretenden – Fall, dass die Plattform sich nicht mehr starten lässt, steht Ihnen auf unserer Website eine *Notfall-Kontakt-Adresse* zur Verfügung, über die das Support-Team in diesen Ausnahmefällen erreichbar ist.
{% endhint %}

| Name                     | Definition                                                                                                               |
| ------------------------ | ------------------------------------------------------------------------------------------------------------------------ |
| Log files                | Wenn aktiviert, werden die Log-Files der letzten 14 Tage (Standard-Einstellung, kann erweitert werden) gesandt           |
| Orders Log               | Wenn aktiviert, werden die gesamten Order-Logs der letzten 30 Tage (Standard-Einstellung, kann erweitert werden) gesandt |
| Active workspace         | Wenn aktiviert, wird der gerade genutzte Workspace gesandt.                                                              |
| Configs                  | Wenn aktiviert, wird das gesamte Konfigurations-File gesandt (TE\_Config.xml).                                           |
| Current Open Instruments | Wenn aktiviert, werden die Daten aller offenen Instrumente gesandt(Tickgröße, Punktwert, etc)                            |
| Complete UserDirectory   | Wenn aktiviert, wird das gesamte User-Verzeichnis gesandt.                                                               |
| Complete DataDirectory   | Wenn aktiviert, wird das gesamte Daten-Verzeichnis gesandt.                                                              |

**Unhandled Exception (Fehlermeldung an den Support)**

Unhandled Exeption = unbehandelte Ausnahme Sollte AgenaTrader einen internen Fehler produzieren, so öffnet sich ein Popup, in dem der sogenannte Stack-Trace ersichtlich ist, an dem wir erkennen wo der Fehler aufgetreten ist. Diese Information ist für uns sehr wichtig um AgenaTrader zu stabilisieren. Sollten Sie jemals so ein Popup bekommen, so übermitteln Sie uns diesen Fehler bitte indem Sie den **Send Error**-Button klicken. Wir erhalten anschließend ein e-mail mit der Stack-Trace Information und leiten diese an die zuständigen Techniker weiter. Sie erhalten *keine Rückmeldung* vom Support-Team. Wird ein Bug festgestellt, so wird er in den meisten Fällen mit einem der nächsten Updates behoben sein.

![](https://docs.agenatrader.com/~gitbook/image?url=https%3A%2F%2F1347375179-files.gitbook.io%2F%7E%2Ffiles%2Fv0%2Fb%2Fgitbook-legacy-files%2Fo%2Fassets%252F-MKZSsJBtSP9L4sqIe_q%252F-MPElnpY0ZCxaCMSy0gq%252F-MPEqg2BNsKxblt2VuwM%252Fbug.png%3Falt%3Dmedia%26token%3Ddec2cc51-0ff5-4988-b047-f8f04b402c4f\&width=768\&dpr=4\&quality=100\&sign=c8a68ec4\&sv=1)

{% hint style="warning" %}
**Wichtig!**

Sie haben XX% Ihres Arbeitsspeichers erreicht. Dies ist ein kritischer Wert! Wenn möglich, schließen Sie bitte alle speicherintensiven Anwendungen oder ändern Sie Ihren AgenaTrader-Arbeitsbereich, indem Sie einige Listen/Tabellen Chart-Gruppen, Analyzer Escort Columns, etc. schließen.

Es bedeutet, dass AgenaTrader den maximalen Arbeitsspeicher Ihres PCs verwendet. Bitte folgen Sie den Anweisungen und schließen Sie alle speicherintensiven Anwendungen oder ändern Sie Ihren AT-Arbeitsbereich.
{% endhint %}


# Broker und Datenfeed

## Allgemeine Informationen

Die Wahl des Brokers bzw. des Datenfeed-Anbieters ist von essenzieller Wichtigkeit. Daher möchten wir dies, noch vor der eigentlichen Onlinehilfe für den AgenaTrader, thematisieren.

Bei der Wahl des Brokers bzw. Datenfeeds handelt es sich um eine grundlegende Entscheidung. Die Auswahl des richtigen Brokers erfordert eine intensive Auseinandersetzung mit der Frage, was Sie handeln möchten.

*Wenn Sie sich noch nicht für einen Broker oder Datenfeed entschieden haben, sollten Sie sich einige Fragen stellen:*

1. In welcher Zeiteinheit möchten Sie handeln (benötigen Sie z.B. Tickdaten: Ja/Nein).
2. Wie sind die Spreads/Gebühren des Brokers aufgebaut.
3. Welche Instrumenten-Typen stellt der Broker zu Verfügung (CFDs, Forex, Aktien, Futures, usw.).

**Nachfolgend möchten wir Ihnen einen ersten Überblick verschaffen, damit Sie sich danach intensiv mit der Broker- & Datenfeedauswahl beschäftigen können:**

|                     | Broker                                                                                                                                                                                                                                | Data Feed                                                                                                                                                                                                                              | Tick data                                                                                                                                                                                                                             | Intraday                                                                                                                                                                                                                              | End of Day                                                                                                                                                                                                                            | CFDs                                                                                                                                                                                                                                   | Forex                                                                                                                                                                                                                                 | Shares                                                                                                                                                                                                                                | Futures                                                                                                                                                                                                                               |
| ------------------- | ------------------------------------------------------------------------------------------------------------------------------------------------------------------------------------------------------------------------------------- | -------------------------------------------------------------------------------------------------------------------------------------------------------------------------------------------------------------------------------------- | ------------------------------------------------------------------------------------------------------------------------------------------------------------------------------------------------------------------------------------- | ------------------------------------------------------------------------------------------------------------------------------------------------------------------------------------------------------------------------------------- | ------------------------------------------------------------------------------------------------------------------------------------------------------------------------------------------------------------------------------------- | -------------------------------------------------------------------------------------------------------------------------------------------------------------------------------------------------------------------------------------- | ------------------------------------------------------------------------------------------------------------------------------------------------------------------------------------------------------------------------------------- | ------------------------------------------------------------------------------------------------------------------------------------------------------------------------------------------------------------------------------------- | ------------------------------------------------------------------------------------------------------------------------------------------------------------------------------------------------------------------------------------- |
| Interactive Brokers | ![Blue Checkmark Ms](https://files.gitbook.com/v0/b/gitbook-legacy-files/o/assets%2F-MKZSsJBtSP9L4sqIe_q%2F-MPcdoF_aq80xKbOxNil%2F-MPcgrVqXQ0BHVq78Gxx%2Fblue_checkmark_ms.png?alt=media\&token=29bb30d2-ce12-4579-b668-a655cbadf491) | ![Blue Checkmark Ms](https://files.gitbook.com/v0/b/gitbook-legacy-files/o/assets%2F-MKZSsJBtSP9L4sqIe_q%2F-MPcdoF_aq80xKbOxNil%2F-MPcgrVqXQ0BHVq78Gxx%2Fblue_checkmark_ms.png?alt=media\&token=29bb30d2-ce12-4579-b668-a655cbadf491)1 | -                                                                                                                                                                                                                                     | ![Blue Checkmark Ms](https://files.gitbook.com/v0/b/gitbook-legacy-files/o/assets%2F-MKZSsJBtSP9L4sqIe_q%2F-MPcdoF_aq80xKbOxNil%2F-MPcgrVqXQ0BHVq78Gxx%2Fblue_checkmark_ms.png?alt=media\&token=29bb30d2-ce12-4579-b668-a655cbadf491) | ![Blue Checkmark Ms](https://files.gitbook.com/v0/b/gitbook-legacy-files/o/assets%2F-MKZSsJBtSP9L4sqIe_q%2F-MPcdoF_aq80xKbOxNil%2F-MPcgrVqXQ0BHVq78Gxx%2Fblue_checkmark_ms.png?alt=media\&token=29bb30d2-ce12-4579-b668-a655cbadf491) | ![Blue Checkmark Ms](https://files.gitbook.com/v0/b/gitbook-legacy-files/o/assets%2F-MKZSsJBtSP9L4sqIe_q%2F-MPcdoF_aq80xKbOxNil%2F-MPcgrVqXQ0BHVq78Gxx%2Fblue_checkmark_ms.png?alt=media\&token=29bb30d2-ce12-4579-b668-a655cbadf491)2 | ![Blue Checkmark Ms](https://files.gitbook.com/v0/b/gitbook-legacy-files/o/assets%2F-MKZSsJBtSP9L4sqIe_q%2F-MPcdoF_aq80xKbOxNil%2F-MPcgrVqXQ0BHVq78Gxx%2Fblue_checkmark_ms.png?alt=media\&token=29bb30d2-ce12-4579-b668-a655cbadf491) | ![Blue Checkmark Ms](https://files.gitbook.com/v0/b/gitbook-legacy-files/o/assets%2F-MKZSsJBtSP9L4sqIe_q%2F-MPcdoF_aq80xKbOxNil%2F-MPcgrVqXQ0BHVq78Gxx%2Fblue_checkmark_ms.png?alt=media\&token=29bb30d2-ce12-4579-b668-a655cbadf491) | ![Blue Checkmark Ms](https://files.gitbook.com/v0/b/gitbook-legacy-files/o/assets%2F-MKZSsJBtSP9L4sqIe_q%2F-MPcdoF_aq80xKbOxNil%2F-MPcgrVqXQ0BHVq78Gxx%2Fblue_checkmark_ms.png?alt=media\&token=29bb30d2-ce12-4579-b668-a655cbadf491) |
| AgenaBroker         | ![Blue Checkmark Ms](https://files.gitbook.com/v0/b/gitbook-legacy-files/o/assets%2F-MKZSsJBtSP9L4sqIe_q%2F-MPcdoF_aq80xKbOxNil%2F-MPcgrVqXQ0BHVq78Gxx%2Fblue_checkmark_ms.png?alt=media\&token=29bb30d2-ce12-4579-b668-a655cbadf491) | ![Blue Checkmark Ms](https://files.gitbook.com/v0/b/gitbook-legacy-files/o/assets%2F-MKZSsJBtSP9L4sqIe_q%2F-MPcdoF_aq80xKbOxNil%2F-MPcgrVqXQ0BHVq78Gxx%2Fblue_checkmark_ms.png?alt=media\&token=29bb30d2-ce12-4579-b668-a655cbadf491)1 | -                                                                                                                                                                                                                                     | ![Blue Checkmark Ms](https://files.gitbook.com/v0/b/gitbook-legacy-files/o/assets%2F-MKZSsJBtSP9L4sqIe_q%2F-MPcdoF_aq80xKbOxNil%2F-MPcgrVqXQ0BHVq78Gxx%2Fblue_checkmark_ms.png?alt=media\&token=29bb30d2-ce12-4579-b668-a655cbadf491) | ![Blue Checkmark Ms](https://files.gitbook.com/v0/b/gitbook-legacy-files/o/assets%2F-MKZSsJBtSP9L4sqIe_q%2F-MPcdoF_aq80xKbOxNil%2F-MPcgrVqXQ0BHVq78Gxx%2Fblue_checkmark_ms.png?alt=media\&token=29bb30d2-ce12-4579-b668-a655cbadf491) | ![Blue Checkmark Ms](https://files.gitbook.com/v0/b/gitbook-legacy-files/o/assets%2F-MKZSsJBtSP9L4sqIe_q%2F-MPcdoF_aq80xKbOxNil%2F-MPcgrVqXQ0BHVq78Gxx%2Fblue_checkmark_ms.png?alt=media\&token=29bb30d2-ce12-4579-b668-a655cbadf491)2 | ![Blue Checkmark Ms](https://files.gitbook.com/v0/b/gitbook-legacy-files/o/assets%2F-MKZSsJBtSP9L4sqIe_q%2F-MPcdoF_aq80xKbOxNil%2F-MPcgrVqXQ0BHVq78Gxx%2Fblue_checkmark_ms.png?alt=media\&token=29bb30d2-ce12-4579-b668-a655cbadf491) | ![Blue Checkmark Ms](https://files.gitbook.com/v0/b/gitbook-legacy-files/o/assets%2F-MKZSsJBtSP9L4sqIe_q%2F-MPcdoF_aq80xKbOxNil%2F-MPcgrVqXQ0BHVq78Gxx%2Fblue_checkmark_ms.png?alt=media\&token=29bb30d2-ce12-4579-b668-a655cbadf491) | ![Blue Checkmark Ms](https://files.gitbook.com/v0/b/gitbook-legacy-files/o/assets%2F-MKZSsJBtSP9L4sqIe_q%2F-MPcdoF_aq80xKbOxNil%2F-MPcgrVqXQ0BHVq78Gxx%2Fblue_checkmark_ms.png?alt=media\&token=29bb30d2-ce12-4579-b668-a655cbadf491) |
| CapTrader           | ![Blue Checkmark Ms](https://files.gitbook.com/v0/b/gitbook-legacy-files/o/assets%2F-MKZSsJBtSP9L4sqIe_q%2F-MPcdoF_aq80xKbOxNil%2F-MPcgrVqXQ0BHVq78Gxx%2Fblue_checkmark_ms.png?alt=media\&token=29bb30d2-ce12-4579-b668-a655cbadf491) | ![Blue Checkmark Ms](https://files.gitbook.com/v0/b/gitbook-legacy-files/o/assets%2F-MKZSsJBtSP9L4sqIe_q%2F-MPcdoF_aq80xKbOxNil%2F-MPcgrVqXQ0BHVq78Gxx%2Fblue_checkmark_ms.png?alt=media\&token=29bb30d2-ce12-4579-b668-a655cbadf491)1 | -                                                                                                                                                                                                                                     | ![Blue Checkmark Ms](https://files.gitbook.com/v0/b/gitbook-legacy-files/o/assets%2F-MKZSsJBtSP9L4sqIe_q%2F-MPcdoF_aq80xKbOxNil%2F-MPcgrVqXQ0BHVq78Gxx%2Fblue_checkmark_ms.png?alt=media\&token=29bb30d2-ce12-4579-b668-a655cbadf491) | ![Blue Checkmark Ms](https://files.gitbook.com/v0/b/gitbook-legacy-files/o/assets%2F-MKZSsJBtSP9L4sqIe_q%2F-MPcdoF_aq80xKbOxNil%2F-MPcgrVqXQ0BHVq78Gxx%2Fblue_checkmark_ms.png?alt=media\&token=29bb30d2-ce12-4579-b668-a655cbadf491) | ![Blue Checkmark Ms](https://files.gitbook.com/v0/b/gitbook-legacy-files/o/assets%2F-MKZSsJBtSP9L4sqIe_q%2F-MPcdoF_aq80xKbOxNil%2F-MPcgrVqXQ0BHVq78Gxx%2Fblue_checkmark_ms.png?alt=media\&token=29bb30d2-ce12-4579-b668-a655cbadf491)2 | ![Blue Checkmark Ms](https://files.gitbook.com/v0/b/gitbook-legacy-files/o/assets%2F-MKZSsJBtSP9L4sqIe_q%2F-MPcdoF_aq80xKbOxNil%2F-MPcgrVqXQ0BHVq78Gxx%2Fblue_checkmark_ms.png?alt=media\&token=29bb30d2-ce12-4579-b668-a655cbadf491) | ![Blue Checkmark Ms](https://files.gitbook.com/v0/b/gitbook-legacy-files/o/assets%2F-MKZSsJBtSP9L4sqIe_q%2F-MPcdoF_aq80xKbOxNil%2F-MPcgrVqXQ0BHVq78Gxx%2Fblue_checkmark_ms.png?alt=media\&token=29bb30d2-ce12-4579-b668-a655cbadf491) | ![Blue Checkmark Ms](https://files.gitbook.com/v0/b/gitbook-legacy-files/o/assets%2F-MKZSsJBtSP9L4sqIe_q%2F-MPcdoF_aq80xKbOxNil%2F-MPcgrVqXQ0BHVq78Gxx%2Fblue_checkmark_ms.png?alt=media\&token=29bb30d2-ce12-4579-b668-a655cbadf491) |
| Dukascopy           | ![Blue Checkmark Ms](https://files.gitbook.com/v0/b/gitbook-legacy-files/o/assets%2F-MKZSsJBtSP9L4sqIe_q%2F-MPcdoF_aq80xKbOxNil%2F-MPcgrVqXQ0BHVq78Gxx%2Fblue_checkmark_ms.png?alt=media\&token=29bb30d2-ce12-4579-b668-a655cbadf491) | ![Blue Checkmark Ms](https://files.gitbook.com/v0/b/gitbook-legacy-files/o/assets%2F-MKZSsJBtSP9L4sqIe_q%2F-MPcdoF_aq80xKbOxNil%2F-MPcgrVqXQ0BHVq78Gxx%2Fblue_checkmark_ms.png?alt=media\&token=29bb30d2-ce12-4579-b668-a655cbadf491)  | ![Blue Checkmark Ms](https://files.gitbook.com/v0/b/gitbook-legacy-files/o/assets%2F-MKZSsJBtSP9L4sqIe_q%2F-MPcdoF_aq80xKbOxNil%2F-MPcgrVqXQ0BHVq78Gxx%2Fblue_checkmark_ms.png?alt=media\&token=29bb30d2-ce12-4579-b668-a655cbadf491) | ![Blue Checkmark Ms](https://files.gitbook.com/v0/b/gitbook-legacy-files/o/assets%2F-MKZSsJBtSP9L4sqIe_q%2F-MPcdoF_aq80xKbOxNil%2F-MPcgrVqXQ0BHVq78Gxx%2Fblue_checkmark_ms.png?alt=media\&token=29bb30d2-ce12-4579-b668-a655cbadf491) | ![Blue Checkmark Ms](https://files.gitbook.com/v0/b/gitbook-legacy-files/o/assets%2F-MKZSsJBtSP9L4sqIe_q%2F-MPcdoF_aq80xKbOxNil%2F-MPcgrVqXQ0BHVq78Gxx%2Fblue_checkmark_ms.png?alt=media\&token=29bb30d2-ce12-4579-b668-a655cbadf491) | ![Blue Checkmark Ms](https://files.gitbook.com/v0/b/gitbook-legacy-files/o/assets%2F-MKZSsJBtSP9L4sqIe_q%2F-MPcdoF_aq80xKbOxNil%2F-MPcgrVqXQ0BHVq78Gxx%2Fblue_checkmark_ms.png?alt=media\&token=29bb30d2-ce12-4579-b668-a655cbadf491)  | ![Blue Checkmark Ms](https://files.gitbook.com/v0/b/gitbook-legacy-files/o/assets%2F-MKZSsJBtSP9L4sqIe_q%2F-MPcdoF_aq80xKbOxNil%2F-MPcgrVqXQ0BHVq78Gxx%2Fblue_checkmark_ms.png?alt=media\&token=29bb30d2-ce12-4579-b668-a655cbadf491) | -                                                                                                                                                                                                                                     | -                                                                                                                                                                                                                                     |
| FXCM                | ![Blue Checkmark Ms](https://files.gitbook.com/v0/b/gitbook-legacy-files/o/assets%2F-MKZSsJBtSP9L4sqIe_q%2F-MPcdoF_aq80xKbOxNil%2F-MPcgrVqXQ0BHVq78Gxx%2Fblue_checkmark_ms.png?alt=media\&token=29bb30d2-ce12-4579-b668-a655cbadf491) | ![Blue Checkmark Ms](https://files.gitbook.com/v0/b/gitbook-legacy-files/o/assets%2F-MKZSsJBtSP9L4sqIe_q%2F-MPcdoF_aq80xKbOxNil%2F-MPcgrVqXQ0BHVq78Gxx%2Fblue_checkmark_ms.png?alt=media\&token=29bb30d2-ce12-4579-b668-a655cbadf491)  | ![Blue Checkmark Ms](https://files.gitbook.com/v0/b/gitbook-legacy-files/o/assets%2F-MKZSsJBtSP9L4sqIe_q%2F-MPcdoF_aq80xKbOxNil%2F-MPcgrVqXQ0BHVq78Gxx%2Fblue_checkmark_ms.png?alt=media\&token=29bb30d2-ce12-4579-b668-a655cbadf491) | ![Blue Checkmark Ms](https://files.gitbook.com/v0/b/gitbook-legacy-files/o/assets%2F-MKZSsJBtSP9L4sqIe_q%2F-MPcdoF_aq80xKbOxNil%2F-MPcgrVqXQ0BHVq78Gxx%2Fblue_checkmark_ms.png?alt=media\&token=29bb30d2-ce12-4579-b668-a655cbadf491) | ![Blue Checkmark Ms](https://files.gitbook.com/v0/b/gitbook-legacy-files/o/assets%2F-MKZSsJBtSP9L4sqIe_q%2F-MPcdoF_aq80xKbOxNil%2F-MPcgrVqXQ0BHVq78Gxx%2Fblue_checkmark_ms.png?alt=media\&token=29bb30d2-ce12-4579-b668-a655cbadf491) | ![Blue Checkmark Ms](https://files.gitbook.com/v0/b/gitbook-legacy-files/o/assets%2F-MKZSsJBtSP9L4sqIe_q%2F-MPcdoF_aq80xKbOxNil%2F-MPcgrVqXQ0BHVq78Gxx%2Fblue_checkmark_ms.png?alt=media\&token=29bb30d2-ce12-4579-b668-a655cbadf491)  | ![Blue Checkmark Ms](https://files.gitbook.com/v0/b/gitbook-legacy-files/o/assets%2F-MKZSsJBtSP9L4sqIe_q%2F-MPcdoF_aq80xKbOxNil%2F-MPcgrVqXQ0BHVq78Gxx%2Fblue_checkmark_ms.png?alt=media\&token=29bb30d2-ce12-4579-b668-a655cbadf491) | -                                                                                                                                                                                                                                     | -                                                                                                                                                                                                                                     |
| BarChart            | -                                                                                                                                                                                                                                     | ![Blue Checkmark Ms](https://files.gitbook.com/v0/b/gitbook-legacy-files/o/assets%2F-MKZSsJBtSP9L4sqIe_q%2F-MPcdoF_aq80xKbOxNil%2F-MPcgrVqXQ0BHVq78Gxx%2Fblue_checkmark_ms.png?alt=media\&token=29bb30d2-ce12-4579-b668-a655cbadf491)  | ![Blue Checkmark Ms](https://files.gitbook.com/v0/b/gitbook-legacy-files/o/assets%2F-MKZSsJBtSP9L4sqIe_q%2F-MPcdoF_aq80xKbOxNil%2F-MPcgrVqXQ0BHVq78Gxx%2Fblue_checkmark_ms.png?alt=media\&token=29bb30d2-ce12-4579-b668-a655cbadf491) | ![Blue Checkmark Ms](https://files.gitbook.com/v0/b/gitbook-legacy-files/o/assets%2F-MKZSsJBtSP9L4sqIe_q%2F-MPcdoF_aq80xKbOxNil%2F-MPcgrVqXQ0BHVq78Gxx%2Fblue_checkmark_ms.png?alt=media\&token=29bb30d2-ce12-4579-b668-a655cbadf491) | ![Blue Checkmark Ms](https://files.gitbook.com/v0/b/gitbook-legacy-files/o/assets%2F-MKZSsJBtSP9L4sqIe_q%2F-MPcdoF_aq80xKbOxNil%2F-MPcgrVqXQ0BHVq78Gxx%2Fblue_checkmark_ms.png?alt=media\&token=29bb30d2-ce12-4579-b668-a655cbadf491) | -                                                                                                                                                                                                                                      | ![Blue Checkmark Ms](https://files.gitbook.com/v0/b/gitbook-legacy-files/o/assets%2F-MKZSsJBtSP9L4sqIe_q%2F-MPcdoF_aq80xKbOxNil%2F-MPcgrVqXQ0BHVq78Gxx%2Fblue_checkmark_ms.png?alt=media\&token=29bb30d2-ce12-4579-b668-a655cbadf491) | ![Blue Checkmark Ms](https://files.gitbook.com/v0/b/gitbook-legacy-files/o/assets%2F-MKZSsJBtSP9L4sqIe_q%2F-MPcdoF_aq80xKbOxNil%2F-MPcgrVqXQ0BHVq78Gxx%2Fblue_checkmark_ms.png?alt=media\&token=29bb30d2-ce12-4579-b668-a655cbadf491) | ![Blue Checkmark Ms](https://files.gitbook.com/v0/b/gitbook-legacy-files/o/assets%2F-MKZSsJBtSP9L4sqIe_q%2F-MPcdoF_aq80xKbOxNil%2F-MPcgrVqXQ0BHVq78Gxx%2Fblue_checkmark_ms.png?alt=media\&token=29bb30d2-ce12-4579-b668-a655cbadf491) |
| IQ-Feed             | -                                                                                                                                                                                                                                     | ![Blue Checkmark Ms](https://files.gitbook.com/v0/b/gitbook-legacy-files/o/assets%2F-MKZSsJBtSP9L4sqIe_q%2F-MPcdoF_aq80xKbOxNil%2F-MPcgrVqXQ0BHVq78Gxx%2Fblue_checkmark_ms.png?alt=media\&token=29bb30d2-ce12-4579-b668-a655cbadf491)  | ![Blue Checkmark Ms](https://files.gitbook.com/v0/b/gitbook-legacy-files/o/assets%2F-MKZSsJBtSP9L4sqIe_q%2F-MPcdoF_aq80xKbOxNil%2F-MPcgrVqXQ0BHVq78Gxx%2Fblue_checkmark_ms.png?alt=media\&token=29bb30d2-ce12-4579-b668-a655cbadf491) | ![Blue Checkmark Ms](https://files.gitbook.com/v0/b/gitbook-legacy-files/o/assets%2F-MKZSsJBtSP9L4sqIe_q%2F-MPcdoF_aq80xKbOxNil%2F-MPcgrVqXQ0BHVq78Gxx%2Fblue_checkmark_ms.png?alt=media\&token=29bb30d2-ce12-4579-b668-a655cbadf491) | ![Blue Checkmark Ms](https://files.gitbook.com/v0/b/gitbook-legacy-files/o/assets%2F-MKZSsJBtSP9L4sqIe_q%2F-MPcdoF_aq80xKbOxNil%2F-MPcgrVqXQ0BHVq78Gxx%2Fblue_checkmark_ms.png?alt=media\&token=29bb30d2-ce12-4579-b668-a655cbadf491) | -                                                                                                                                                                                                                                      | ![Blue Checkmark Ms](https://files.gitbook.com/v0/b/gitbook-legacy-files/o/assets%2F-MKZSsJBtSP9L4sqIe_q%2F-MPcdoF_aq80xKbOxNil%2F-MPcgrVqXQ0BHVq78Gxx%2Fblue_checkmark_ms.png?alt=media\&token=29bb30d2-ce12-4579-b668-a655cbadf491) | ![Blue Checkmark Ms](https://files.gitbook.com/v0/b/gitbook-legacy-files/o/assets%2F-MKZSsJBtSP9L4sqIe_q%2F-MPcdoF_aq80xKbOxNil%2F-MPcgrVqXQ0BHVq78Gxx%2Fblue_checkmark_ms.png?alt=media\&token=29bb30d2-ce12-4579-b668-a655cbadf491) | ![Blue Checkmark Ms](https://files.gitbook.com/v0/b/gitbook-legacy-files/o/assets%2F-MKZSsJBtSP9L4sqIe_q%2F-MPcdoF_aq80xKbOxNil%2F-MPcgrVqXQ0BHVq78Gxx%2Fblue_checkmark_ms.png?alt=media\&token=29bb30d2-ce12-4579-b668-a655cbadf491) |
| FxFlat              | ![Blue Checkmark Ms](https://files.gitbook.com/v0/b/gitbook-legacy-files/o/assets%2F-MKZSsJBtSP9L4sqIe_q%2F-MPcdoF_aq80xKbOxNil%2F-MPcgrVqXQ0BHVq78Gxx%2Fblue_checkmark_ms.png?alt=media\&token=29bb30d2-ce12-4579-b668-a655cbadf491) | ![Blue Checkmark Ms](https://files.gitbook.com/v0/b/gitbook-legacy-files/o/assets%2F-MKZSsJBtSP9L4sqIe_q%2F-MPcdoF_aq80xKbOxNil%2F-MPcgrVqXQ0BHVq78Gxx%2Fblue_checkmark_ms.png?alt=media\&token=29bb30d2-ce12-4579-b668-a655cbadf491)  | -                                                                                                                                                                                                                                     | ![Blue Checkmark Ms](https://files.gitbook.com/v0/b/gitbook-legacy-files/o/assets%2F-MKZSsJBtSP9L4sqIe_q%2F-MPcdoF_aq80xKbOxNil%2F-MPcgrVqXQ0BHVq78Gxx%2Fblue_checkmark_ms.png?alt=media\&token=29bb30d2-ce12-4579-b668-a655cbadf491) | ![Blue Checkmark Ms](https://files.gitbook.com/v0/b/gitbook-legacy-files/o/assets%2F-MKZSsJBtSP9L4sqIe_q%2F-MPcdoF_aq80xKbOxNil%2F-MPcgrVqXQ0BHVq78Gxx%2Fblue_checkmark_ms.png?alt=media\&token=29bb30d2-ce12-4579-b668-a655cbadf491) | ![Blue Checkmark Ms](https://files.gitbook.com/v0/b/gitbook-legacy-files/o/assets%2F-MKZSsJBtSP9L4sqIe_q%2F-MPcdoF_aq80xKbOxNil%2F-MPcgrVqXQ0BHVq78Gxx%2Fblue_checkmark_ms.png?alt=media\&token=29bb30d2-ce12-4579-b668-a655cbadf491)  | ![Blue Checkmark Ms](https://files.gitbook.com/v0/b/gitbook-legacy-files/o/assets%2F-MKZSsJBtSP9L4sqIe_q%2F-MPcdoF_aq80xKbOxNil%2F-MPcgrVqXQ0BHVq78Gxx%2Fblue_checkmark_ms.png?alt=media\&token=29bb30d2-ce12-4579-b668-a655cbadf491) | -                                                                                                                                                                                                                                     | -                                                                                                                                                                                                                                     |
| Rithmic             | ![Blue Checkmark Ms](https://files.gitbook.com/v0/b/gitbook-legacy-files/o/assets%2F-MKZSsJBtSP9L4sqIe_q%2F-MPcdoF_aq80xKbOxNil%2F-MPcgrVqXQ0BHVq78Gxx%2Fblue_checkmark_ms.png?alt=media\&token=29bb30d2-ce12-4579-b668-a655cbadf491) | ![Blue Checkmark Ms](https://files.gitbook.com/v0/b/gitbook-legacy-files/o/assets%2F-MKZSsJBtSP9L4sqIe_q%2F-MPcdoF_aq80xKbOxNil%2F-MPcgrVqXQ0BHVq78Gxx%2Fblue_checkmark_ms.png?alt=media\&token=29bb30d2-ce12-4579-b668-a655cbadf491)  | ![Blue Checkmark Ms](https://files.gitbook.com/v0/b/gitbook-legacy-files/o/assets%2F-MKZSsJBtSP9L4sqIe_q%2F-MPcdoF_aq80xKbOxNil%2F-MPcgrVqXQ0BHVq78Gxx%2Fblue_checkmark_ms.png?alt=media\&token=29bb30d2-ce12-4579-b668-a655cbadf491) | ![Blue Checkmark Ms](https://files.gitbook.com/v0/b/gitbook-legacy-files/o/assets%2F-MKZSsJBtSP9L4sqIe_q%2F-MPcdoF_aq80xKbOxNil%2F-MPcgrVqXQ0BHVq78Gxx%2Fblue_checkmark_ms.png?alt=media\&token=29bb30d2-ce12-4579-b668-a655cbadf491) | ![Blue Checkmark Ms](https://files.gitbook.com/v0/b/gitbook-legacy-files/o/assets%2F-MKZSsJBtSP9L4sqIe_q%2F-MPcdoF_aq80xKbOxNil%2F-MPcgrVqXQ0BHVq78Gxx%2Fblue_checkmark_ms.png?alt=media\&token=29bb30d2-ce12-4579-b668-a655cbadf491) | -                                                                                                                                                                                                                                      | -                                                                                                                                                                                                                                     | -                                                                                                                                                                                                                                     | ![Blue Checkmark Ms](https://files.gitbook.com/v0/b/gitbook-legacy-files/o/assets%2F-MKZSsJBtSP9L4sqIe_q%2F-MPcdoF_aq80xKbOxNil%2F-MPcgrVqXQ0BHVq78Gxx%2Fblue_checkmark_ms.png?alt=media\&token=29bb30d2-ce12-4579-b668-a655cbadf491) |
| Lenz and Partner    | -                                                                                                                                                                                                                                     | ![Blue Checkmark Ms](https://files.gitbook.com/v0/b/gitbook-legacy-files/o/assets%2F-MKZSsJBtSP9L4sqIe_q%2F-MPcdoF_aq80xKbOxNil%2F-MPcgrVqXQ0BHVq78Gxx%2Fblue_checkmark_ms.png?alt=media\&token=29bb30d2-ce12-4579-b668-a655cbadf491)  | ![Blue Checkmark Ms](https://files.gitbook.com/v0/b/gitbook-legacy-files/o/assets%2F-MKZSsJBtSP9L4sqIe_q%2F-MPcdoF_aq80xKbOxNil%2F-MPcgrVqXQ0BHVq78Gxx%2Fblue_checkmark_ms.png?alt=media\&token=29bb30d2-ce12-4579-b668-a655cbadf491) | ![Blue Checkmark Ms](https://files.gitbook.com/v0/b/gitbook-legacy-files/o/assets%2F-MKZSsJBtSP9L4sqIe_q%2F-MPcdoF_aq80xKbOxNil%2F-MPcgrVqXQ0BHVq78Gxx%2Fblue_checkmark_ms.png?alt=media\&token=29bb30d2-ce12-4579-b668-a655cbadf491) | ![Blue Checkmark Ms](https://files.gitbook.com/v0/b/gitbook-legacy-files/o/assets%2F-MKZSsJBtSP9L4sqIe_q%2F-MPcdoF_aq80xKbOxNil%2F-MPcgrVqXQ0BHVq78Gxx%2Fblue_checkmark_ms.png?alt=media\&token=29bb30d2-ce12-4579-b668-a655cbadf491) | ![Blue Checkmark Ms](https://files.gitbook.com/v0/b/gitbook-legacy-files/o/assets%2F-MKZSsJBtSP9L4sqIe_q%2F-MPcdoF_aq80xKbOxNil%2F-MPcgrVqXQ0BHVq78Gxx%2Fblue_checkmark_ms.png?alt=media\&token=29bb30d2-ce12-4579-b668-a655cbadf491)  | ![Blue Checkmark Ms](https://files.gitbook.com/v0/b/gitbook-legacy-files/o/assets%2F-MKZSsJBtSP9L4sqIe_q%2F-MPcdoF_aq80xKbOxNil%2F-MPcgrVqXQ0BHVq78Gxx%2Fblue_checkmark_ms.png?alt=media\&token=29bb30d2-ce12-4579-b668-a655cbadf491) | ![Blue Checkmark Ms](https://files.gitbook.com/v0/b/gitbook-legacy-files/o/assets%2F-MKZSsJBtSP9L4sqIe_q%2F-MPcdoF_aq80xKbOxNil%2F-MPcgrVqXQ0BHVq78Gxx%2Fblue_checkmark_ms.png?alt=media\&token=29bb30d2-ce12-4579-b668-a655cbadf491) | ![Blue Checkmark Ms](https://files.gitbook.com/v0/b/gitbook-legacy-files/o/assets%2F-MKZSsJBtSP9L4sqIe_q%2F-MPcdoF_aq80xKbOxNil%2F-MPcgrVqXQ0BHVq78Gxx%2Fblue_checkmark_ms.png?alt=media\&token=29bb30d2-ce12-4579-b668-a655cbadf491) |
| AMP                 | ![Blue Checkmark Ms](https://files.gitbook.com/v0/b/gitbook-legacy-files/o/assets%2F-MKZSsJBtSP9L4sqIe_q%2F-MPcdoF_aq80xKbOxNil%2F-MPcgrVqXQ0BHVq78Gxx%2Fblue_checkmark_ms.png?alt=media\&token=29bb30d2-ce12-4579-b668-a655cbadf491) | ![Blue Checkmark Ms](https://files.gitbook.com/v0/b/gitbook-legacy-files/o/assets%2F-MKZSsJBtSP9L4sqIe_q%2F-MPcdoF_aq80xKbOxNil%2F-MPcgrVqXQ0BHVq78Gxx%2Fblue_checkmark_ms.png?alt=media\&token=29bb30d2-ce12-4579-b668-a655cbadf491)  | ![Blue Checkmark Ms](https://files.gitbook.com/v0/b/gitbook-legacy-files/o/assets%2F-MKZSsJBtSP9L4sqIe_q%2F-MPcdoF_aq80xKbOxNil%2F-MPcgrVqXQ0BHVq78Gxx%2Fblue_checkmark_ms.png?alt=media\&token=29bb30d2-ce12-4579-b668-a655cbadf491) | ![Blue Checkmark Ms](https://files.gitbook.com/v0/b/gitbook-legacy-files/o/assets%2F-MKZSsJBtSP9L4sqIe_q%2F-MPcdoF_aq80xKbOxNil%2F-MPcgrVqXQ0BHVq78Gxx%2Fblue_checkmark_ms.png?alt=media\&token=29bb30d2-ce12-4579-b668-a655cbadf491) | ![Blue Checkmark Ms](https://files.gitbook.com/v0/b/gitbook-legacy-files/o/assets%2F-MKZSsJBtSP9L4sqIe_q%2F-MPcdoF_aq80xKbOxNil%2F-MPcgrVqXQ0BHVq78Gxx%2Fblue_checkmark_ms.png?alt=media\&token=29bb30d2-ce12-4579-b668-a655cbadf491) | -                                                                                                                                                                                                                                      | -                                                                                                                                                                                                                                     | -                                                                                                                                                                                                                                     | ![Blue Checkmark Ms](https://files.gitbook.com/v0/b/gitbook-legacy-files/o/assets%2F-MKZSsJBtSP9L4sqIe_q%2F-MPcdoF_aq80xKbOxNil%2F-MPcgrVqXQ0BHVq78Gxx%2Fblue_checkmark_ms.png?alt=media\&token=29bb30d2-ce12-4579-b668-a655cbadf491) |
| GainFutures         | ![Blue Checkmark Ms](https://files.gitbook.com/v0/b/gitbook-legacy-files/o/assets%2F-MKZSsJBtSP9L4sqIe_q%2F-MPcdoF_aq80xKbOxNil%2F-MPcgrVqXQ0BHVq78Gxx%2Fblue_checkmark_ms.png?alt=media\&token=29bb30d2-ce12-4579-b668-a655cbadf491) | ![Blue Checkmark Ms](https://files.gitbook.com/v0/b/gitbook-legacy-files/o/assets%2F-MKZSsJBtSP9L4sqIe_q%2F-MPcdoF_aq80xKbOxNil%2F-MPcgrVqXQ0BHVq78Gxx%2Fblue_checkmark_ms.png?alt=media\&token=29bb30d2-ce12-4579-b668-a655cbadf491)  | ![Blue Checkmark Ms](https://files.gitbook.com/v0/b/gitbook-legacy-files/o/assets%2F-MKZSsJBtSP9L4sqIe_q%2F-MPcdoF_aq80xKbOxNil%2F-MPcgrVqXQ0BHVq78Gxx%2Fblue_checkmark_ms.png?alt=media\&token=29bb30d2-ce12-4579-b668-a655cbadf491) | ![Blue Checkmark Ms](https://files.gitbook.com/v0/b/gitbook-legacy-files/o/assets%2F-MKZSsJBtSP9L4sqIe_q%2F-MPcdoF_aq80xKbOxNil%2F-MPcgrVqXQ0BHVq78Gxx%2Fblue_checkmark_ms.png?alt=media\&token=29bb30d2-ce12-4579-b668-a655cbadf491) | ![Blue Checkmark Ms](https://files.gitbook.com/v0/b/gitbook-legacy-files/o/assets%2F-MKZSsJBtSP9L4sqIe_q%2F-MPcdoF_aq80xKbOxNil%2F-MPcgrVqXQ0BHVq78Gxx%2Fblue_checkmark_ms.png?alt=media\&token=29bb30d2-ce12-4579-b668-a655cbadf491) | -                                                                                                                                                                                                                                      | ![Blue Checkmark Ms](https://files.gitbook.com/v0/b/gitbook-legacy-files/o/assets%2F-MKZSsJBtSP9L4sqIe_q%2F-MPcdoF_aq80xKbOxNil%2F-MPcgrVqXQ0BHVq78Gxx%2Fblue_checkmark_ms.png?alt=media\&token=29bb30d2-ce12-4579-b668-a655cbadf491) | -                                                                                                                                                                                                                                     | ![Blue Checkmark Ms](https://files.gitbook.com/v0/b/gitbook-legacy-files/o/assets%2F-MKZSsJBtSP9L4sqIe_q%2F-MPcdoF_aq80xKbOxNil%2F-MPcgrVqXQ0BHVq78Gxx%2Fblue_checkmark_ms.png?alt=media\&token=29bb30d2-ce12-4579-b668-a655cbadf491) |
| MetaTrader 5        | ![Blue Checkmark Ms](https://files.gitbook.com/v0/b/gitbook-legacy-files/o/assets%2F-MKZSsJBtSP9L4sqIe_q%2F-MPcdoF_aq80xKbOxNil%2F-MPcgrVqXQ0BHVq78Gxx%2Fblue_checkmark_ms.png?alt=media\&token=29bb30d2-ce12-4579-b668-a655cbadf491) | ![Blue Checkmark Ms](https://files.gitbook.com/v0/b/gitbook-legacy-files/o/assets%2F-MKZSsJBtSP9L4sqIe_q%2F-MPcdoF_aq80xKbOxNil%2F-MPcgrVqXQ0BHVq78Gxx%2Fblue_checkmark_ms.png?alt=media\&token=29bb30d2-ce12-4579-b668-a655cbadf491)  | ![Blue Checkmark Ms](https://files.gitbook.com/v0/b/gitbook-legacy-files/o/assets%2F-MKZSsJBtSP9L4sqIe_q%2F-MPcdoF_aq80xKbOxNil%2F-MPcgrVqXQ0BHVq78Gxx%2Fblue_checkmark_ms.png?alt=media\&token=29bb30d2-ce12-4579-b668-a655cbadf491) | ![Blue Checkmark Ms](https://files.gitbook.com/v0/b/gitbook-legacy-files/o/assets%2F-MKZSsJBtSP9L4sqIe_q%2F-MPcdoF_aq80xKbOxNil%2F-MPcgrVqXQ0BHVq78Gxx%2Fblue_checkmark_ms.png?alt=media\&token=29bb30d2-ce12-4579-b668-a655cbadf491) | ![Blue Checkmark Ms](https://files.gitbook.com/v0/b/gitbook-legacy-files/o/assets%2F-MKZSsJBtSP9L4sqIe_q%2F-MPcdoF_aq80xKbOxNil%2F-MPcgrVqXQ0BHVq78Gxx%2Fblue_checkmark_ms.png?alt=media\&token=29bb30d2-ce12-4579-b668-a655cbadf491) | ![Blue Checkmark Ms](https://files.gitbook.com/v0/b/gitbook-legacy-files/o/assets%2F-MKZSsJBtSP9L4sqIe_q%2F-MPcdoF_aq80xKbOxNil%2F-MPcgrVqXQ0BHVq78Gxx%2Fblue_checkmark_ms.png?alt=media\&token=29bb30d2-ce12-4579-b668-a655cbadf491)  | ![Blue Checkmark Ms](https://files.gitbook.com/v0/b/gitbook-legacy-files/o/assets%2F-MKZSsJBtSP9L4sqIe_q%2F-MPcdoF_aq80xKbOxNil%2F-MPcgrVqXQ0BHVq78Gxx%2Fblue_checkmark_ms.png?alt=media\&token=29bb30d2-ce12-4579-b668-a655cbadf491) | ![Blue Checkmark Ms](https://files.gitbook.com/v0/b/gitbook-legacy-files/o/assets%2F-MKZSsJBtSP9L4sqIe_q%2F-MPcdoF_aq80xKbOxNil%2F-MPcgrVqXQ0BHVq78Gxx%2Fblue_checkmark_ms.png?alt=media\&token=29bb30d2-ce12-4579-b668-a655cbadf491) | ![Blue Checkmark Ms](https://files.gitbook.com/v0/b/gitbook-legacy-files/o/assets%2F-MKZSsJBtSP9L4sqIe_q%2F-MPcdoF_aq80xKbOxNil%2F-MPcgrVqXQ0BHVq78Gxx%2Fblue_checkmark_ms.png?alt=media\&token=29bb30d2-ce12-4579-b668-a655cbadf491) |

*Bemerkungen:*

* " ![Blue Checkmark Ms](https://docs.agenatrader.com/~gitbook/image?url=https%3A%2F%2F1347375179-files.gitbook.io%2F%7E%2Ffiles%2Fv0%2Fb%2Fgitbook-legacy-files%2Fo%2Fassets%252F-MKZSsJBtSP9L4sqIe_q%252F-MPcdoF_aq80xKbOxNil%252F-MPcgrVqXQ0BHVq78Gxx%252Fblue_checkmark_ms.png%3Falt%3Dmedia%26token%3D29bb30d2-ce12-4579-b668-a655cbadf491\&width=300\&dpr=4\&quality=100\&sign=dc5ecf3f\&sv=1) 1" beinhaltet nur 60 Datenhistorien / pro 10 Minuten
* " ![Blue Checkmark Ms](https://docs.agenatrader.com/~gitbook/image?url=https%3A%2F%2F1347375179-files.gitbook.io%2F%7E%2Ffiles%2Fv0%2Fb%2Fgitbook-legacy-files%2Fo%2Fassets%252F-MKZSsJBtSP9L4sqIe_q%252F-MPcdoF_aq80xKbOxNil%252F-MPcgrVqXQ0BHVq78Gxx%252Fblue_checkmark_ms.png%3Falt%3Dmedia%26token%3D29bb30d2-ce12-4579-b668-a655cbadf491\&width=300\&dpr=4\&quality=100\&sign=dc5ecf3f\&sv=1) 2" grundsätzlich Möglich jedoch noch nicht gewünscht/freigegeben Seitens IB
* "![Blue Checkmark Ms](https://files.gitbook.com/v0/b/gitbook-legacy-files/o/assets%2F-MKZSsJBtSP9L4sqIe_q%2F-MPcdoF_aq80xKbOxNil%2F-MPcgrVqXQ0BHVq78Gxx%2Fblue_checkmark_ms.png?alt=media\&token=29bb30d2-ce12-4579-b668-a655cbadf491)3" Echtzeitdaten nur für Aktien und Optionen

**FOREX-Märkte**

Grundsätzlich ist anzumerken, dass Forex-Märkte vom gleichen Datenfeed/Broker bedient werden sollten, über welchen sie gehandelt werden, damit die Daten aus dem gleichen Pool kommen wo die Orders hingeroutet werden. Somit stimmt der Ausführungspreis immer 1:1 mit dem dargestellten Daten (Chart) zusammen. Ist relevant für gehandelte Zeiteinheiten unter einer Minute.


# AgenaBroker

#### **AgenaBroker – Ihr leistungsstarker Brokerage-Service**

AgenaBroker ist ein **voll ausgestatteter Brokerage-Service**, der auf der Technologie von **Interactive Brokers** basiert und ein nahtloses sowie leistungsstarkes **Handelserlebnis** bietet.

Durch die Eröffnung eines AgenaBroker-Kontos oder die Übertragung eines bestehenden Kontos erhalten Trader **kostenfreien Zugang zur AgenaTrader-Plattform** – optimiert für **Interactive Brokers** und **Bloomberg-zertifiziert**. Sobald das Konto kapitalisiert wurde, steht die Plattform ohne zusätzliche Kosten zur Verfügung.

***

## **So verbinden Sie sich mit AgenaBroker**

Da AgenaBroker auf der Technologie von **Interactive Brokers** basiert, sind alle **Anleitungen zur Verbindung** und **technischen Details** in der entsprechenden **Interactive Brokers-Verbindungsanleitung** verfügbar. Folgen Sie einfach den bereitgestellten Anweisungen, um Ihre Verbindung herzustellen und sicher zu handeln.

***

## **Warum AgenaBroker wählen?**

Was AgenaBroker von anderen Brokern unterscheidet, ist das **exklusive Paket an kostenlosen Add-Ons**, das Trader beim Eröffnen eines Kontos erhalten. Dieses Paket hat einen Wert von **7.280 €** und bietet essenzielle Werkzeuge für **tiefgehende Marktanalysen, Strategieentwicklung und effizientes Trading**.

**Kostenloses Add-On-Paket beinhaltet:**

✅ **AgenaTrader Vollversion** – uneingeschränkter Zugang zur gesamten Handelsplattform.

🔹 **Professionelle Werkzeuge:**

* **DowTheory/Trendfolge**
* **Saisonalitätsanalyse**
* **COT-Report**
* **Darvas-Strategie**

🔹 **Erweiterte Funktionen:**

* **CorrelationMatrix**
* **Volume-Advanced**
* **Options-Advanced**
* **Dynamic Scanner**
* **Trading-Journal Pro**

***

Mit **AgenaBroker** profitieren Trader nicht nur von einem **professionellen Brokerage-Service**, sondern erhalten gleichzeitig eine **umfangreiche Suite an Premium-Features** – völlig **kostenfrei**.

Mehr erfahren und direkt starten: [**broker.agenatrader.com**](https://broker.agenatrader.com) – nutzen Sie alle Vorteile, die AgenaBroker zu bieten hat! 🚀


# Technology Provider

In diesem Abschnitt finden Sie eine Übersicht über alle **Technologieanbieter**, die von **AgenaTrader** unterstützt werden.

**Technologieanbieter** sind Unternehmen oder Produkte, die die **technische Infrastruktur** bereitstellen, auf deren Basis andere Broker – oft als **"Whitelabel-Broker"** bezeichnet – ihre eigenen Handelsdienstleistungen anbieten. Diese Anbieter ermöglichen es Brokern, ihre eigene **Marke und Services** anzubieten, während sie gleichzeitig die Technologie und Infrastruktur des zugrunde liegenden Anbieters nutzen.

Ein bekanntes Beispiel hierfür ist **Interactive Brokers**. Obwohl Interactive Brokers selbst als Broker tätig ist, nutzen andere Broker wie **CapTrader** oder **AgenaBroker** deren Infrastruktur, um ihren eigenen Service bereitzustellen – inklusive individueller Angebote und Kundensupport.

Wenn **AgenaTrader** einen bestimmten **Technologieanbieter unterstützt**, bedeutet dies, dass Sie sich mit **jedem Broker verbinden können**, der auf der Infrastruktur dieses Anbieters basiert. Dies gewährleistet eine **nahtlose Handelserfahrung**, unabhängig davon, welchen Broker Sie wählen – solange dieser auf einem der gelisteten Technologieanbieter aufbaut.

In diesem Abschnitt finden Sie eine **vollständige Liste** der von AgenaTrader unterstützten Technologieanbieter sowie weitere Informationen über ihre Rolle in der Brokerlandschaft.

## Gain Capital <a href="#technology_provider__gain_capital__de_" id="technology_provider__gain_capital__de_"></a>

### **Kurzer Überblick von Gain Capital**

GAIN Capital Futures ist die Großhandel-Brokerage von GAIN Capital Group LLC.\
Mit dem Schwerpunkt auf Institutionen und Introducing-Brokers sind wir sehr stolz darauf, die Dienstleistungen und Produkte anzubieten, die es diesen ermöglichen, ihr Business weiterzuentwickeln und zu stärken.

GAIN Capital arbeitet mit seinen Kunden und Brokern eng zusammen, um die richtige Lösung für deren Handelsbedürfnisse zu finden. Mit viel Erfahrung in börsengehandelten Futures und im Devisenmarkt ist GAIN Capital in der Lage, Ausführung, Clearing und Kundendienstleistungen bereitzustellen, die von Institutionen und Brokern benötigt werden.

Als globales Handelshaus und Börsenunternehmen in Form der Muttergesellschaft muss GAIN Capital die höchsten Standards an Unternehmensführung, Finanzberichterstattung und Offenlegung erfüllen. Finanzielle Transparenz gibt Kunden und Partnern das Vertrauen, dass die Firma gut verwaltet und geführt ist und über ausreichend Ressourcen verfügt, um die Industrie weiterhin innovativ nach vorne zu führen.

**Unterstützte Assetklassen:** Currency, Future

**Order-Verknüpfungen:** \
OCO Order-Verknüpfungen werden unterstützt\
ORO Order-Verknüpfungen werden lokal simuliert\
IFDone Order-Verknüpfungen werden lokal simuliert

**OrderAusführung**\
AgenaTrader führt keine Orders aus, wir bekommen nur Rückmeldungen seitens des Brokers dass eine Order mit einem bestimmten Preis\
ausgeführt worden ist. Simmen also zu einem Instrument die gelieferten Daten des Datenfeed-Lieferanten nicht mit den Quotes der\
Brokerplattform überein, kommt es zu einem Verhalten, dass Entry-\&Exit-Preise nicht zum Chartbid passen.

\
\
Für mehr Informationen über GAIN Capital besuchen Sie bitte deren Website auf <http://futures.gaincapital.com/>

### Verbindung <a href="#verbindung" id="verbindung"></a>

Bitte beachten Sie, das **R Trader Pro** notwendig ist.

Bitte folgen Sie den Anweisungen in folgendem Video, um die Verbindung korrekt einzurichten:

{% embed url="<https://youtu.be/9VLQtF5_oVY>" %}

{% hint style="info" %}

### Wichtig <a href="#technology_provider__interactive_brokers__de_" id="technology_provider__interactive_brokers__de_"></a>

DIE PLATTFORM DES BROKERS STELLT IMMER DIE REFERENZPLATTFORM DAR.

Das bedeutet, dass die auf der Plattform des BROKERS angezeigten Aufträge und marktbezogenen Werte gültig sind. Die Plattform des Brokers sollte immer als Backup zu AgenaTrader aktiv sein. Dadurch erhalten Sie einen wesentlichen Überblick über die Interaktion zwischen AgenaTrader und Ihrem Broker. Außerdem wissen Sie jederzeit genau, wie Ihre Aufträge/Positionen und letztendlich Ihr Kontostand dargestellt werden.
{% endhint %}

## Interactive Brokers <a href="#technology_provider__interactive_brokers__de_" id="technology_provider__interactive_brokers__de_"></a>

### Kurzer Überblick von Interactive Brokers (IB) <a href="#kurzer_berblick_von_interactive_brokers_ib_" id="kurzer_berblick_von_interactive_brokers_ib_"></a>

Interactive Brokers ist ein renommiertes Unternehmen, welches die finanziellen Dienstleistungen als Broker und Dealer seit 1977 anbietet. IB spezialisiert sich wesentlich auf Intraday- und institutionellen Handel. Das Unternehmen entwickelte seine eigene Handelsplattform - Trader Work Station (TWS) und bietet Tradern sehr vorteilhafte Kommission und Margins.

**Unterstützte Assetklassen:** CFD's, Future, Forex, Index, Stock

**Order-Verknüpfungen:** \
OCO Order-Verknüpfungen werden unterstützt\
ORO Order-Verknüpfungen werden lokal simuliert\
IFDone Order-Verknüpfungen werden lokal simuliert

**OrderAusführung**\
AgenaTrader führt keine Orders aus, wir bekommen nur Rückmeldungen seitens des Brokers dass eine Order mit einem bestimmten Preis\
ausgeführt worden ist. Simmen also zu einem Instrument die gelieferten Daten des Datenfeed-Lieferanten nicht mit den Quotes der\
Brokerplattform überein, kommt es zu einem Verhalten, dass Entry-\&Exit-Preise nicht zum Chartbid passen.

Sie können ein **Live- oder Demokonto** bei **Interactive Brokers** oder einem seiner **Whitelabel-Broker**, einschließlich [**AgenaBroker**](https://broker.agenatrader.com/), eröffnen.

**Von AgenaTrader unterstützte IB Kontotypen**

* Standard Einzelkonten (Pro Login ein hinterlegtes Hauptkonto)
* Financial Adviser (FA) Konten (Pro Login ein Hauptkonto mit mehreren Unterkonten), nähere Infos finden Sie [**Hier**](https://docs.agenatrader.com/main/broker-and-datafeed-connections/technology-provider#IB_Financial_Advisor_Accounts)
* Family and Friends Konten (F) (Pro Login ein Hauptkonto mit mehreren Unterkonten), nähere Infos finden Sie [**Hier**](https://docs.agenatrader.com/main/broker-and-datafeed-connections/technology-provider#IB_Financial_Advisor_Accounts)

**Von AgenaTrader nicht unterstützte IB Kontotypen**

* Duplizierte Konten/Multi Konten (Pro Login mehrere Hauptkonten)

(Dieser Kontotyp wird aktuell noch nicht unterstützt und es kann zu Problemen bei der Orderausführung bzw. der Datensynchronisation zwischen der TWS und AgenaTrader kommen. Bitte kontaktieren Sie dazu Ihren IB Kontomanager und lassen Ihr Konto auf eines der oben unterstützten Konten umstellen.)

Sie können ein Echtkonto oder Demokonto von Intercative Brokers über unsere [Website](https://agenatrader.com/de/broker/) eröffnen.&#x20;

### Verbindung Interactive Brokers (IB) <a href="#verbindung_interactive_brokers_ib_" id="verbindung_interactive_brokers_ib_"></a>

Bitte folgen Sie den Anweisungen in folgendem Video um die Verbindung korrekt einzurichten:

{% embed url="<https://youtu.be/prdJWAIHQK0>" %}

### Verwendung von IB Gateway und FA-Konten

Bitte laden Sie IB Gateway über den [Download-Link](https://www.interactivebrokers.eu/de/?f=16457) herunter und installieren Sie es.

Um Gateway zu installieren, führen Sie bitte die folgenden Schritte aus:

* Führen Sie Gateway aus. Aktivieren Sie im geöffneten Dialog das Kontrollkästchen IB API, geben Sie Ihre IB-Anmeldedaten ein, wählen Sie den Handelsmodus aus und klicken Sie auf die Schaltfläche Login:

<figure><img src="https://docs.agenatrader.com/~gitbook/image?url=https%3A%2F%2F2805764894-files.gitbook.io%2F%7E%2Ffiles%2Fv0%2Fb%2Fgitbook-legacy-files%2Fo%2Fassets%252F-MKZSsJBtSP9L4sqIe_q%252F-MPhn7zlMCA093nNUSJf%252F-MPi9QGr7VpCGhWXqYkh%252FGateway.png%3Falt%3Dmedia%26token%3D6693b5db-8742-485f-9608-fcc9d67622a8&#x26;width=768&#x26;dpr=4&#x26;quality=100&#x26;sign=78682d3e2ba9fe30832748ab10465a8a4036b7590c2a5ce47dbec6edb907eedd" alt=""><figcaption></figcaption></figure>

* Im geöffneten Fenster gehen Sie bitte zu Konfigurieren -> Einstellungen.

<figure><img src="https://docs.agenatrader.com/~gitbook/image?url=https%3A%2F%2F2805764894-files.gitbook.io%2F%7E%2Ffiles%2Fv0%2Fb%2Fgitbook-legacy-files%2Fo%2Fassets%252F-MKZSsJBtSP9L4sqIe_q%252F-MPhn7zlMCA093nNUSJf%252F-MPi9QGsHcNALpfh4Ptv%252FGateway1.png%3Falt%3Dmedia%26token%3D529b698d-bf0d-4a94-95cd-e26988019d53&#x26;width=768&#x26;dpr=4&#x26;quality=100&#x26;sign=27c516445f345810768c92de054a36acd2726945705549ffbfe1488c72bbf6b7" alt=""><figcaption></figcaption></figure>

* In API -> Einstellungen aktivieren Sie bitte das Kontrollkästchen Read-Only API.

<figure><img src="https://docs.agenatrader.com/~gitbook/image?url=https%3A%2F%2F2805764894-files.gitbook.io%2F%7E%2Ffiles%2Fv0%2Fb%2Fgitbook-legacy-files%2Fo%2Fassets%252F-MKZSsJBtSP9L4sqIe_q%252F-MPhn7zlMCA093nNUSJf%252F-MPi9QGtBVm-vLbIkOd7%252FGateway2.png%3Falt%3Dmedia%26token%3D3c1859de-0bc9-4d08-b6fa-c7b45ae40ba3&#x26;width=768&#x26;dpr=4&#x26;quality=100&#x26;sign=b3c1785ebf64434f8b37606b3d02b478ad8882c0fe67ee8995a3be5d0aa25da0" alt=""><figcaption></figcaption></figure>

* Erstellen Sie danach eine neue IB-Verbindung in AgenaTrader oder bearbeiten Sie eine bestehende. Die IB-Verbindungsanleitung finden Sie auf der Seite Technologieanbieter: Interactive Brokers. Konfigurieren Sie Ihr Konto in AgenaTrader wie im untenstehenden Bild. Verwenden Sie für den Benutzernamen und das Passwort in AgenaTrader die gleichen Anmeldedaten wie für den Gateway-Login.

<figure><img src="https://docs.agenatrader.com/~gitbook/image?url=https%3A%2F%2F2805764894-files.gitbook.io%2F%7E%2Ffiles%2Fv0%2Fb%2Fgitbook-legacy-files%2Fo%2Fassets%252F-MKZSsJBtSP9L4sqIe_q%252F-MPhn7zlMCA093nNUSJf%252F-MPi9QGu7ozAAfKWbHnX%252FGateway3.png%3Falt%3Dmedia%26token%3D040d4571-6538-42b8-bbbf-be57799aae74&#x26;width=768&#x26;dpr=4&#x26;quality=100&#x26;sign=ebcb2738fe051e2478f33ea4027ddcecb088b075ba7392cfd60e75e6887b0ca2" alt=""><figcaption></figcaption></figure>

Wichtig! Starten und melden Sie sich zuerst bei IB Gateway an und versuchen Sie erst dann, die Verbindung über AgenaTrader herzustellen. Wir haben derzeit keine Möglichkeit, Gateway automatisch zu starten.

### IB-Finanzberaterkonten

IB-Finanzberaterkonten (FA-Konten) sind Konten, die es Finanzberatern ermöglichen, Handelsentscheidungen für ihre Kunden zu treffen und auszuführen.&#x20;

Um ein FA-Konto zu nutzen, müssen Sie ein Konto als Finanzberater bei IB oder einem IB-Weißlabel eröffnen. Sie können die Verbindung genauso wie mit einem normalen IB-Konto herstellen. In AgenaTrader können Sie nun auswählen, mit welchem Konto Sie einen Trade eingehen möchten, unter "Standard-Handelskonten". Sie haben die Möglichkeit, einen Trade in allen Unterkonten oder nur in ausgewählten einzelnen Konten durchzuführen. Wenn Sie den Trade in allen Unterkonten durchführen möchten, gibt es verschiedene Optionen, wie die Positionsgröße auf die Unterkonten verteilt werden soll.

#### Kontogruppen

Wenn Sie eine Kontogruppe erstellen, können Sie Unterkonten zuordnen, die dieser Gruppe angehören sollen. Für diese Gruppe können Sie nun eine Zuordnungsmethode auswählen. Die folgenden Optionen stehen zur Verfügung:

<figure><img src="https://docs.agenatrader.com/~gitbook/image?url=https%3A%2F%2F2805764894-files.gitbook.io%2F%7E%2Ffiles%2Fv0%2Fb%2Fgitbook-legacy-files%2Fo%2Fassets%252F-MKZSsJBtSP9L4sqIe_q%252F-MPhn7zlMCA093nNUSJf%252F-MPi9QGwQTyk_H3HO2yn%252FKontogruppen-1.png%3Falt%3Dmedia%26token%3D5c63efe2-93f3-4a34-b975-c99768412ead&#x26;width=768&#x26;dpr=4&#x26;quality=100&#x26;sign=5a375ff30d2b15179fc242991cbc2e7add55be60abe088d94800b9e54f9f215d" alt=""><figcaption></figcaption></figure>

* **EqualQuantity:** Trades werden gleichmäßig auf alle Konten in der Gruppe verteilt. Beispiel: Sie kaufen 400 Apple-Aktien; Ihre Kontogruppe besteht aus 4 Unterkonten. Nun wird in jedem Konto ein Kaufauftrag über 100 Apple-Aktien ausgeführt.
* **NetLiq:** Trades werden basierend auf dem Nettovermögenswert jedes Unterkontos verteilt. Beispiel: Ihre Kontogruppe besteht aus 3 Unterkonten, A, B und C, mit einem Nettovermögenswert von €25.000, €50.000 und €100.000. Basierend auf diesen Werten berechnet das System ein Verhältnis von 1:2:4. Wenn Sie jetzt 700 Apple-Aktien kaufen, werden 100 Aktien auf Konto A, 200 auf Konto B und 400 auf Konto C gekauft.
* **AvailableEquity:** Trades werden basierend auf dem verfügbaren Eigenkapital der Unterkonten verteilt. Beispiel: Ihre Kontogruppe besteht aus 3 Unterkonten, A, B und C, mit einem Eigenkapital von €25.000, €50.000 und €100.000. Basierend auf diesen Werten berechnet das System ein Verhältnis von 1:2:4. Wenn Sie jetzt 700 Apple-Aktien kaufen, werden 100 Aktien auf Konto A, 200 auf Konto B und 400 auf Konto C gekauft.
* **PctChange:** Die Auftragsgröße wird rein vom System berechnet. Sie geben einfach einen Prozentsatz ein, um den ein vorhandener Auftrag in den Unterkonten erhöht oder reduziert werden soll. Beispiel: Aktuell besitzt Unterkonto A 100 Apple-Aktien, B hat 200 Aktien und C hat 400 Aktien. Sie möchten nun den Bestand an Apple-Aktien in jedem Unterkonto um 50% reduzieren. Dazu eröffnen Sie einen Verkaufsauftrag und geben den Wert "50" in das Prozentfeld ein. Da Sie insgesamt 700 Apple-Aktien besitzen, berechnet das System jetzt eine Gesamtgröße des Verkaufsauftrags von 350 Aktien und verteilt diesen Auftrag nun korrekt auf die Unterkonten (Konto A verkauft 50 Aktien, B verkauft 100 Aktien, C verkauft 200 Aktien).

Weitere Informationen zu den Kontogruppen finden Sie [hier](https://www.interactivebrokers.com/en/software/tws/usersguidebook/financialadvisors/create_an_account_group_for_share_allocation.htm).

#### Zuweisungsprofile

Über ein Zuweisungsprofil werden Positionen basierend auf einem Prozentsatz, einem bestimmten Verhältnis oder einer absoluten Anzahl, die Sie festlegen, allen Konten in diesem Profil zugewiesen. Die folgenden Optionen stehen zur Verfügung:

<figure><img src="https://docs.agenatrader.com/~gitbook/image?url=https%3A%2F%2F2805764894-files.gitbook.io%2F%7E%2Ffiles%2Fv0%2Fb%2Fgitbook-legacy-files%2Fo%2Fassets%252F-MKZSsJBtSP9L4sqIe_q%252F-MPhn7zlMCA093nNUSJf%252F-MPi9QGxz5XkWInOGYp9%252FZuweisungsprofile.png%3Falt%3Dmedia%26token%3D9b635c74-adeb-4f48-ab74-14977241d648&#x26;width=768&#x26;dpr=4&#x26;quality=100&#x26;sign=a37489755ada27c4cee404d604685789237aeca34613025c20c60fc9ed4e0dce" alt=""><figcaption></figcaption></figure>

* **Percentages:** Die Gesamtanzahl der zu kaufenden/verkaufenden Instrumente wird basierend auf den festgelegten Prozentsätzen den jeweiligen Unterkonten zugewiesen. Beispiel: Sie haben 5 Unterkonten mit jeweils einem Prozentsatz von 20%. Wenn Sie jetzt 1000 Apple-Aktien kaufen, wird in jedem Unterkonto ein Kaufauftrag über 200 Apple-Aktien ausgeführt.
* **Ratios:** Die Gesamtanzahl der zu kaufenden/verkaufenden Instrumente wird basierend auf den eingegebenen Verhältnissen den jeweiligen Unterkonten zugewiesen. Beispiel: Sie haben 5 Unterkonten und haben ein Verhältnis von 1:2:3:4:5 festgelegt. Wenn Sie jetzt 1500 Apple-Aktien kaufen, werden auf den einzelnen Konten jeweils 100, 200, 300, 400 und 500 Aktien gekauft.
* **Shares**: Hier können Sie eine absolute Anzahl festlegen, die für jedes Konto als Positionsgröße verwendet wird. Beispiel: Sie haben 3 Unterkonten und setzen eine absolute Anzahl von 10 für jedes Konto fest. Wenn Sie jetzt einen Auftrag auf dem Markt platzieren, wird die Positionsgröße automatisch auf 30 festgelegt, und in jedem Konto wird ein Auftrag über 10 Einheiten ausgeführt.

Weitere Informationen zu den Kontogruppen finden Sie [hier](https://www.interactivebrokers.com/en/software/tws/usersguidebook/financialadvisors/create_a_share_allocation_profile.htm).

In AgenaTrader können Sie über die folgende Schaltfläche auf die Kontoeinstellungen für FA-Konten zugreifen:

<figure><img src="https://docs.agenatrader.com/~gitbook/image?url=https%3A%2F%2F2805764894-files.gitbook.io%2F%7E%2Ffiles%2Fv0%2Fb%2Fgitbook-legacy-files%2Fo%2Fassets%252F-MKZSsJBtSP9L4sqIe_q%252F-MPhn7zlMCA093nNUSJf%252F-MPi9QGzjgVeVxyym7lo%252FAccounts-im-AT.png%3Falt%3Dmedia%26token%3D51c432e3-9cb8-4a30-9c4b-b89042c1f563&#x26;width=768&#x26;dpr=4&#x26;quality=100&#x26;sign=23482cd4b7cbd03024decb67da6e4142270c61f09191895e26c07b2595734fb6" alt=""><figcaption></figcaption></figure>

Nachdem Sie eine Verbindung zu Ihrem IB-FA-Konto hergestellt und das Masterkonto festgelegt haben, finden Sie in der ActionBar in AgenaTrader die Option "Financial Advisor Profile". Hier können Sie nun das Profil auswählen, das Sie für jeden Trade verwenden möchten.

<figure><img src="https://docs.agenatrader.com/~gitbook/image?url=https%3A%2F%2F2805764894-files.gitbook.io%2F%7E%2Ffiles%2Fv0%2Fb%2Fgitbook-legacy-files%2Fo%2Fassets%252F-MKZSsJBtSP9L4sqIe_q%252F-MPhn7zlMCA093nNUSJf%252F-MPi9QGy4kVQ8YWfUmxO%252FAccounts-Action-Bar.png%3Falt%3Dmedia%26token%3D32d4e09e-b42c-4a71-a5d1-8904ea097137&#x26;width=768&#x26;dpr=4&#x26;quality=100&#x26;sign=f586018bb18e369101132b7ddb775bbcc33962b5c1a8a0b3f6ec601cf7fbe56b" alt=""><figcaption></figcaption></figure>

**Disclaimer:**

Exchange transactions are associated with significant risks. Those who trade on the financial and commodity markets must familiarize themselves with these risks. Possible analyses, techniques and methods presented here are not an invitation to trade on the financial and commodity markets. They serve only for illustration, further education, and information purposes, and do not constitute investment advice or personal recommendations in any way. They are intended only to facilitate the customer’s investment decision and do not replace the advice of an investor or specific investment advice. The customer trades completely at his or her own risk.

### IB als DatenFeed <a href="#ib_als_datenfeed" id="ib_als_datenfeed"></a>

#### Historical Overflow <a href="#historical_overflow" id="historical_overflow"></a>

Die maximale Anzahl der gleichzeitig offenen historischen Daten-Requests von der IB API beträgt 50. Daher sollten Sie darauf achten, dass Sie eine kleinere Anzahl von Anfragen gleichzeitig anstehend haben.

**Pacing Violations bei kleinen Bars (30 Sekunden oder weniger)** \
Eine Pacing Violation tritt auf, wenn Sie eine oder mehrere der folgenden Einschränkungen nicht beachten: \
-> Identische Abfrage historischer Daten innerhalb von 15 Sekunden. \
-> Sechs oder mehr historische Daten-Requests für denselben Contract, Exchange und Tick Typ innerhalb von zwei Sekunden. \
-> Mehr als 60 Anfragen innerhalb eines Zeitraums von zehn Minuten.

Seien Sie jedoch vorsichtig, wenn Sie große Mengen an historischen Daten anfordern oder historische Daten-Requests senden, da weiterhin ein "Soft Limit" implementiert ist. Wenn Sie zu viele historische Daten anfordern, werden Sie vom API-Client getrennt. Weitere Informationen zu den Tempoverstößen für kleine Balken finden Sie [in diesem IB-Artikel](https://interactivebrokers.github.io/tws-api/historical_limitations.html).

*Hinweis:*

1 Instrument in 3 Zeiteinheiten = 3 Historien \
1 Analyzer Spalte = 1 Historie \
Watchlisten, Backtest-Listen, Indikatoren und Alarme benötigen ebenfalls Historien.

<figure><img src="/files/G9xVPhVTN2NrNf5Jl2x7" alt=""><figcaption></figcaption></figure>

Für jeden Trade/Order, der in der TWS läuft, sind entsprechende L1 + Options-Zeichnungen erforderlich und könnten eine "Überlastung" verursachen.

#### Limitation <a href="#limitation" id="limitation"></a>

Für jede Balkengröße bietet AgenaTrader historische Daten für einen begrenzten Zeitraum an

\
Bitte siehe Tabelle unten:

| Bar Size        | Time Period  |
| --------------- | ------------ |
| 1 - 4 sec bars  | 30 min back  |
| 5 - 9 sec bars  | 1 h back     |
| 10 -29 sec bars | 4 h back     |
| 30 - 59 sec     | 8 h back     |
| 1 min           | 1 day back   |
| 2 min           | 2 days back  |
| 3 - 29 min      | 1 week back  |
| 30 m - 1439 min | 1 month back |
| 1-23 h          | 1 month back |
| EoD (1 Day)     | 1 year back  |

#### Futures-Kontrakte <a href="#futures-kontrakte" id="futures-kontrakte"></a>

Die API von IB unterstützt keine Continuous Cotracts. Das bedeutet, dass AgenaTrader nur einen Kontrakt anzeigen kann, z.B.: Front Month. Um Daten in der TWS mit AgenaTrader vergleichen zu können, sollten daher keine Continuus Contracts verwendet werden.

&#x20;\
**Unterstützte Zeitzonen**

| Zeitzone | Beschreibung             |
| -------- | ------------------------ |
| GMT      | Greenwich Mean Time      |
| EST      | Eastern Standard Time    |
| MST      | Mountain Standard Time   |
| PST      | Pacific Standard Time    |
| AST      | Atlantic Standard Time   |
| JST      | Japan Standard Time      |
| AET      | Australian Standard Time |

\
Bitte laden Sie die [**API Reference Guide.pdf** ](https://www.interactivebrokers.com/download/newMark/PDFs/APIprintable.pdf) (nur Englisch) Datei herunter. Zeitzonen in Kapitel 9, Seite 571

#### Verzögerte Daten <a href="#verz_gerte_daten" id="verz_gerte_daten"></a>

\
Für die Lieferung historischer Daten wird ein Marktdatenabo benötigt, was bedeutet, dass Sie keine Charts angezeigt bekommen, wenn Sie verzögerte Daten geliefert bekommen.

#### Chartdarstellung ist im AgenaTrader anders als in der TWS <a href="#chartdarstellung_ist_im_agenatrader_anders_als_in_der_tws" id="chartdarstellung_ist_im_agenatrader_anders_als_in_der_tws"></a>

Über das aktuelle IB API bekommen wir keinen Zeitstempel zum Tick. Als Resultat daraus werden einige Ticks dem vorangegangener oder dem nächsten\
Bar zugeordnet. Speziell in Systemen welches eine falsche System-Zeit eingestellt haben. Hier versuchen wir durch eine [**Systemzeit-Synchronisation**](broken://pages/-MKj5z7O7yCu_6UbCw7t). &#x20;

### **FAQ** <a href="#can-i-connect-to-an-additional-data-feed-when-using-ib-as-broker" id="can-i-connect-to-an-additional-data-feed-when-using-ib-as-broker"></a>

#### Kann ich einen zusätzlichen Datenfeed nutzen, wenn ich IB als Broker verwende? <a href="#can-i-connect-to-an-additional-data-feed-when-using-ib-as-broker" id="can-i-connect-to-an-additional-data-feed-when-using-ib-as-broker"></a>

Sie können die von **Interactive Brokers** bereitgestellten Marktdaten verwenden, allerdings gibt es einige **Einschränkungen bei historischen Abfragen**. Weitere Informationen zu **historischen Abfragebeschränkungen** und anderen relevanten Details finden Sie im Abschnitt **„Wichtige Informationen zu IB“**.

Um diese Einschränkungen zu umgehen, bietet Ihnen **AgenaTrader** die Möglichkeit, einen **zusätzlichen professionellen Datenfeed** (z. B. **Taipan, Barchart oder IQFeed**) zu verbinden. Dafür ist die Eröffnung eines separaten Kontos bei einem dieser Anbieter erforderlich.

In **Main -> Verbindungen** können Sie direkt ein neues Datenfeed-Konto hinzufügen, indem Sie auf **„Neues Konto hinzufügen“** klicken.

<figure><img src="https://docs.agenatrader.com/~gitbook/image?url=https%3A%2F%2F2805764894-files.gitbook.io%2F%7E%2Ffiles%2Fv0%2Fb%2Fgitbook-legacy-files%2Fo%2Fassets%252F-MKZSsJBtSP9L4sqIe_q%252F-MPhn7zlMCA093nNUSJf%252F-MPiBPVcMDVowHBOQYZj%252FAddNewAccount.png%3Falt%3Dmedia%26token%3D2c41b334-3074-4e07-b5b7-d3b3bb2c0aa4&#x26;width=768&#x26;dpr=4&#x26;quality=100&#x26;sign=d821c5b5&#x26;sv=1" alt=""><figcaption></figcaption></figure>

Wählen Sie Ihren **Datenfeed-Anbieter** aus, vergeben Sie einen **Kontonamen** (zur besseren Übersicht empfehlen wir, den Namen des Datenfeed-Anbieters als Kontonamen zu verwenden) und geben Sie im **Kontextmenü** die **Zugangsdaten** ein, die Sie von Ihrem Datenfeed-Anbieter erhalten haben.

⚠ **Wichtiger Hinweis!**\
Es ist entscheidend, dass Sie in den **Kontoverbindungseinstellungen** genau festlegen, welche **Daten aus dem Datenfeed** und welche **von IB** bezogen werden sollen. Dies ist besonders wichtig, da **IB Indizes-CFDs nicht von einem externen Datenfeed** abgerufen werden können, sondern ausschließlich **direkt von IB** bezogen werden müssen.

#### **Beispiel:** Taipan als Datenfeed-Anbieter <a href="#example-taipan-as-data-feed-provider" id="example-taipan-as-data-feed-provider"></a>

In **Konto-Verbindungen** unter dem Reiter **"Verbindungen"** müssen Sie nun folgende Einstellungen vornehmen:

* **IB als Broker und Datenfeed aktivieren**
* **Taipan nur als Datenfeed aktivieren**

Diese Konfiguration stellt sicher, dass **Brokerage-Dienste über IB** laufen, während **Marktdaten von Taipan** bezogen werden.

<figure><img src="https://docs.agenatrader.com/~gitbook/image?url=https%3A%2F%2F2805764894-files.gitbook.io%2F%7E%2Ffiles%2Fv0%2Fb%2Fgitbook-legacy-files%2Fo%2Fassets%252F-MKZSsJBtSP9L4sqIe_q%252F-MPhn7zlMCA093nNUSJf%252F-MPiBPVeaX76uo_z9WgF%252FConnections.png%3Falt%3Dmedia%26token%3Dd7a3015d-8971-4af8-9fb4-f5ae64155552&#x26;width=768&#x26;dpr=4&#x26;quality=100&#x26;sign=72705c5f&#x26;sv=1" alt=""><figcaption></figcaption></figure>

Im Tab **„Datafeeds“** müssen nun die **Instrumententypen** festgelegt werden.

⚠ **Wichtiger Hinweis:**\
Vermeiden Sie es, dieselben **Instrumententypen** für beide Datenfeeds auszuwählen, da dies beim **Verbinden von AgenaTrader mit IB und Taipan** zu einer **Fehlermeldung** führen kann.

* **Für IB:** Wählen Sie **nur CFDs** aus.
* **Für Taipan:** Wählen Sie **alle Instrumententypen außer CFDs**, für die Sie ein Abonnement abgeschlossen haben.

Diese Konfiguration stellt sicher, dass es keine **Datenkonflikte** zwischen den beiden Datenquellen gibt.

<figure><img src="https://docs.agenatrader.com/~gitbook/image?url=https%3A%2F%2F2805764894-files.gitbook.io%2F%7E%2Ffiles%2Fv0%2Fb%2Fgitbook-legacy-files%2Fo%2Fassets%252F-MKZSsJBtSP9L4sqIe_q%252F-MPhn7zlMCA093nNUSJf%252F-MPiBPVf-fEZ0YZlYuhf%252Fdata%2520feed.png%3Falt%3Dmedia%26token%3Df25e0c4f-6649-4367-a4b8-f445396ecb32&#x26;width=768&#x26;dpr=4&#x26;quality=100&#x26;sign=a145ef48&#x26;sv=1" alt=""><figcaption></figcaption></figure>

#### Welche Einstellungen sind beim Handel mit Futures über IB zu beachten? <a href="#which-settings-do-i-have-to-consider-when-trading-futures-with-ib" id="which-settings-do-i-have-to-consider-when-trading-futures-with-ib"></a>

Die **IB API unterstützt keine Continuous Contracts**. Das bedeutet, dass AgenaTrader nur **einen einzelnen Kontrakt**, z. B. den **FrontMonth**, anzeigen kann. Um sicherzustellen, dass die angezeigten Daten in der **TWS und AgenaTrader übereinstimmen**, sollten Sie **keine Continuous Contracts** in IB verwenden.

Allerdings besteht die Möglichkeit, **einen zusätzlichen Datenfeed** zu nutzen, um **Continuous Contracts** anzuzeigen.

**Dazu gibt es zwei Möglichkeiten:**

1️⃣ **IB als „Broker“ und den externen Datenfeed als „Datenfeed“ nutzen:**

* In den **Kontoverbindungen** im Reiter **„Verbindungen“** wählen Sie für IB die Option **„Broker“**.
* Ihren zusätzlichen **Datenfeed** wählen Sie als **„Datenfeed“** aus.

2️⃣ **IB ebenfalls als Datenfeed verwenden:**

* In diesem Fall müssen Sie für **IB und Ihren zusätzlichen Datenfeed unterschiedliche Instrumententypen im „Datafeed“-Tab auswählen**.
* Beispiel:
  * **IB**: Aktien & CFDs
  * **Externer Datenfeed**: Futures, Währungen & Indizes

**Einstellungen im InstrumentEditor:**

* Im **InstrumentEditor** müssen Sie den gewünschten **Futures-Kontrakt in den Mapping-Einstellungen** Ihres Datenfeeds auswählen.
* **Wichtig:**
  * **Das Ablaufdatum (Expiry) ist entscheidend für die Orderübermittlung.**
  * **Die Mapping-Einstellungen Ihres Datenfeeds sind relevant für die Anzeige der Kontrakte.**

Diese Konfiguration sorgt für eine **korrekte Darstellung und problemlose Orderübertragung** beim Handel mit Futures über IB und andere Datenfeeds.

<figure><img src="https://docs.agenatrader.com/~gitbook/image?url=https%3A%2F%2F2805764894-files.gitbook.io%2F%7E%2Ffiles%2Fv0%2Fb%2Fgitbook-legacy-files%2Fo%2Fassets%252F-MKZSsJBtSP9L4sqIe_q%252F-MPhn7zlMCA093nNUSJf%252F-MPiBPVhwuMfYmmEeqvr%252FKontrakte.png%3Falt%3Dmedia%26token%3D43115ced-20b5-46ce-9e55-bf497763c9d5&#x26;width=768&#x26;dpr=4&#x26;quality=100&#x26;sign=e08d1f03&#x26;sv=1" alt=""><figcaption></figcaption></figure>

#### Gebühren im Preis <a href="#geb_hren_im_preis" id="geb_hren_im_preis"></a>

\
**Interactive Brokers** integriert die **Gebühren direkt in den Preis** einer Einstiegsorder. Das bedeutet, dass der auf dem Chart angezeigte **Einstiegspreis** wie folgt berechnet wird:

📌 **Einstiegspreis = Orderpreis + Kommission**

Bei kurzen Zeitrahmen oder kleinen Positionen kann diese Darstellung **verwirrend wirken**, da der tatsächliche Einstiegspreis nicht klar von den Gebühren getrennt wird. **AgenaTrader kann die Kommissionen nicht separat ausweisen**, da die API von IB die Daten bereits in dieser Form übermittelt.

**Zukünftige Lösung:**

Wir planen, dieses Problem zu beheben, indem wir eine Funktion einführen, die es Tradern ermöglicht, **manuell die exakten Werte des Brokers** für **Profit & Loss, Kommissionen und weitere Spalten** einzugeben. Diese Funktion wird in einer der kommenden **AgenaTrader-Versionen** implementiert.

Falls Sie die **genauen Beträge für Gewinne, Verluste oder Kommissionen** erfahren möchten, wenden Sie sich bitte direkt an Ihren **Broker**.

#### Unterschiede beim Gewinn\&Verlust (G\&V) zwischen AgenaTrader und TWS <a href="#unterschiede_beim_gewinn_amp_verlust_g_amp_v_zwischen_agenatrader_und_tws" id="unterschiede_beim_gewinn_amp_verlust_g_amp_v_zwischen_agenatrader_und_tws"></a>

AgenaTrader und TWS berechnen G\&V auf unterschiedliche Weise. So können die Ergebnisse abweichen: &#x20;

<figure><img src="/files/on8lu3aub1SzGOvTw3It" alt=""><figcaption></figcaption></figure>

Bitte lesen Sie mehr über Währungen und Umrechnung im Kapitel: [**Order Escort: Account-Tab**](broken://pages/-MKjAngA-T0OAdo1mZtl#Order_Escort__Account_Tab)

{% hint style="info" %}
Angaben in Pennies oder USD-Cents, werden in GBP oder USD mit einem Multiplikator umgerechnet. (100x mehr).
{% endhint %}

Folgende Sybmole sind davon betroffen:

CT Cotton \
GF Feeder Cattle Futures \
HE Lean Hog Futures \
LE Live Cattle \
ZL Soybean Oil Futures \
ZO Oat Futures \
ZR Rough Rice Futures \
ZS Soybean Futures \
ZW Wheat Futures \
XK MINI SIZED SOYBEAN FUTURES \
CT.I Cotton No. 2 \
DPW\.L DP WORLD LIMITED ORD USD2 (DI) \
ZC Corn Futures

#### Interactive Brokers gibt einen Error code aus <a href="#interactive_brokers_gibt_einen_error_code_aus" id="interactive_brokers_gibt_einen_error_code_aus"></a>

<figure><img src="/files/n5OWLd2hsltncfuZpkPf" alt=""><figcaption></figcaption></figure>

Bitte wenden Sie sich zur Klärung an den IB-Support.

*Hinweis: Die IB "ErrorMeldungen" sind lediglich IB interne Codes.* [**Hier**](https://goo.gl/o8NjqC) finden Sie alle IB Codes.

110 - The price does not conform to the minimum price variation for this contract.(Der Preis entspricht nicht der Mindest-Preisanpassung dieses Kontrakts.)\
AgenaTrader Lösung: Bitte passen Sie die Ticksize jener in der TWS an.

200 - Es wurde keine Wertpapierdefinition gefunden.\
AgenaTrader Lösung: Bitte importieren Sie die Mappings oder fügen Sie das korrigierte Mapping manuell im InstrumentEditor hinzu.

Ordergröße übersteigt gehebelte FX-Position\
AgenaTrader Lösung: Verringern Sie die Ordergröße oder erhöhen SIe die Kontogröße.<br>

{% hint style="info" %}
**Wichtig!** Wenn der User ein Instrument tradet, das an verschiedenen Börsen gehandelt werden kann, erhält er eine spezifische Meldung im Protokoll. Zum Beispiel, wenn er eine Order für BMW\.FF (Börse Frankfurt) platziert und diese Order wird für BMW\.DE ausgeführt (Xetra), dann erhält er folgende Nachricht:

***"Your orders to BMW\.FF are resolved to primary exchange which is located on different instrument - BMW\.DE"***
{% endhint %}

#### Anpassung der Tickgröße für CFDs entsprechend dem aktuellen Preis <a href="#anpassung_der_tickgr_e_f_r_cfds_entsprechend_dem_aktuellen_preis" id="anpassung_der_tickgr_e_f_r_cfds_entsprechend_dem_aktuellen_preis"></a>

\
Bitte beachten Sie, dass Interactive Brokers verschiedene TickGrößen nach einer bestimmten PreisRange verwendet. Es könnte passieren, dass beim Handel von einigen europäischen CFDs der Benutzer die folgenden Fehlermeldungen bekommt:\
1\. "The price does not conform to the minimum price variation for the contract".\
2\. "Instrument Tick-Size is not calculated or delivered yet".\
In so einem Fall ist es erforderlich, die Tick-Größe für das Instrument manuell einzustellen.\
Durch die Eingabe eines Ticker-Namen auf der [IB-Webseite](https://www.interactivebrokers.com/en/?f=/en/general/contact/tipsContractsDatabaseSearch.php?ib_entity=llc) ist es möglich, die Preisparameter für das gewählte Instrument zu sehen.

<figure><img src="/files/qZJkXi5JvWivb46qpUij" alt=""><figcaption></figcaption></figure>

Bitte geben Sie die richtige Tick-Größe in das **Instruments-Fenster** laut dem aktuellen Preis ein und markieren Sie die **Pin Tick Größe**-Checkbox wie auf dem Bild unten dargestellt:

<figure><img src="/files/zNwX7vnwnjjrvGkaztwp" alt=""><figcaption></figcaption></figure>

\
**Gateway**

Sie finden eine Anleitung zur Verwendung des IB-Gateway [HIER](broken://pages/-MLDZgNfl7HdgUF3WAx_)

**Finacial Adviser Konto bei Interactive Brokers**

Sie finden eine Anleitung zur Verwendung von IB-FA-Accounts [HIER](broken://pages/-MLDZgNfl7HdgUF3WAx_#IB_Financial_Advisor_Accounts)

### Instrument und Order zuweisen bei Interactive Brokers <a href="#instrument_und_order_zuweisen_bei_interactive_brokers" id="instrument_und_order_zuweisen_bei_interactive_brokers"></a>

"Resolve position instrument"-Popup bzw. "Resolve instruments for orders"-Popup\
Mit Interactive Brokers gibt es manchmal Fälle, bei denen eine Interactive Brokers-Order nicht eindeutig zu einem Instrument in AgenaTrader zugeordnet werden kann.\
Die Ursache ist, dass bei Interactive Brokers gleiche Symbol-Bezeichnungen für verschiedene Instrumente verwendet werden.\
Z.B. ist die Aktie mit dem Interactive Brokers-Kürzel „AAPL“ an der NASDAQ als auch an der XETRA gelistet. In AgenaTrader gibt es für die Aktie AAPL ein Instrument mit Namen "AAPL" für die NASDAQ und ein Instrument mit Namen "AAPL.DE" für die XETRA.

Je nachdem an welcher Börse man gehandelt hat, kann es nun notwendig sein, dass man die Order dem richtigen AgenaTrader-Instrument zuordnet.\
In AgenaTrader wurde zwar ein Prozess integriert, der sicherstellt, dass die Symbole richtig zugeordnet werden. Jedoch kann dieser Prozess nicht angewendet werden, wenn eine Order direkt in der TWS eingegeben wird.

In diesem Fall erscheint das "Resolve position instrument" Popup, in welchem man für die Interactive Brokers Order, das richtige Instrument in AgenaTrader zuweisen muss.

Im Fall der Aktie AAPL, würde man jene:

* die an der NASDAQ gehandelt wurde dem AgenaTrader-Instrument "AAPL" zuweisen, und
* die, die an der XETRA gehandelt wurde, dem AgenaTrader-Instrument "APC.DE" zuweisen.

<figure><img src="/files/iLga1gFos8bb1aLlUKOa" alt=""><figcaption></figcaption></figure>

Exkurs: Symbol-Eingabe in der TWS (Beispiel: AAPL)\
&#x20;&#x20;

<figure><img src="/files/apujyqhtCGqskAPU8glv" alt=""><figcaption></figcaption></figure>

&#x20; &#x20;

<figure><img src="/files/anjU53sRNgEHMDZR0JAl" alt=""><figcaption></figcaption></figure>

AgenaTrader ist in der Lage, die Instrumentenauswahl automatisch zu lösen, indem entweder das beliebteste oder das zuletzt ausgewählte Instrument angewendet wird. Um die automatische Lösung zu aktivieren, wählen Sie bitte aus, wie lange AgenaTrader auf Ihre Reaktion warten soll, bevor er Ihre Positionen automatisch auflöst:

<figure><img src="https://docs.agenatrader.com/~gitbook/image?url=https%3A%2F%2F2805764894-files.gitbook.io%2F%7E%2Ffiles%2Fv0%2Fb%2Fgitbook-x-prod.appspot.com%2Fo%2Fspaces%252F-MKZSsJBtSP9L4sqIe_q-887967055%252Fuploads%252FWA24yrCZNS7ONH5nCzY1%252Fimage.png%3Falt%3Dmedia%26token%3D44cd9448-daaa-461e-a98c-2130c1d778c1&#x26;width=768&#x26;dpr=4&#x26;quality=100&#x26;sign=47ff511def0131d5561055f328c961ff943665e4dbcdf896bf7fc997dfb9a96c" alt=""><figcaption></figcaption></figure>

Beispiel:&#x20;

* 0 Sekunden bedeutet, dass AgenaTrader Ihre Positionen niemals automatisch auflöst.
* 5 Sekunden bedeutet, dass AgenaTrader Ihre Positionen auflöst, wenn Sie das Fenster für 5 Sekunden unberührt lassen.&#x20;

Diese Einstellung ist nützlich, wenn Sie während des geplanten erneuten Verbindens nicht vor Ihrem PC sitzen.

### AgenaTrader++ (plusplus) Resolve Setup <a href="#agenatrader_plusplus_resolve_setup" id="agenatrader_plusplus_resolve_setup"></a>

Diese Funktionalität ist ein grundlegendes Feature von AgenaTrader++ (plusplus). Hiermit erhalten Sie ein sehr mächtiges Werkzeug, welches es mit größter Sorgfalt einzusetzen gilt.

**AgenaTrader++ (plusplus) Resolve Setup funktioniert folgendermaßen:**

* Wenn AgenaTrader geschlossen wird und es laufen AgenaTrader++ Strategien, so werden die Strategien gespeichert
* Beim Wiederöffnen der Plattform werden die Strategien am aktuellen Markt angepasst.

Wenn Sie einen geplanten Intraday-Trade über Nacht halten wollen, und AgenaTrader++ Setups am Laufen haben, sollten Sie den AgenaTrader nicht abschalten, da dies zu unerwünschten Orderverhalten führen kann. Zum Beispiel, wenn Sie IfDone/OCO Orders im Markt liegen haben, die über AgenaTrader gemanagt werden, liegen diese (meist) nicht verknüpft beim Broker, da viele Broker spezielle Ordervarianten nicht unterstützen. Um die gewünschte Funktionalität von AT++ und den eingegebenen Setups zu erhalten, muss AT aktiv sein.

Falls etwas passiert ist (d.h. Orders wurden gefüllt, Trades geschlossen, Orders storniert) als AgenaTrader nicht gelaufen ist, werden die Stops neu berechnet, aber auch Positionen bzw. Setups angepasst. Dies birgt somit Gefahrenpotential in sich.

In diesem Fall erhalten Sie ein Wiederherstellungs-Popup (Bild), welches die Trades/Setups anzeigt, bei denen Handlungsbedarf besteht und welche Sie dann auch kontrollieren müssen:

<figure><img src="/files/ZSgRJBwUxOXWUIIW1U9t" alt=""><figcaption></figcaption></figure>

*Danach öffnet sich das Recovery-Popup mit den Buttonsfunktionen:*

* Über den Button **Entry Escort** können Sie das Setup, welches Sie benutzt haben, eingeben. **Hinweis:** im Tab **Trades** finden Sie Ihren gewählten Einstiegsgrund.
* Der Button **Session** erlaubt es dem Benutzer, die Analysator Session zu wählen.
* Über den Button **Confirm** können Sie die vorgeschlagene Aktion durchführen.

Wird der Button nicht betätigt und das Popup ggeschlossen, so müssen die Trades/Setups manuell bereinigt werden

{% hint style="info" %}
**Achtung!**\
Für einige Symbole erlaubt TWS nicht, Limit Orders außerhalb der Handelszeiten zu platzieren
{% endhint %}

### Wissenswertes Interactive Brokers (IB) <a href="#wissenswertes_interactive_brokers_ib_" id="wissenswertes_interactive_brokers_ib_"></a>

#### Meldung: "Der Registrierungsschlüssel für 'Trader Workstation' kann nicht gefunden werden" <a href="#meldung-_der_registrierungsschl_ssel_f_r_trader_workstation_kann_nicht_gefunden_werden_" id="meldung-_der_registrierungsschl_ssel_f_r_trader_workstation_kann_nicht_gefunden_werden_"></a>

Diese Meldung tritt auf, wenn Sie die API Einstellungen in der TWS noch nicht gesetzt haben.\
Sie finden die Anleitung [**hier**](https://www.youtube.com/watch?v=prdJWAIHQK0) wenn Sie den Broker "aufklappen" unter ConnectionGuide.\
Prüfen Sie außerdem ob die Datei tws.exe im Hauptverzeichnis "Jts" installiert wurde. Sollte ein Unterverzeichnis erstellt worden sein, dann müssen alle dort befindlichen Dateien in das Hauptverzeichnis verschoben werden, damit der AgenaTrader die TWS automtatisch starten kann.

#### Port Einstellungen <a href="#port_einstellungen" id="port_einstellungen"></a>

\
Port-Einstellungen in TWS und AgenaTrader müssen synchronisiert werden, , wenn es zu Verbindungsproblemen kommt. D.h., dass unter "Port" die gleiche Nummer eingetragen sein muss.

<figure><img src="https://docs.agenatrader.com/~gitbook/image?url=https%3A%2F%2F1347375179-files.gitbook.io%2F%7E%2Ffiles%2Fv0%2Fb%2Fgitbook-legacy-files%2Fo%2Fassets%252F-MKZSsJBtSP9L4sqIe_q%252F-MP8fsMF4q1UaIfWtFf4%252F-MP8wxqJWnNnbDaIvI8T%252FIB_port.png%3Falt%3Dmedia%26token%3D114b5ec7-bd6e-4f12-8b54-89bd807095e1&#x26;width=768&#x26;dpr=4&#x26;quality=100&#x26;sign=aebef476&#x26;sv=1" alt=""><figcaption></figcaption></figure>

Bitte verwenden Sie folgende Ports:

**7497** - Demo account\
**7496** - Live account

\
Für Details bitte herunterladen [**IB Host and Ports Documentation**](https://issues.agenatrader.com/attachments/download/15123/IB%20Host%20and%20Ports.pdf) Datei.\
&#x20;

#### Automatische Wiederverbindung <a href="#automatische_wiederverbindung" id="automatische_wiederverbindung"></a>

AgenaTrader hat grundsätzlich eine Logik entwickelt, dass bei ungewolltem Verbindungsabbruch automatisch neu verbunden wird. Sollten Sie jedoch einen VPS Server verwenden und diesen per Windows Remote Desktop ansteuern, dann kann es zu Problemen damit kommen. Sobald der Windows Remote Desktop beendet wird, sind alle Windows Funktionen zum Starten von Programmen gesperrt, was dazu führt, dass die Wiederverbindung nicht funktioniert. Bitte verwenden Sie daher alternative Remote Programme wie Teamviewer oder Anydesk.

#### ClientID <a href="#clientid" id="clientid"></a>

In manchen Fällen kann der User eine Benachrichtigung erhalten:

<figure><img src="https://docs.agenatrader.com/~gitbook/image?url=https%3A%2F%2F1347375179-files.gitbook.io%2F%7E%2Ffiles%2Fv0%2Fb%2Fgitbook-legacy-files%2Fo%2Fassets%252F-MKZSsJBtSP9L4sqIe_q%252F-MP8fsMF4q1UaIfWtFf4%252F-MP8xDwT5RxzttZc3We4%252FIB_notification.png%3Falt%3Dmedia%26token%3D9da25df5-a78d-49ea-ad72-a63e7563a78e&#x26;width=768&#x26;dpr=4&#x26;quality=100&#x26;sign=fbc267f1&#x26;sv=1" alt=""><figcaption></figcaption></figure>

Das bedeutet, dass die Client-ID im AT und der TWS unterschiedlich sind. Die Client-ID zwischen AT und TWS muss synchron sein, da ansonsten Informationen nicht korrekt zum AT übermittelt werden. Um dies zu vermeiden, sollte der User die Client-IDs synchronisieren oder sie im AT auf "0" setzen und in der TWS löschen.

<figure><img src="/files/6JOIGh5RvGppqMXINaPt" alt=""><figcaption></figcaption></figure>

### Wie man die TWS-Version von der aktuellsten auf die stabile Version ändert

\
Im Standard wird immer die aktuellste Version der TWS installiert. Um auf die letzte stabile Version umzusteigen, folgen Sie bitte dieser Anleitung:

* Öffnen Sie das Installationsverzeichnis der TWS und führen Sie die TWS.exe aus. Der Standard-Installationspfad lautet: C:\Jts (für Captrader: C:\Jts\generisch)

<figure><img src="https://docs.agenatrader.com/~gitbook/image?url=https%3A%2F%2F1347375179-files.gitbook.io%2F%7E%2Ffiles%2Fv0%2Fb%2Fgitbook-legacy-files%2Fo%2Fassets%252F-MKZSsJBtSP9L4sqIe_q%252F-MPEsNvvtjP2k0b1-L-6%252F-MPEyFH1n7cmAoIG-aMM%252FTWS%2520path.png%3Falt%3Dmedia%26token%3D606254f9-180c-4ae4-afe2-c617faf31493&#x26;width=768&#x26;dpr=4&#x26;quality=100&#x26;sign=627e26e5a360d630c8e63423b48579f95b618da94b0621c7c06f4934c6152add" alt=""><figcaption></figcaption></figure>

* Es erscheint ein Login-Fenster. Klicken Sie dort auf More Options.

<figure><img src="https://docs.agenatrader.com/~gitbook/image?url=https%3A%2F%2F1347375179-files.gitbook.io%2F%7E%2Ffiles%2Fv0%2Fb%2Fgitbook-legacy-files%2Fo%2Fassets%252F-MKZSsJBtSP9L4sqIe_q%252F-MPEsNvvtjP2k0b1-L-6%252F-MPEyd-BpTz8hwTdfe-c%252FYWS%2520more%2520option.png%3Falt%3Dmedia%26token%3D9f2e4812-3614-4908-99a9-eae122a23068&#x26;width=768&#x26;dpr=4&#x26;quality=100&#x26;sign=8151b64f9748a7fc3735a2a1f292afe8ba9dcec27c14f5f514363f3f6fd0909b" alt=""><figcaption></figcaption></figure>

* Jetzt sind erweiterte Einstellungen zu sehen. Im Dropdown-Menü "Version" wählen Sie "Stable"

<figure><img src="https://docs.agenatrader.com/~gitbook/image?url=https%3A%2F%2F1347375179-files.gitbook.io%2F%7E%2Ffiles%2Fv0%2Fb%2Fgitbook-legacy-files%2Fo%2Fassets%252F-MKZSsJBtSP9L4sqIe_q%252F-MPEsNvvtjP2k0b1-L-6%252F-MPEyi14Nw6fe2oxfSvV%252FTWS%2520stable.png%3Falt%3Dmedia%26token%3D177731d4-c55e-4ce1-b288-e44296e48004&#x26;width=768&#x26;dpr=4&#x26;quality=100&#x26;sign=e1ad57b67f4c3883565fafa53505270837f8178c81f74a53e82037efd61c90b7" alt=""><figcaption></figcaption></figure>

* Bestätigen Sie die gemachten Änderungen mit dem Button "Apply & Restart"

<figure><img src="https://docs.agenatrader.com/~gitbook/image?url=https%3A%2F%2F1347375179-files.gitbook.io%2F%7E%2Ffiles%2Fv0%2Fb%2Fgitbook-legacy-files%2Fo%2Fassets%252F-MKZSsJBtSP9L4sqIe_q%252F-MPEsNvvtjP2k0b1-L-6%252F-MPEypHJtQUSUD9BLD1O%252FYWS%2520apply.png%3Falt%3Dmedia%26token%3D1c4bbc10-81c3-4208-a545-2fda68a9653b&#x26;width=768&#x26;dpr=4&#x26;quality=100&#x26;sign=0a1c337d79cd6a2eb35d1927db0c042f743ee80cada94ed7301b159b48453e96" alt=""><figcaption></figcaption></figure>

Sobald der Installationsprozess abgeschlossen ist, wird die letzte stabile Version der TWS gestartet

<figure><img src="/files/p5L2ipt4dlNqICM3pudl" alt=""><figcaption></figcaption></figure>

### Historischer Request Overflow bei IB

**Problemstellung**

**Was ist passiert?**

* AgenaTrader gibt per PopUp eine Warnung aus:

![](https://docs.agenatrader.com/~gitbook/image?url=https%3A%2F%2F1347375179-files.gitbook.io%2F%7E%2Ffiles%2Fv0%2Fb%2Fgitbook-legacy-files%2Fo%2Fassets%252F-MKZSsJBtSP9L4sqIe_q%252F-MPEsNvvtjP2k0b1-L-6%252F-MPEvEEetFJDGOf0p4al%252FHistorienRequestOverflow.png%3Falt%3Dmedia%26token%3D75c1cb9a-681b-4d50-ac26-6ad5dafe30dc\&width=768\&dpr=4\&quality=100\&sign=9ee67c32\&sv=1)

* Charts werden teilweise nicht richtig dargestellt und enthalten fehlerhafte Daten
* Historien fehlen und Charts ticken nicht

**Was bedeutet das?**

Die maximale Anzahl der gleichzeitig offenen historischen Daten-Requests von der IB API beträgt 50. Daher sollten Sie darauf achten, dass Sie eine kleinere Anzahl von Anfragen gleichzeitig anstehend haben.

**Pacing Violations bei kleinen Bars (30 Sekunden oder weniger)** Eine Pacing Violation tritt auf, wenn Sie eine oder mehrere der folgenden Einschränkungen nicht beachten: -> Identische Abfrage historischer Daten innerhalb von 15 Sekunden. -> Sechs oder mehr historische Daten-Requests für denselben Contract, Exchange und Tick Typ innerhalb von zwei Sekunden. -> Mehr als 60 Anfragen innerhalb eines Zeitraums von zehn Minuten.

Seien Sie jedoch vorsichtig, wenn Sie große Mengen an historischen Daten anfordern oder historische Daten-Requests senden, da weiterhin ein "Soft Limit" implementiert ist. Wenn Sie zu viele historische Daten anfordern, werden Sie vom API-Client getrennt. Weitere Informationen zu den Tempoverstößen für kleine Balken finden Sie [in diesem IB-Artikel](https://interactivebrokers.github.io/tws-api/historical_limitations.html).

{% hint style="info" %}
*Hinweis:*

1 Instrument in 3 Zeiteinheiten = 3 Historien 1 Analyzer Escort Spalte = 1 Historie Watchlisten, Backtest-Listen, Indikatoren und Alarme benötigen evenfalls Historien.
{% endhint %}

**Lösungsmöglichkeiten**

Reduzieren Sie Ihre Instrumente und historische Anfragen an den Interactive Broker Server. Beachten Sie dabei den grünen Verbindungsbalken links unten in Ihrem AgenaTrader:

![](https://docs.agenatrader.com/~gitbook/image?url=https%3A%2F%2F1347375179-files.gitbook.io%2F%7E%2Ffiles%2Fv0%2Fb%2Fgitbook-legacy-files%2Fo%2Fassets%252F-MKZSsJBtSP9L4sqIe_q%252F-MPEsNvvtjP2k0b1-L-6%252F-MPEvIk3zMGd8jTgwhAS%252FVerbindungsbalken.png%3Falt%3Dmedia%26token%3Dda177b86-41ae-4550-9d82-73b19268c4da\&width=768\&dpr=4\&quality=100\&sign=3a98536a\&sv=1)

Weitere Historien können nach erstmaliger Verbindung alle 10 Minuten angefordert werden. Bitte beachten Sie jedoch: Daten neu laden würde dann aber zu einem erneuten Historien Overflow führen.

Alternativ dazu würde sich auch ein externer - in den meisten Fällen jedoch kostenpflichtiger - Datenfeed empfehlen.

Hier geht es zur [Datenfeed Übersicht](https://agenatrader.com/de/marktdaten-echtzeit/).

Gilt auch für CapTrader, Banx, Lynx und andere Broker, welche an die API Schnittstellen der TWS anbinden.

## Rithmic

### Über Rithmic

Rithmic stellt Ihre Trades an erste Stelle. Egal ob Sie Teil eines Prop Shops oder professioneller Händler sind, die Trade-Ausführung-Software von Rithmic bietet eine Leistung mit so niedriger Latenz und hoher Durchsatzleistung, die bisher nur für sehr großen Handelshäuser und “Boutique”-Hedgefonds verfügbar war.

**Unterstützte Assetklassen:** Future, Stock

**Order-Verknüpfungen:** \
OCO Order-Verknüpfungen werden unterstützt\
ORO Order-Verknüpfungen werden lokal simuliert\
IFDone Order-Verknüpfungen werden lokal simuliert

**OrderAusführung**\
AgenaTrader führt keine Orders aus, wir bekommen nur Rückmeldungen seitens des Brokers dass eine Order mit einem bestimmten Preis\
ausgeführt worden ist. Simmen also zu einem Instrument die gelieferten Daten des Datenfeed-Lieferanten nicht mit den Quotes der\
Brokerplattform überein, kommt es zu einem Verhalten, dass Entry-\&Exit-Preise nicht zum Chartbid passen.

Folgen Sie diesem Link [**hier**](https://agenatrader.com/de/broker/rithmic/) zur Website.&#x20;

### Verbindung

Bitte folgen Sie den Anweisungen in folgendem Video um die Verbindung korrekt einzurichten:

{% embed url="<https://youtu.be/SGHhUnqPfJk>" %}

### Wichtige Informationen

Wenn Sie eine OCO Order-Verbindung bei Ihren Trades mit Rithmic erstellt haben, kann das Löschen einer der verknüpften Orders zu folgender Meldung führen: "You cannot cancel a cancelled order". Diese Meldung tritt dann auf, wenn AgenaTrader die Order-Löschung an Rithmic sendet, während Rithmic diese Order schon automatisch aus dem System gelöscht hat. Ihre Order wurde also bereits gelöscht und Sie können diese Meldung ignorieren.

Jeden Tag führt Rithmic ein Settlement der Positionen durch. Hier ein Beispiel für Positionen auf 6B, mit einer Long Positionen vom 21. Oktober. Abends gegen 22:25 Uhr schließt Rithmic alle Positionen mit dem Settlement Preis und eröffnet neue Positionen, welche mit dem Settlement Preis eröffnet werden. Das führt zu unterschiedlicher Anzeige im R Trader und im AgenaTrader betreffend zweier Hauptbereiche:\
\- Positionspreis\
\- Offener Gewinn und Verlust

![](/files/aHvpKrtVyEL6gzV2ePhD)

{% hint style="info" %}
**Achtung!** Rithmic zeigt keine Provision automatisch, jedoch können Sie diese manuell setzen.
{% endhint %}

&#x20;Fügen Sie diese Informationen mit der "C"-Taste zum Mapping-Bereich des InstrumentEditors hinzu. Einzelheiten: [Instrument-Editor: Neuanlage und Bearbeitung von Instrumenten](broken://pages/-MLCL_lCvp-zu8qGxrLN).

<figure><img src="/files/MddmOR1H27BcVkQNDtGD" alt=""><figcaption></figcaption></figure>

Damit die Verbindung zu Ihrem Rithmic Konto richtig hergestellt werden kann, sollten Sie bei Ihrem Broker anfragen, welcher System Typ (Server) für die Verbindung verwendet werden muss.\
Ein falscher Sytem Typ kann zu Fehlanzeigen führen, wie einer fehlenden Anzeige der Kontodaten.

<figure><img src="/files/AB9cWxCnb27O47MQwGPZ" alt=""><figcaption></figcaption></figure>

{% hint style="info" %}
**Achtung!** Rithmic liefert keine Ask Bid-Daten für den Vortag, so dass Sie OrderSteam nur für den heutigen Tag laden können. In einem anderen Fall erhalten Sie eine Meldung im Protokoll:\
*"Requested time (24 hours) of AskBid history is not available, please reduce amount of hours for OrderStream"*
{% endhint %}

{% hint style="warning" %}

#### Important Note <a href="#important_note-1" id="important_note-1"></a>

THE BROKER'S PLATFORM ALWAYS REPRESENTS THE REFERENCE PLATFORM.

This means that the orders and market-related values shown on the BROKER platform are valid. The broker's platform should always be active as a backup to AgenaTrader. This gives you an essential overview of the interaction between AgenaTrader and your broker. Furthermore, you will always know exactly how your orders/positions and ultimately your account balance are displayed.

Please note: **R Trader Pro** is required.
{% endhint %}

#### Important Note <a href="#important_note-1" id="important_note-1"></a>

THE BROKER'S PLATFORM ALWAYS REPRESENTS THE REFERENCE PLATFORM.

This means that the orders and market-related values shown on the BROKER platform are valid. The broker's platform should always be active as a backup to AgenaTrader. This gives you an essential overview of the interaction between AgenaTrader and your broker. Furthermore, you will always know exactly how your orders/positions and ultimately your account balance are displayed.

Please note: **R Trader Pro** is required.

### **Order-Verknüpfungen**

**MetaTrader 5 unterstützt keine Order-Verknüpfungen innerhalb von AgenaTrader.**

Während Sie **Orders über MetaTrader 5 ausführen** können, bietet die Plattform **kein automatisiertes Management für verbundene Orders**, wie:

* **OCO (One Cancels the Other)**
* **IfDone**
* **ORO (One Reduces the Other)**

***

#### **Was bedeutet das für Sie?**

Da **MetaTrader 5 keine integrierte Unterstützung für Order-Verknüpfungen** bietet, muss **AgenaTrader durchgehend aktiv bleiben**, um Ihre **automatisierten Handelsstrategien** auszuführen und die **verknüpften Stop- und Ziel-Orders korrekt zu verwalten**.

Falls **AgenaTrader nicht läuft**, funktionieren diese automatisierten Features **nicht wie erwartet** – in diesem Fall müssen Sie Ihre Trades **manuell überwachen**.


# Verbindungsanleitungen für Konten

Hier finden Sie die Direktlinks zu den entsprechenden Connection-Guides:

<table data-header-hidden><thead><tr><th width="389">Broker oder DatenFeed</th><th>Links</th></tr></thead><tbody><tr><td>Broker oder DatenFeed</td><td>Links</td></tr><tr><td>Interactive Brokers (IB)</td><td><a href="https://www.youtube.com/watch?v=prdJWAIHQK0&#x26;list=PLLftyBhQjHrWFFKZsRsmKCidwnfi0awne&#x26;index=3">Verbindungs-Anleitung für IB</a></td></tr><tr><td>CAP Trader</td><td><a href="https://www.youtube.com/watch?v=prdJWAIHQK0&#x26;list=PLLftyBhQjHrWFFKZsRsmKCidwnfi0awne&#x26;index=3">Verbindungs-Anleitung für CAP Trader</a></td></tr><tr><td>Dukaskopy</td><td><a href="https://www.youtube.com/watch?v=87mNiPeXNHQ&#x26;index=4&#x26;list=PLLftyBhQjHrWFFKZsRsmKCidwnfi0awne">Verbindungs-Anleitung für Dukascopy</a></td></tr><tr><td>FXCM</td><td><a href="https://www.youtube.com/watch?v=3dZRtG024cI&#x26;list=PLLftyBhQjHrWFFKZsRsmKCidwnfi0awne&#x26;index=6">Verbindungs-Anleitung für FXCM</a></td></tr><tr><td>MB-Trading</td><td><a href="https://www.youtube.com/watch?v=NUbiDujhVsY&#x26;index=11&#x26;list=PLLftyBhQjHrWFFKZsRsmKCidwnfi0awne">Verbindungs-Anleitung für MB-Trading</a></td></tr><tr><td>TeleTrader</td><td><a href="https://www.youtube.com/watch?v=x7RntTNBSEE&#x26;index=1&#x26;list=PLLftyBhQjHrXaoAyy3_S6SBhd_CqXXMjd">Verbindungs-Anleitung für TeleTrader</a></td></tr><tr><td>XTB</td><td><a href="https://www.youtube.com/watch?v=7joUEwUVDRA&#x26;index=5&#x26;list=PLLftyBhQjHrWFFKZsRsmKCidwnfi0awne">Verbindungs-Anleitung für XTB</a></td></tr><tr><td>Optimus</td><td><a href="https://www.youtube.com/watch?v=SGHhUnqPfJk&#x26;list=PLLftyBhQjHrWFFKZsRsmKCidwnfi0awne&#x26;index=7">Verbindungs-Anleitung für Optimus</a></td></tr><tr><td>RJO'Brien</td><td><a href="https://www.youtube.com/watch?v=2wLTutD2qnM&#x26;index=8&#x26;list=PLLftyBhQjHrWFFKZsRsmKCidwnfi0awne">Verbindungs-Anleitung für RJO'Brien</a></td></tr><tr><td>BarChart</td><td><a href="https://www.youtube.com/watch?v=pEMMCJSNOYM&#x26;index=4&#x26;list=PLLftyBhQjHrXaoAyy3_S6SBhd_CqXXMjd">Verbindungs-Anleitung für BarChart</a></td></tr><tr><td>IQFeed</td><td><a href="https://www.youtube.com/watch?v=xhcWndBrdFY&#x26;index=3&#x26;list=PLLftyBhQjHrXaoAyy3_S6SBhd_CqXXMjd">Verbindungs-Anleitung für IQFeed</a></td></tr><tr><td>LMAX</td><td><a href="https://www.youtube.com/watch?v=uNYArwfOzuI&#x26;list=PLLftyBhQjHrWFFKZsRsmKCidwnfi0awne&#x26;index=10">Verbindungs-Anleitung für LMAX</a></td></tr><tr><td>Rithmic</td><td><a href="https://www.youtube.com/watch?v=SGHhUnqPfJk&#x26;index=7&#x26;list=PLLftyBhQjHrWFFKZsRsmKCidwnfi0awne">Verbindungs-Anleitung für Rithmic Technologie Anbieter</a></td></tr><tr><td>FXFlat</td><td><a href="https://www.youtube.com/watch?v=prdJWAIHQK0&#x26;list=PLLftyBhQjHrWFFKZsRsmKCidwnfi0awne">Verbindungs-Anleitung für FXFlat Technologieanbieter</a></td></tr></tbody></table>

&#x20;Sehen Sie unter **Verbindungsanleitungen** in unserem [AgenaSpace](https://agenatrader.com/de/agenaspace-online-ausbildung/) die Videos über die Verbindung zu den jeweiligen Broker/Datafeeds.


# Verbindungen

## Verbindungen

In diesem Kapitel bekommen Sie notwendige Informationen über die Verbindungen zu den Broker bzw. Datenfeeds.

<figure><img src="/files/MVnsbrVWxgaWBPMOkLok" alt=""><figcaption></figcaption></figure>

| Option                        | Bedeutung                                                                                                                                                                                                                                                  |
| ----------------------------- | ---------------------------------------------------------------------------------------------------------------------------------------------------------------------------------------------------------------------------------------------------------- |
| Verbinden                     | Hier können Sie Ihren eingerichteten Broker/Datenfeed verbinden (siehe [Verbindungsanleitungen für Konten](https://docs.agenatrader.com/v/german/general/verbindungsanleitungen-fuer-konten)).                                                             |
| Verbindung lösen              | Hier können Sie Ihre aktiven Broker/Datenfeed lösen.                                                                                                                                                                                                       |
| Neues Konto hinzufügen        | Erstellen Sie eine neue Broker/Datenfeed verbindung. Detail auf Seite [**Kontoverbindungen: Verbindung anlegen oder ändern**](https://docs.agenatrader.com/v/german/general/multi-account-einstellungen/kontoverbindungen-verbindung-anlegen-oder-aendern) |
| Historien-Ladevorgang stoppen | Hier können Sie von Ihrem eben geraden aktivierten Broker/Datenfeed das Laden der Historie abbrechen.                                                                                                                                                      |
| Reload connected              | Laden Sie alle verbundenen Broker- und Datenfeed-Verbindungen neu.                                                                                                                                                                                         |

### Kontoverbindungen: Verbindung anlegen oder ändern

Öffnen Sie das Verbindungskontoeinstellungen Setup wie folgt:

1. Klicken Sie mit der linken Maustaste auf das ![31.07](https://docs.agenatrader.com/~gitbook/image?url=https%3A%2F%2F1347375179-files.gitbook.io%2F%7E%2Ffiles%2Fv0%2Fb%2Fgitbook-legacy-files%2Fo%2Fassets%252F-MKZSsJBtSP9L4sqIe_q%252F-MP94sEHsBtunBqWgdf0%252F-MP9893ndwMZYqwCtnlV%252F31.07.png%3Falt%3Dmedia%26token%3D24f474f4-3795-4346-9fe8-77633677c17a\&width=300\&dpr=4\&quality=100\&sign=8a0f22c6\&sv=1) Symbol in der Hauptmenüleiste oder
2. Klicken Sie in der Hauptmenüleiste auf **Tools** und wählen dort **Kontoverbindungen** aus

Über **Hinzufügen** bzw. **Bearbeiten** können Verbindungen angelegt bzw. geändert werden.

Anleitungen für die verschiedenen Broker/Datenfeed-Anbieter finden Sie auf der [Verbindungsanleitungen für Konten](https://docs.agenatrader.com/v/german/general/verbindungsanleitungen-fuer-konten) Seite.

<figure><img src="https://docs.agenatrader.com/~gitbook/image?url=https%3A%2F%2F1347375179-files.gitbook.io%2F%7E%2Ffiles%2Fv0%2Fb%2Fgitbook-legacy-files%2Fo%2Fassets%252F-MKZSsJBtSP9L4sqIe_q%252F-MP94sEHsBtunBqWgdf0%252F-MP98DK4JBxMMpLJSbVX%252Fadd.png%3Falt%3Dmedia%26token%3D1253e720-e232-44d1-9e06-3ab0bbfe3d66&#x26;width=768&#x26;dpr=4&#x26;quality=100&#x26;sign=89a040cc&#x26;sv=1" alt=""><figcaption></figcaption></figure>

Es erscheint zuerst das Definitions-Popup, in welchem der Verbindungsname und DatenFeed bzw. Broker ausgewählt werden kann.

Hinweis: der Verbindungsname kann/darf nicht mit einer Zahl beginnen.

<figure><img src="https://docs.agenatrader.com/~gitbook/image?url=https%3A%2F%2F1347375179-files.gitbook.io%2F%7E%2Ffiles%2Fv0%2Fb%2Fgitbook-legacy-files%2Fo%2Fassets%252F-MKZSsJBtSP9L4sqIe_q%252F-MP94sEHsBtunBqWgdf0%252F-MP98MzDgc2vNhrEMvTQ%252FDukascopy.png%3Falt%3Dmedia%26token%3D61d50452-f514-4262-9d02-946304eccbec&#x26;width=768&#x26;dpr=4&#x26;quality=100&#x26;sign=a6b795f9&#x26;sv=1" alt=""><figcaption></figcaption></figure>

Nach erfolgter Eingabe, kommt man mit dem Next-Button auf die Broker/Datenfeed-Anbieter spezifische Parameter-Seite (hier z.B. die von DukasCopy).

<figure><img src="https://docs.agenatrader.com/~gitbook/image?url=https%3A%2F%2F1347375179-files.gitbook.io%2F%7E%2Ffiles%2Fv0%2Fb%2Fgitbook-legacy-files%2Fo%2Fassets%252F-MKZSsJBtSP9L4sqIe_q%252F-MP94sEHsBtunBqWgdf0%252F-MP98QdS_M5dkm-lMDMp%252FDukascopy1.png%3Falt%3Dmedia%26token%3D67922e9b-ba59-4ff9-8c4a-1551f7847967&#x26;width=768&#x26;dpr=4&#x26;quality=100&#x26;sign=c7248f91&#x26;sv=1" alt=""><figcaption></figcaption></figure>

Über **Finish** wird die Eingabe verifiziert und gespeichert. Damit kann dieser Broker/DF auf der [Verbindungsdefinitions-Liste](https://docs.agenatrader.com/v/german/general/multi-account-einstellungen/kontoverbindungen) ausgewählt werden.

Nach dem Klick auf **Finish** erscheint noch das [Instrument-Import Popup](https://docs.agenatrader.com/v/german/menue-erklaerungen-and-inhalt/tool-menue/instrument-escort/import-und-export-von-instrumenten). Nach Auswahl und Import aller Börsen erscheint weiter der [**Allgemeine Einstellungen: Marktplatz-Escort**](https://docs.agenatrader.com/v/german/menue-erklaerungen-and-inhalt/tool-menue/konfigurations-escort#Konfigurations_Escort__Marktplatz_Escort) in dem man die Börsen-Zeiten erfassen kann.

### Request Demo <a href="#request_demo" id="request_demo"></a>

Via AgenaTrader user may request Datafeed demo licence: Please click on Request demo button

<figure><img src="https://docs.agenatrader.com/~gitbook/image?url=https%3A%2F%2F1347375179-files.gitbook.io%2F%7E%2Ffiles%2Fv0%2Fb%2Fgitbook-legacy-files%2Fo%2Fassets%252F-MKZSsJBtSP9L4sqIe_q%252F-MP94sEHsBtunBqWgdf0%252F-MP98UySsu39THg347Uj%252FRequest%2520Demo.png%3Falt%3Dmedia%26token%3D5e74019b-bf40-497c-af7e-50b69124ec23&#x26;width=768&#x26;dpr=4&#x26;quality=100&#x26;sign=f882580c&#x26;sv=1" alt=""><figcaption></figcaption></figure>

**Barchart**

* In Provider field select Barchart.
* Enter connection name and all necessary personal information in the exact field.
* In addition please select your credit card type and click button **Request**

<figure><img src="https://docs.agenatrader.com/~gitbook/image?url=https%3A%2F%2F1347375179-files.gitbook.io%2F%7E%2Ffiles%2Fv0%2Fb%2Fgitbook-legacy-files%2Fo%2Fassets%252F-MKZSsJBtSP9L4sqIe_q%252F-MP94sEHsBtunBqWgdf0%252F-MP98Yh05HFFz1S7EuKe%252FBarchart%2520%282%29.png%3Falt%3Dmedia%26token%3D642efae6-fdcd-46bf-8986-f7805d37bb8f&#x26;width=768&#x26;dpr=4&#x26;quality=100&#x26;sign=28432a92&#x26;sv=1" alt=""><figcaption></figcaption></figure>

**Taipan**

* In Provider field select Taipan.
* Enter connection name and all necessary personal information in the exact field.
* Click button **Request**

<figure><img src="https://docs.agenatrader.com/~gitbook/image?url=https%3A%2F%2F1347375179-files.gitbook.io%2F%7E%2Ffiles%2Fv0%2Fb%2Fgitbook-legacy-files%2Fo%2Fassets%252F-MKZSsJBtSP9L4sqIe_q%252F-MP94sEHsBtunBqWgdf0%252F-MP98lO79JAdhzKr8cvZ%252FTaipan.png%3Falt%3Dmedia%26token%3Dd7adc757-801f-4378-9d36-27602249f45a&#x26;width=768&#x26;dpr=4&#x26;quality=100&#x26;sign=aeeb9e7f&#x26;sv=1" alt=""><figcaption></figcaption></figure>

## Multi Account Einstellungen <a href="#multi_account_einstellungen" id="multi_account_einstellungen"></a>

AgenaTrader unterstützt einen Multi-Broker-Zugang als auch einen Multi-Datenfeed-Zugang. Es ist also möglich, mehrere Konten bei unterschiedlichen Brokern zu handeln als auch Datenfeeds von unterschiedlichen Anbietern gleichzeitig zu verwenden.

Mit dem Konto-Verbindungs-Popup können die Datenfeed- und Brokeranbindungen definiert werden.

<figure><img src="https://docs.agenatrader.com/~gitbook/image?url=https%3A%2F%2F1347375179-files.gitbook.io%2F%7E%2Ffiles%2Fv0%2Fb%2Fgitbook-legacy-files%2Fo%2Fassets%252F-MKZSsJBtSP9L4sqIe_q%252F-MP94sEHsBtunBqWgdf0%252F-MP961SlxWFQ6zUtAoyv%252Faccount%2520settings.png%3Falt%3Dmedia%26token%3D0364be6c-9efc-43cc-9708-d5304b27d72c&#x26;width=768&#x26;dpr=4&#x26;quality=100&#x26;sign=1aef7fb2&#x26;sv=1" alt=""><figcaption></figcaption></figure>

Um Inkonsistenzen zu vermeiden, muss man AgenaTrader von allen Brokern und Datenfeed-Anbietern trennen, bevor man Änderungen vornehmen kann.

<figure><img src="https://docs.agenatrader.com/~gitbook/image?url=https%3A%2F%2F1347375179-files.gitbook.io%2F%7E%2Ffiles%2Fv0%2Fb%2Fgitbook-legacy-files%2Fo%2Fassets%252F-MKZSsJBtSP9L4sqIe_q%252F-MP94sEHsBtunBqWgdf0%252F-MP96fePNisZ--4yX15C%252Faccount%2520settings%2520arrows.png%3Falt%3Dmedia%26token%3Df8d5c634-f149-46ea-b3ce-d7fb9c9027a5&#x26;width=768&#x26;dpr=4&#x26;quality=100&#x26;sign=b4ac1f3f&#x26;sv=1" alt=""><figcaption></figcaption></figure>

Über **Haupt -> Verbindungen -> Verbinden** kann man sich zu den Datenfeed-Anbietern und Broker verbinden.

<figure><img src="https://docs.agenatrader.com/~gitbook/image?url=https%3A%2F%2F1347375179-files.gitbook.io%2F%7E%2Ffiles%2Fv0%2Fb%2Fgitbook-legacy-files%2Fo%2Fassets%252F-MKZSsJBtSP9L4sqIe_q%252F-MP94sEHsBtunBqWgdf0%252F-MP96jhyd_l6fCKMTFRT%252FConnect.png%3Falt%3Dmedia%26token%3D8aa1db7b-b070-40fa-8ca5-31641c19aa86&#x26;width=768&#x26;dpr=4&#x26;quality=100&#x26;sign=926e4991&#x26;sv=1" alt=""><figcaption></figcaption></figure>

Über **Haupt -> Verbindungen -> Verbindung lösen** werden die Verbindungen wieder getrennt.

<figure><img src="https://docs.agenatrader.com/~gitbook/image?url=https%3A%2F%2F1347375179-files.gitbook.io%2F%7E%2Ffiles%2Fv0%2Fb%2Fgitbook-legacy-files%2Fo%2Fassets%252F-MKZSsJBtSP9L4sqIe_q%252F-MP94sEHsBtunBqWgdf0%252F-MP96n0RM7XAixXJWmbJ%252FDisconnect.png%3Falt%3Dmedia%26token%3Dd9917c05-10fb-4e71-993e-666b6ee382a7&#x26;width=768&#x26;dpr=4&#x26;quality=100&#x26;sign=18ca9b9a&#x26;sv=1" alt=""><figcaption></figcaption></figure>

Über **Haupt -> Verbindungen -> Stop History Loading** können Sie von Ihrem eben geraden aktivierten Broker/Datenfeed das Laden der Historie abbrechen.

<figure><img src="https://docs.agenatrader.com/~gitbook/image?url=https%3A%2F%2F1347375179-files.gitbook.io%2F%7E%2Ffiles%2Fv0%2Fb%2Fgitbook-legacy-files%2Fo%2Fassets%252F-MKZSsJBtSP9L4sqIe_q%252F-MP94sEHsBtunBqWgdf0%252F-MP96qKcIaIgpUM2SDXq%252FStopHistory.png%3Falt%3Dmedia%26token%3Dfdf09eb2-81e2-4be4-95d6-ba92fd332608&#x26;width=768&#x26;dpr=4&#x26;quality=100&#x26;sign=45c7f4b&#x26;sv=1" alt=""><figcaption></figcaption></figure>

Sollen beim Start von AgenaTrader jene Verbindungen wieder aufgenommen werden, welche beim Schließen bestanden haben,

1. Wählen Sie aus dem Hauptmenu **Tools - Allgemeine Einstellungen** aus
2. Danach öffnet sich ein Popup. Klicken Sie auf die Optionen **Auto-Start Daten-Feed** and **Auto-Start Broker** in den Tabs **Generell -> Allgemein**.

### Reiter: Verbindungen <a href="#reiter-_verbindungen" id="reiter-_verbindungen"></a>

Im Verbindungs-Tab sind die Broker und Datenfeed-Anbieter gelistet, deren Verbindungen zuvor eingerichtet worden sind.

*Dabei ist zwischen ausschließlichen und kombinierten Datenfeed-Anbietern zu unterscheiden.*

Broker wie Interactive Brokers oder MB Trading können beispielsweise auch in der Rolle eines Datenfeed-Anbieters sein. TeleTrader und Barchart sind demgegenüber ausschließlich Datenfeed-Anbieter.

<figure><img src="https://docs.agenatrader.com/~gitbook/image?url=https%3A%2F%2F1347375179-files.gitbook.io%2F%7E%2Ffiles%2Fv0%2Fb%2Fgitbook-legacy-files%2Fo%2Fassets%252F-MKZSsJBtSP9L4sqIe_q%252F-MP94sEHsBtunBqWgdf0%252F-MP96uH9yT-5egZo0o4K%252Faccount%2520settings%2520%281%29.png%3Falt%3Dmedia%26token%3D738bf11b-f642-4e93-849e-073d426e8326&#x26;width=768&#x26;dpr=4&#x26;quality=100&#x26;sign=c7a502d4&#x26;sv=1" alt=""><figcaption></figcaption></figure>

| Spalte   | Bedeutung                                                                     |
| -------- | ----------------------------------------------------------------------------- |
| Anbieter | Der Name des Brokers bzw. des Datenfeed-Anbieters                             |
| Feed     | Hier können die zur Verfügung stehenden Datenfeed-Anbieter ausgewählt werden. |
| Broker   | Hierbei handelt es sich um die Broker, zu denen man die Orders routen möchte. |

### Reiter: Datenfeeds <a href="#reiter-_datenfeeds" id="reiter-_datenfeeds"></a>

Im Datenfeeds-Tab kann definiert werden, welchen Datenfeed-Anbieter man für die diversen Asset-Klassen verwenden möchte. Es ist eine Mehrfach-Selektion pro Datenfeed möglich.

Bzgl. dem Backup-Datenfeed kann genau einer ausgewählt werden, welcher mit **All** vorinitialisiert ist. Diese Vorinitialisierung kann nicht geändert werden. Bekommt man nun von einem Haupt-Datenfeed keine Daten mehr, so wird der Backup-Datenfeed herangezogen.

**Beispiel 1.**

<figure><img src="https://docs.agenatrader.com/~gitbook/image?url=https%3A%2F%2F1347375179-files.gitbook.io%2F%7E%2Ffiles%2Fv0%2Fb%2Fgitbook-legacy-files%2Fo%2Fassets%252F-MKZSsJBtSP9L4sqIe_q%252F-MP94sEHsBtunBqWgdf0%252F-MP96ydOJVHjFSE2zxzY%252FCQG.png%3Falt%3Dmedia%26token%3D2e7f8047-a1c2-4252-8c6a-c0bb84234ae4&#x26;width=768&#x26;dpr=4&#x26;quality=100&#x26;sign=ad0756da&#x26;sv=1" alt=""><figcaption></figcaption></figure>

*Beschreibung:* Alle Kurse werden von Dukascopy bezogen.

**Beispiel 2.**

<figure><img src="https://docs.agenatrader.com/~gitbook/image?url=https%3A%2F%2F1347375179-files.gitbook.io%2F%7E%2Ffiles%2Fv0%2Fb%2Fgitbook-legacy-files%2Fo%2Fassets%252F-MKZSsJBtSP9L4sqIe_q%252F-MP94sEHsBtunBqWgdf0%252F-MP972uDzuGdjF7Chtdt%252FFXCM.png%3Falt%3Dmedia%26token%3Ddcc7a523-4d0d-468e-bd5e-4b8a3c0c840a&#x26;width=768&#x26;dpr=4&#x26;quality=100&#x26;sign=f2ed17f9&#x26;sv=1" alt=""><figcaption></figcaption></figure>

*Beschreibung:*

* Currency-Kurse von FXCM
* Stock-Kurse werden von TaiPan verwendet und
* Futures-Kurse bezieht man von Teletrader

**Beispiel 3.**

<figure><img src="https://docs.agenatrader.com/~gitbook/image?url=https%3A%2F%2F1347375179-files.gitbook.io%2F%7E%2Ffiles%2Fv0%2Fb%2Fgitbook-legacy-files%2Fo%2Fassets%252F-MKZSsJBtSP9L4sqIe_q%252F-MP94sEHsBtunBqWgdf0%252F-MP979h34BY3bEwCpq27%252FBarchart.png%3Falt%3Dmedia%26token%3D4ebb59d5-30d5-4ce9-9998-d14e01202e94&#x26;width=768&#x26;dpr=4&#x26;quality=100&#x26;sign=8a4e6991&#x26;sv=1" alt=""><figcaption></figcaption></figure>

*Beschreibung:*

* Alle Kursdaten, die von der Börse in Frankfurt geliefert werden, werden von BarChart bezogen (tba)
* Stock-Kurse aus Nyse werden von Dukascopy geliefert
* Futures-Kurse aus Chicago Board of Trade (CBOT) werden von Dukascopy geliefert.

**Hinweis:** Als erste Priorität gilt nun der Markt/Börse Als zweiter Priorität gilt nun der InstrumentTyp

### Reiter: Konten <a href="#reiter-_konten" id="reiter-_konten"></a>

Im Konten-Tab kann definiert werden, welchen Broker man für die diversen Asset-Klassen verwenden möchte. Es ist eine Mehrfach-Selektion pro Broker möglich.

**Beispiel 1.**

<figure><img src="https://docs.agenatrader.com/~gitbook/image?url=https%3A%2F%2F1347375179-files.gitbook.io%2F%7E%2Ffiles%2Fv0%2Fb%2Fgitbook-legacy-files%2Fo%2Fassets%252F-MKZSsJBtSP9L4sqIe_q%252F-MP94sEHsBtunBqWgdf0%252F-MP97He8Fiy-lTHx0rP1%252FAccounts.png%3Falt%3Dmedia%26token%3Dd728255f-9cd0-4ed5-b725-878ba38e295b&#x26;width=768&#x26;dpr=4&#x26;quality=100&#x26;sign=10efc1ce&#x26;sv=1" alt=""><figcaption></figcaption></figure>

*Bedeutung:*

* Alle Trades werden auf das Konto 423611 von DukasCopy reroutet
* Currency-Trades werden zu FXCM geroutet.
* Futures- und CFD-Trades werden zu IB geroutet und
* Stock-Trades werden zu XTB geroutet

**Beispiel 2.**

<figure><img src="https://docs.agenatrader.com/~gitbook/image?url=https%3A%2F%2F1347375179-files.gitbook.io%2F%7E%2Ffiles%2Fv0%2Fb%2Fgitbook-legacy-files%2Fo%2Fassets%252F-MKZSsJBtSP9L4sqIe_q%252F-MP94sEHsBtunBqWgdf0%252F-MP97L0oRqNEooCH0ISK%252FAccounts2.png%3Falt%3Dmedia%26token%3D3151deba-992f-4bc7-ac76-7f20b6c57107&#x26;width=768&#x26;dpr=4&#x26;quality=100&#x26;sign=ed074eaa&#x26;sv=1" alt=""><figcaption></figcaption></figure>

*Bedeutung:*

* Futures-Trades über IB werden an die Börsen Euronext und Paris geroutet.
* Stock-Trades werden über XTB an Nasdaq geroutet.

**Zu mehreren CFD-Brokern gleichzeitig verbinden**

Eine Beschreibung, wie Sie zu mehreren CFD-Brokern gleichzeitig verbinden können, finden Sie in unseren [FAQs](https://docs.agenatrader.com/v/german/~/changes/OSCbxUs5SNZxGeFH88XF/faqs/frequently-asked-questions-top-10-faqs-1/mit-mehreren-cdf-brokern-gleichzeitig-verbinden).

### Mit mehreren CDF-Brokern gleichzeitig verbinden

**Problemstellung:**

Sie möchten zu zwei oder mehreren Brokern gleichzeitig verbinden, erhalten dann jedoch immer eine Fehlermeldung wie diese:

![](https://docs.agenatrader.com/~gitbook/image?url=https%3A%2F%2F1347375179-files.gitbook.io%2F%7E%2Ffiles%2Fv0%2Fb%2Fgitbook-legacy-files%2Fo%2Fassets%252F-MKZSsJBtSP9L4sqIe_q%252F-MPF2GKRtXhoOgYaA79S%252F-MPF41uw_ZKcrcsLyDFy%252FErrorMultiBroker.png%3Falt%3Dmedia%26token%3Df9c048ba-2bec-4550-97d2-1281ffeb7700\&width=768\&dpr=4\&quality=100\&sign=12e86aa3\&sv=1)

**Lösungsmöglichkeit:**

Wir haben für den InstrumentEditor virtuelle CFD-Börsen ("CFD1" - "CFD10") implementiert. Sie können daher ab sofort manuell jeweils Broker-spezifische CFDs einer dieser "Börsen" zuweisen.

Dafür müssen Sie zuvor in den Kontoverbindungs-Einstellungen im Reiter "Konten" bei den jeweiligen Brokern bei Instrument-Typen "Markets only" auswählen und anschließend je eine unterschiedliche virtuelle Börse zuordnen. Nun können Sie zu mehreren CFD-Brokern gleichzeitig verbinden.

![](https://docs.agenatrader.com/~gitbook/image?url=https%3A%2F%2F1347375179-files.gitbook.io%2F%7E%2Ffiles%2Fv0%2Fb%2Fgitbook-legacy-files%2Fo%2Fassets%252F-MKZSsJBtSP9L4sqIe_q%252F-MPF2GKRtXhoOgYaA79S%252F-MPF44scUdoMYp9DTTr8%252FVirtualExchanges2.png%3Falt%3Dmedia%26token%3D76d441b6-a4c0-441a-87d3-a96054f7f0e0\&width=768\&dpr=4\&quality=100\&sign=56d07066\&sv=1)

## Welche Orderverknüpfungen unterstützt mein Broker

**Übersicht Orderverknüpfungen**

Sie haben im AgenaTrader die Möglichkeit, komplexe Orderkonstrukte abzubilden.

Ihnen stehen dafür die Orderverknüpfungen "IfDone", "OCO" (one cancels other) und "ORO" (one reduces other) zur Verfügung. IfDone wird erstellt mit "ALT" und Klicks auf die erste und die zweite Order. OCO wird erstellt mit "STRG" und Klicks auf die erste und zweite Order. ORO wird erstellt mit "STRG"+"ALT" und Klicks auf die erste und zweite Order. Hier finden Sie die detaillierte Erklärung mit Workflow zu den einzelnen [Orderverknüpfungen](https://docs.agenatrader.com/v/german/menue-erklaerungen-and-inhalt/hauptmenue/chart-menu/chart-trading#orderverknuepfungen).

**Unterstützte versus lokal simulierte Verknüpfungen**

{% hint style="info" %}
**Achtung!**

IfDone und ORO werden ausschließlich lokal im AgenaTrader simuliert, die Software muss daher laufen und mit dem Broker verbunden sein, damit die jeweils verknüpfte zweite Order an den Broker gesandt wird! OCO-Verknüpfungen werden von einigen Brokern unterstützt - die entsprechenden Informationen dazu finden Sie in der Online-Hilfe beim [jeweiligen Broker](https://docs.agenatrader.com/v/german/general/broker). Einschränkend ist jedoch zu berücksichtigen, dass dies nur für SingleTarget-Orders gilt. Orderverknüpfungen in einem MultiTarget-Setting sind ORO-Verknüpfungen und werden daher nur lokal simuliert. Dies wird Ihnen als Meldung im Protokoll folgendermaßen angezeigt:
{% endhint %}

<figure><img src="https://docs.agenatrader.com/~gitbook/image?url=https%3A%2F%2F1347375179-files.gitbook.io%2F%7E%2Ffiles%2Fv0%2Fb%2Fgitbook-legacy-files%2Fo%2Fassets%252F-MKZSsJBtSP9L4sqIe_q%252F-MPF2GKRtXhoOgYaA79S%252F-MPF4YU6l_IpVZQ2WrF2%252FMultiTargetOCO.png%3Falt%3Dmedia%26token%3Deed0a689-a462-4310-9243-c9535d55d0f4&#x26;width=768&#x26;dpr=4&#x26;quality=100&#x26;sign=5c691908&#x26;sv=1" alt=""><figcaption></figcaption></figure>

Sie finden die Information, ob Ihr Broker OCO unterstützt, hier in der Online-Hilfe auf der Seite des [jeweiligen Brokers](https://agenatrader.com/wiki/tiki-index.php?page=Broker%20\(de\)) sowie im Essential Informations-Fenster, das sich öffnet und dessen Inhalt Sie zur Kenntnis nehmen und bestätigen müssen, wenn Sie eine neue Broker-Verbindung anlegen:

<figure><img src="https://docs.agenatrader.com/~gitbook/image?url=https%3A%2F%2F1347375179-files.gitbook.io%2F%7E%2Ffiles%2Fv0%2Fb%2Fgitbook-legacy-files%2Fo%2Fassets%252F-MKZSsJBtSP9L4sqIe_q%252F-MPF2GKRtXhoOgYaA79S%252F-MPF4aihUgyWZznR04pv%252FDisclaimerOrderConnections.png%3Falt%3Dmedia%26token%3D604c2a85-25e3-400a-9046-e9ebf2b4e7ae&#x26;width=768&#x26;dpr=4&#x26;quality=100&#x26;sign=3dc4cc46&#x26;sv=1" alt=""><figcaption></figcaption></figure>

## Verbindungsprobleme

#### Verbindung richtig herstellen zu Broker oder Datenfeed <a href="#verbindung_richtig_herstellen_zu_broker_oder_datenfeed" id="verbindung_richtig_herstellen_zu_broker_oder_datenfeed"></a>

Hin und wieder kann es zu Problemen mit der Verbindung zu Broker oder Datenfeed kommen. In den meisten Fällen liegt es daran, dass die Verbindung zum Broker und Datenfeed nicht richtig hergestellt wurde.

Es empfiehlt sich zu überprüfen, ob man beim betreffenden Anbieter das entsprechende Service abonniert bzw. ein Konto eröffnet hat. Hier sind - je nach Anbieter - oft einige wichtige Hinweise zu beachten (z.B. Aktivieren bestimmter Funktionen in der TWS, synchronisierte Einstellungen der Ports uvm.) All diese Hinweise finden Sie in den Connection Guides, die wir Ihnen online zur Verfügung stellen.

#### Connection Guides für Broker und Datenfeed <a href="#connection_guides_f_r_broker_und_datenfeed" id="connection_guides_f_r_broker_und_datenfeed"></a>

Die Connection Guides sind Verbindungsanleitungen, welche Schritt für Schritt helfen, einen gewünschten Datenfeedanbieter oder Broker an den AgenaTrader anzuschließen. Die Anbindung ist erforderlich, damit AgenaTrader Marktdaten erhalten kann und ermöglichen außerdem den Handel mit dem Broker.

Über unsere [Website](https://agenatrader.com/de/) finden Sie über die Navigation "Partner" die Auswahl der Broker und Datenfeeds. Es wird Ihnen eine Auflistung aller unserer Partner angezeigt. Wählen Sie den gewünschten Broker oder Datenfeed aus und lesen die jeweilige Beschreibung.

Unsere Partner finden Sie hier auf unserer Website: [Broker](https://agenatrader.com/de/broker/) [Datenfeed](https://agenatrader.com/de/marktdaten-echtzeit/)

Youtube-Videos: [Connection Guides](https://www.youtube.com/user/AgenaTraderDE/playlists?sort=dd\&shelf_id=4\&view=50)

Zusätzlich zu den Dokumenten stellen wir wissenswerte Informationen zu vielen unserer Partner zu Verfügung, welche in der [Online Hilfe](https://docs.agenatrader.com/v/german) zu finden sind.


# Simulationskonto

Mit der Eröffnung eines Simulationskontos erhalten Einsteiger die ausgezeichnete Möglichkeit, die Besonderheiten des Handels an der Börse zu untersuchen, die Funktionalitäten von AgenaTrader kennenzulernen sowie eigene Handelsstrategien zu entwickeln.

*Vorteile unseres Simulationskontos sind:*

1. Das Simulationskonto ist ein internes Konto, mit welchem ohne Brokeranbindung unlimitiert gehandelt werden kann.
2. Es simuliert ein Brokerkonto und schafft damit reale Bedingungen für den Test.

Simulationskonto: [Anfordern](https://agenatrader.com/connection-lost-popup/)

[YouTube Video Guide "Simulationskonto öffnen"](https://www.youtube.com/watch?v=ympY4RYNsyo\&index=3\&list=PLLftyBhQjHrVx1_2e0dA5NDNAvtojaRKF)

**Kommissionen im Simulationskonto einstellen**

Um das Trading mit dem internen Simulationskonto im AgenaTrader so realitätsgetreu wie möglich zu gestalten, können Sie für jede Instrumentengruppe Kommissionen einstellen, die jedem Ihrer Simulations-Trades verrechnet werden. Über die Verbindungseinstellungen können Sie Ihr Simulationskonto editieren:

<figure><img src="https://docs.agenatrader.com/~gitbook/image?url=https%3A%2F%2F1347375179-files.gitbook.io%2F%7E%2Ffiles%2Fv0%2Fb%2Fgitbook-legacy-files%2Fo%2Fassets%252F-MKZSsJBtSP9L4sqIe_q%252F-MP8fsMF4q1UaIfWtFf4%252F-MP8wZfJDov_zQLs-qBe%252FSimulationskonto_edit.png%3Falt%3Dmedia%26token%3D736ba67b-f156-441f-86ea-0a81587136b7&#x26;width=768&#x26;dpr=4&#x26;quality=100&#x26;sign=2f56f4ec&#x26;sv=1" alt=""><figcaption></figcaption></figure>

Im folgenden Fenster sehen Sie die Kommissionseinstellungen. Unter **Amount/Unit** können Sie einstellen, welche Kommissionen je gehandelter Unit (Aktie, Future, CFD, Currency-Pair) verrechnet werden sollen. Die Einstellungen sind in absoluten Zahlen und in der Währung eingestellt, die Sie für Ihr Simulationskonto gesetzt haben.

<figure><img src="https://docs.agenatrader.com/~gitbook/image?url=https%3A%2F%2F1347375179-files.gitbook.io%2F%7E%2Ffiles%2Fv0%2Fb%2Fgitbook-legacy-files%2Fo%2Fassets%252F-MKZSsJBtSP9L4sqIe_q%252F-MP8fsMF4q1UaIfWtFf4%252F-MP8wi3fj0Ry9w20plUn%252FSimulationskonto_comision.png%3Falt%3Dmedia%26token%3D97045c2d-c827-4ef5-b829-451005e09001&#x26;width=768&#x26;dpr=4&#x26;quality=100&#x26;sign=3fedc9e5&#x26;sv=1" alt=""><figcaption></figcaption></figure>

**Beispiel:**

<figure><img src="https://docs.agenatrader.com/~gitbook/image?url=https%3A%2F%2F1347375179-files.gitbook.io%2F%7E%2Ffiles%2Fv0%2Fb%2Fgitbook-legacy-files%2Fo%2Fassets%252F-MKZSsJBtSP9L4sqIe_q%252F-MP8fsMF4q1UaIfWtFf4%252F-MP8wl63f6gy10vNkmA7%252FSimulationskonto_comision_example.png%3Falt%3Dmedia%26token%3D08efa01b-671f-47da-873b-70d1211f50d3&#x26;width=768&#x26;dpr=4&#x26;quality=100&#x26;sign=8b028734&#x26;sv=1" alt=""><figcaption></figcaption></figure>

Als Beispiel haben wir folgende möglichst realitätsnahen Einstellungen gewählt:

* Für Stocks/ETF: 1,00 USD je gehandelter Aktie/ETF, Mindestgebühr = 5,00USD
* Für Futures: 2,50 USD je gehandeltem Future, Mindestgebühr = 10,00 USD
* Für Currencies: keine Gebühren, da die meisten Forex-Broker nur den Spread verrechnen
* Für CFDs: 1,00 USD j gehandeltem CFD, keine Mindestgebühren

{% hint style="info" %}
**Wichtig!** Das Simulationskonto kann einen negativen Wert haben, was bedeutet, dass beim Trading mit dem Simulationskonto der Cash Value des Kontos überschritten wurde
{% endhint %}


# Datenfeed

In diesem Abschnitt erhalten Sie eine Übersicht über alle **Datenfeeds**, die von **AgenaTrader** unterstützt werden.

Ein **Datenfeed** ist ein **zentrales Element** Ihrer Handelsumgebung, da er **Echtzeit-Marktdaten, historische Daten und Kursnotierungen** liefert. Diese Informationen ermöglichen Ihnen eine **präzise Marktanalyse, fundierte Handelsentscheidungen und eine effiziente Orderausführung**.

AgenaTrader unterstützt eine Vielzahl an **Datenfeed-Anbietern**, um eine **breite Kompatibilität für unterschiedliche Handelsanforderungen** sicherzustellen. Egal, ob Sie **Aktien, Forex, Futures oder andere Instrumente** handeln – ein zuverlässiger Datenfeed ist unerlässlich für:

* **Präzise Chartdarstellung**
* **Backtesting von Strategien**
* **Automatisierte Handelsausführung**

Durch die Unterstützung einer Vielzahl von **Datenfeed-Anbietern** bietet AgenaTrader Ihnen die Flexibilität, den **Datenfeed zu wählen, der am besten zu Ihrem Handelsstil, Ihrer Marktfokussierung und Ihrem Budget** passt.

🔍 **Entdecken Sie in diesem Abschnitt die vollständige Liste der unterstützten Datenfeeds und finden Sie den Anbieter, der Ihre Handelsanforderungen optimal erfüllt.**

## BarChart <a href="#barchart" id="barchart"></a>

### **Kurzer Überblick von BarChart**

BarChart ist ein bekannter Anbieter von Stammdaten in Echtzeit. Seit der Einführung des neuen Systems BarChart on Demand, das ohne Rücksicht auf das Betriebssystem auf höchstem Niveau arbeiten kann, hat der Broker eine der besten Datenbanken. Sie enthält Börsenkurse, die direkt von mehr als 70 Börsen aus aller Welt empfangen werden.

Sie können ein Echtkonto oder Demokonto von BarChart über unsere [Website](https://agenatrader.com/de/marktdaten-echtzeit/) eröffnen.

### **Verbindung**

Bitte folgen Sie den Anweisungen in folgendem Video, um die Verbindung korrekt einzurichten:

{% embed url="<https://youtu.be/pEMMCJSNOYM>" %}

### **Wissenswertes**

**Kumulative Indizes**

Wird im Indikatorenfenster nur angezeigt, wenn Sie mit einem der folgenden Datenfeeds verbunden sind: Taipan, Barchart, IQFeed. Sie zeigen einen Oszillator von kumulierten Daten des spezifischen Index an.

ACHTUNG! Um die kumualtiven Indizes im Indikatorfenster verfügbar zu haben, müssen Sie "All" oder "Index" für Ihren jeweiligen Datenfeed im Datafeed-Tab in den Verbindungseinstellungen auswählen.

<figure><img src="https://docs.agenatrader.com/~gitbook/image?url=https%3A%2F%2F1347375179-files.gitbook.io%2F%7E%2Ffiles%2Fv0%2Fb%2Fgitbook-legacy-files%2Fo%2Fassets%252F-MKZSsJBtSP9L4sqIe_q%252F-MP8yteuC3mgXQpPpdTN%252F-MP8z4PisAPEOBWjN8ib%252FCumulative%2520indices.png%3Falt%3Dmedia%26token%3Ddcf44612-2e00-414c-8b14-3c4f30274fa7&#x26;width=768&#x26;dpr=4&#x26;quality=100&#x26;sign=8af81a0c&#x26;sv=1" alt=""><figcaption></figcaption></figure>

## IQFeed <a href="#iqfeed" id="iqfeed"></a>

## **Kurzer Überblick von IQFeed**

IQFeed ist einer der führenden Datenfeed-Anbieter am internationalen Finanzmarkt, in Bezug auf Datenlieferung in Realzeit. Einer der größten Vorteile von IQFeed ist die Übertragung von Stammdaten sowie Preise als Ticks. Das ermöglicht dem Trader, die kleinste Bewegungen am Chart zu sehen.

Sie können ein Echtkonto oder Demokonto von IQFeed über unsere [Website](https://agenatrader.com/de/marktdaten-echtzeit/) eröffnen.

## **Verbindung**

Bitte folgen Sie den Anweisungen in folgendem Video, um die Verbindung korrekt einzurichten:

{% embed url="<https://www.youtube.com/watch?v=xhcWndBrdFY>" %}

### **Wissenswertes**

*Futures Handling IQ-Feed*

Für IQFeed stellen wir jetzt die Möglichkeit zu Verfügung, über den InstrumentEditor den gewünschten Contract im Chart auszugeben.

1. Wählen Sie den **Instrument-Edito**r im Menüpunkt **Tools**.
2. Hinweis für bestehende User: Um diese Funktion benutzen zu können, ist ein erneutes Einlesen/Mapping der Instrumente im **Instrument Editor** bzw. in **Tools „Instrumente: Märkte & Mappings“** durchzuführen.
3. Solange Sie ein Demo-Konto von IQ nutzen, ist die verfügbare Historie limitiert. Erst mit einem Live-Konto bekommen Sie zugriff auf die gesamte Historie.

### **Zusätzliche Optionen**

Bei IQFeed kann zwischen FrontMonth-, Continuous- and Backadjusted Contract gewechselt werden:

FrontMonth FM = Nur der aktuelle Kontrakt laut Kalender Continuous CC = Fortlaufender Kontrakt, hier werden die Historien über den FrontMonth hinaus dargestellt, jedoch sind die Gaps zwischen den Kontrakten ersichtlich Back Adjusted BA = Continuous Contract, jedoch ohne Gaps zwischen den unterschiedlichen Kontrakten

Historische Daten im Minutenchart sind für mehrere Jahre zurückliegend erhältlich. Dennoch erhalten Sie Tickdaten während der Handelszeiten nur bis 8 Tage zurückliegend und außerhalb der Handelszeiten bis 180 Tage zurückliegend.

<figure><img src="https://docs.agenatrader.com/~gitbook/image?url=https%3A%2F%2F1347375179-files.gitbook.io%2F%7E%2Ffiles%2Fv0%2Fb%2Fgitbook-legacy-files%2Fo%2Fassets%252F-MKZSsJBtSP9L4sqIe_q%252F-MP8yteuC3mgXQpPpdTN%252F-MP8zECtPhBKsc2oLU3O%252FContract%2520IQ-Feed.png%3Falt%3Dmedia%26token%3D9d094056-a065-4784-86b1-f02fd6bfc071&#x26;width=768&#x26;dpr=4&#x26;quality=100&#x26;sign=d87164f9&#x26;sv=1" alt=""><figcaption></figcaption></figure>

"Für IQ-Feed „Continuous“- oder „Back adjusted“-Kontrakte ist es nicht möglich, mehr als EIN Instrument mit dem gleichen Instrument-Type/-Mapping zu haben.

**Beispiel:** Sie können sich den FDAXSept17 & FDAXDec17 nicht gleichzeitig ansehen. Falls Sie 2 Instrumente mit dem gleichen Mapping haben, bekommen Sie im Protokoll-Tab eine Fehler-Nachricht, um welche Werte es sich handelt. Der Grund dafür ist, dass IQ-Feed die Historien immer am FrontMonth-Contract hängen hat, welcher automatisch einen Tag vor dem Roll-Over auf den Folge-FrontMonth umgestellt wird. Bei dieser Einstellung handelt es sich um die Default-Einstellung.

### **Kumulative Indizes**

Wird im Indikatorenfenster nur angezeigt, wenn Sie mit einem der folgenden Datenfeeds verbunden sind: Taipan, Barchart, IQFeed. Sie zeigen einen Oszillator von kumulierten Daten des spezifischen Index an.

ACHTUNG! Um die kumualtiven Indizes im Indikatorfenster verfügbar zu haben, müssen Sie "All" oder "Index" für Ihren jeweiligen Datenfeed im Datafeed-Tab in den Verbindungseinstellungen auswählen.

<figure><img src="https://docs.agenatrader.com/~gitbook/image?url=https%3A%2F%2F1347375179-files.gitbook.io%2F%7E%2Ffiles%2Fv0%2Fb%2Fgitbook-legacy-files%2Fo%2Fassets%252F-MKZSsJBtSP9L4sqIe_q%252F-MP8yteuC3mgXQpPpdTN%252F-MP9-Usex3JJ0KkYNCSQ%252FCumulative%2520indices%2520%281%29.png%3Falt%3Dmedia%26token%3D0e0579a3-f6d2-40d2-a172-a1e44793afd2&#x26;width=768&#x26;dpr=4&#x26;quality=100&#x26;sign=6f83c7bc&#x26;sv=1" alt=""><figcaption></figcaption></figure>

## Lenz und Partner <a href="#datenfeed__lenz_und_partner__de" id="datenfeed__lenz_und_partner__de"></a>

### **TaiPan Übersicht** <a href="#taipan" id="taipan"></a>

Eine top gepflegte Datenbank ist als zuverlässige Grundlage für Anlageentscheidungen unverzichtbar. Die Lenz+Partner AG ist Teil der vwd group, einem der größten Anbieter von Kapitalmarktinformationen in Europa und hat 25 Jahre Erfahrung in der Entwicklung von Börsensoftware und darauf abgestimmten Datenservices.

Sie können ein Echtkonto oder Demokonto von Lenz + Partner über die [Website](https://agenatrader.com/de/marktdaten-echtzeit/) eröffnen.

### **Verbindung**

Bitte folgen Sie den Anweisungen in folgendem Video, um die Verbindung korrekt einzurichten:

{% embed url="<https://www.youtube.com/watch?v=QksaiHbCcHE>" %}

### **Wichtig: reconnect, restart, reload**

Grundsätzlich empfehlen wir einen täglichen Reconnect/Restart des Realtime Client, da bei andauernder, ununterbrochener Verwendung nicht gewährleistet ist, dass die Taipan Realtime Plattform den vollen Datenumfang liefern kann. Ein regelmäßiger - täglicher - Reconnect, Neustart und neu Laden sowie - hin und wieder - das Leeren der History schaffen hier Abhilfe:

Bitte gehen Sie dafür über den Allgemeine Einstellungen / Verzeichnisse in Ihr Datenverzeichnis und löschen dort im Ordner "History" die Taipan-History. Schließen Sie dann den AgenaTrader und starten ihn neu - dann werden alle Taipan-Historien ganz neu und aktualisiert geladen.

Beachten Sie bitte, dass es in den Verbindungssettings von Taipan vier Auswahlkästchen gibt:

**FrontMonth** = Nur der aktuelle Kontrakt laut Kalender **Continuous Contract** = Fortlaufender Kontrakt **AutoStart TaiPan Realtime:** Ermöglicht den Start von Taipan Realtime, wenn der User eine Verbindung über AgenaTrader herstellt. **Close Taipan Realtime on Disconnect:** Taipan Realtime wird automatisch geschlossen, wenn die Verbindung im AgenaTrader getrennt wird.

**Zusätzliche Optionen**

**Begriffserklärungen zu den Kontrakten:** Continuous CC = Fortlaufender Kontrakt FrontMonth FM = Nur der aktuelle Kontrakt laut Kalender Wie im [Connection Guide zu Taipan](https://youtu.be/QksaiHbCcHE?list=PLLftyBhQjHrXaoAyy3_S6SBhd_CqXXMjd\&t=66) beschrieben, lässt sich hier bereits in der Kontoverbindung auswählen ob "CC oder FM". Je nachdem was dort gewählt wurde, gilt im Weiteren als Standard. Unabhängig davon, welchen Kontrakt Sie in den Verbindungs-Einstellungen haben, der AgenaTrader verwendet die Einstellungen vom InstrumentEditor für das gewählte Instrument.

<figure><img src="https://docs.agenatrader.com/~gitbook/image?url=https%3A%2F%2F1347375179-files.gitbook.io%2F%7E%2Ffiles%2Fv0%2Fb%2Fgitbook-legacy-files%2Fo%2Fassets%252F-MKZSsJBtSP9L4sqIe_q%252F-MP8yteuC3mgXQpPpdTN%252F-MP9-ZjUqNa89yOLO3uu%252FContracts%2520Taipan.png%3Falt%3Dmedia%26token%3De332c5cd-0a03-4f42-a18f-58775b2a30c1&#x26;width=768&#x26;dpr=4&#x26;quality=100&#x26;sign=7738dd5d&#x26;sv=1" alt=""><figcaption></figcaption></figure>

**Kumulative Indizes**

Wird im Indikatorenfenster nur angezeigt, wenn Sie mit einem der folgenden Datenfeeds verbunden sind: Taipan, Barchart, IQFeed. Sie zeigen einen Oszillator von kumulierten Daten des spezifischen Index an.

ACHTUNG! Um die kumualtiven Indizes im Indikatorfenster verfügbar zu haben, müssen Sie "All" oder "Index" für Ihren jeweiligen Datenfeed im Datafeed-Tab in den Verbindungseinstellungen auswählen.

<figure><img src="https://docs.agenatrader.com/~gitbook/image?url=https%3A%2F%2F1347375179-files.gitbook.io%2F%7E%2Ffiles%2Fv0%2Fb%2Fgitbook-legacy-files%2Fo%2Fassets%252F-MKZSsJBtSP9L4sqIe_q%252F-MP8yteuC3mgXQpPpdTN%252F-MP9-eNb7jIR7OZFP4Fl%252FCumulative%2520indices%2520%282%29.png%3Falt%3Dmedia%26token%3D29be7cfa-184a-4850-8a72-34ccf4dfb996&#x26;width=768&#x26;dpr=4&#x26;quality=100&#x26;sign=c4100575&#x26;sv=1" alt=""><figcaption></figcaption></figure>

### **TaiPan.Net** <a href="#taipan.net" id="taipan.net"></a>

Dank der neuen TaiPan.Net Verbindung ist es nicht mehr nötig, TaiPan Realtime zu installieren und lokal im Hintergrund zu betreiben. Es wird eine direkte Verbindung zu der TaiPan-API hergestellt.

Um die neue Verbindung zu aktivieren, folgen Sie dieser Anleitung:

1. Gehen Sie zu **Haupt** -> **Verbindungen** -> **Neues Konto hinzufügen** -> **Hinzufügen**
2. Unter **Anbieter** wählen Sie TaiPan.Net und weisen Sie einen beliebigen Verbindungsnamen hinzu
3. Klicken Sie auf **Weiter**
4. Geben Sie Ihre Anmeldedaten ein
5. Wählen Sie, wie Sie Ihre Terminkontrakte angezeigt bekommen möchten (**Continuous** oder **Front Month**).
6. Klicken Sie auf **Fertig**
7. Wählen Sie aus der Liste, welche Instrumentenlisten Sie brauchen
8. Klicken Sie auf **Instrumentenlisten importieren**

<figure><img src="https://docs.agenatrader.com/~gitbook/image?url=https%3A%2F%2F1347375179-files.gitbook.io%2F%7E%2Ffiles%2Fv0%2Fb%2Fgitbook-legacy-files%2Fo%2Fassets%252F-MKZSsJBtSP9L4sqIe_q%252F-MSDcoExRhyqlbO_Y_-T%252F-MSDj9yxuIn6cJFtNNNM%252FTaiPan.Net%2520connection.png%3Falt%3Dmedia%26token%3Da423eee7-b77e-4720-aeee-92d91d88868b&#x26;width=768&#x26;dpr=4&#x26;quality=100&#x26;sign=72d1987c&#x26;sv=1" alt=""><figcaption></figcaption></figure>

TaiPan.net liefert Optionsdaten für DAX30, was von der "alten" TaiPan COM Verbindung nicht unterstützt wird.

<figure><img src="https://docs.agenatrader.com/~gitbook/image?url=https%3A%2F%2F1347375179-files.gitbook.io%2F%7E%2Ffiles%2Fv0%2Fb%2Fgitbook-legacy-files%2Fo%2Fassets%252F-MKZSsJBtSP9L4sqIe_q%252F-MP8yteuC3mgXQpPpdTN%252F-MP9-re7--6R-wPZD84b%252FTaiPan.Net%2520options.png%3Falt%3Dmedia%26token%3Dc52e93a3-4e04-46c3-aee5-72e0954e8ba0&#x26;width=768&#x26;dpr=4&#x26;quality=100&#x26;sign=4059e501&#x26;sv=1" alt=""><figcaption></figcaption></figure>

## Bloomberg <a href="#bloomberg" id="bloomberg"></a>

### Kurzer Überblick über Bloomberg

Ein konsolidierter Feed von 35 Millionen Instrumenten bietet anspruchsvolle, standardisierte Daten, die die Analyse und Entscheidungen vom Front-Office bis zum Betrieb vereinfachen.

Load / Costs / Limitations / Supported instrument types etc. TBD

### Einrichtung der Bloomberg SAPI <a href="#preparing-bloomberg-sapi" id="preparing-bloomberg-sapi"></a>

Vorbereitung des Bloomberg SAPI Eine Instanz der Bloomberg Server API (SAPI) ist erforderlich. Sie kann mit Hilfe von Bloomberg-Support installiert werden, aber folgendes sollte vorher vorbereitet werden:

1. Installieren Sie AgenaTrader 2.11..6 oder neuer und führen Sie es mit einer gültigen Lizenz aus
2. Registrieren Sie sich als Bloomberg-Kunde und installieren Sie das Bloomberg-Terminal
3. Bereiten Sie einen Server vor::
   * Es kann entweder ein lokaler PC mit:
     * Microsoft Windows (bevorzugt Microsoft Windows Server 2012 oder neuer)
     * Solaris- oder Linux-Server-Distribution sein
   * Oder ein Remote-Server (VPS/VDS)

Wenn Sie das oben Genannte vorbereitet haben, nehmen Sie Kontakt mit dem Bloomberg-Support auf und bitten sie darum, Ihre SAPI-Instanz zu aktivieren.

### Vor der Verbindung

Bevor wir fortfahren, stellen Sie sicher, dass der zuvor aktivierte SAPI-Dienst (Service und Prozess) ordnungsgemäß läuft.

1. Drücken Sie die Tasten Windows + R auf Ihrer Tastatur, um das Ausführen-Fenster zu öffnen.
2. Geben Sie services.msc ein und drücken Sie Enter auf Ihrer Tastatur oder klicken/schnippen sie auf OK.
3. Das Fenster "Dienste" ist jetzt geöffnet.
4. Suchen sie den "Bloomberg ServerApi-Dienst" und doppelklicken sie darauf.
5. Stellen SIe sicher dass der Dienststatus "ausgeführt" anzeigt.

Eigenschaft des Diensts "Bloomberg ServerApi"

<figure><img src="https://docs.agenatrader.com/~gitbook/image?url=https%3A%2F%2F2805764894-files.gitbook.io%2F%7E%2Ffiles%2Fv0%2Fb%2Fgitbook-x-prod.appspot.com%2Fo%2Fspaces%252F-MKZSsJBtSP9L4sqIe_q-887967055%252Fuploads%252FauaoZDhx1RzuRbqa4IYO%252Fimage.png%3Falt%3Dmedia%26token%3D765d2b87-5137-4c6d-a2c8-27347b0b06d3&#x26;width=768&#x26;dpr=4&#x26;quality=100&#x26;sign=5edbb705&#x26;sv=1" alt=""><figcaption></figcaption></figure>

Stellen wir nun sicher, dass die Windows-Firewall Ihre Verbindung nicht blockiert. Wenn Sie eine Firewall eines Drittanbieters verwenden, wenden Sie sich bitte bei auftretenden Problemen an den entsprechenden Support.

1. Drücken Sie die Windows- und R-Tasten auf Ihrer Tastatur, um das Ausführen-Fenster zu öffnen.
2. Geben Sie wf.msc ein und drücken Sie die Eingabetaste auf Ihrer Tastatur oder klicken Sie auf die Schaltfläche OK.
3. Klicken Sie links auf "Eingehende Regeln"
4. Bitte klicken Sie mit der linken Maustaste auf Bloomberg Server-API, um es zu markieren.
5. Klicken Sie rechts auf "Neue Regel..."
6. Im "Assistent für neue eingehende Regel" wählen Sie "Port":

Hinzufügen einer Firewall-Regel zu Bloomberg SAPI

<figure><img src="https://docs.agenatrader.com/~gitbook/image?url=https%3A%2F%2F2805764894-files.gitbook.io%2F%7E%2Ffiles%2Fv0%2Fb%2Fgitbook-x-prod.appspot.com%2Fo%2Fspaces%252F-MKZSsJBtSP9L4sqIe_q-887967055%252Fuploads%252Fxs2dhPMWYHadK73JpVJc%252Fimage.png%3Falt%3Dmedia%26token%3D17210c06-c50d-4118-b985-4adb51827436&#x26;width=768&#x26;dpr=4&#x26;quality=100&#x26;sign=ec5a0816&#x26;sv=1" alt=""><figcaption></figcaption></figure>

1. Klicken Sie auf Weiter
2. Wählen Sie TCP aus der Liste und geben Sie den folgenden spezifischen Port ein: 8294

   Eintreten in den SAPI

   <figure><img src="https://docs.agenatrader.com/~gitbook/image?url=https%3A%2F%2F2805764894-files.gitbook.io%2F%7E%2Ffiles%2Fv0%2Fb%2Fgitbook-x-prod.appspot.com%2Fo%2Fspaces%252F-MKZSsJBtSP9L4sqIe_q-887967055%252Fuploads%252FLoK95lpkBs9uh7Sv4wu6%252Fimage.png%3Falt%3Dmedia%26token%3D849afc92-ccfd-4a75-b1b8-c2f086d7e250&#x26;width=768&#x26;dpr=4&#x26;quality=100&#x26;sign=ccd1ec64&#x26;sv=1" alt=""><figcaption></figcaption></figure>
3. Klicken Sie auf Weiter und lassen Sie "Verbindung zulassen" angekreuzt.

   Erlauben Sie die Verbindung

   <figure><img src="https://docs.agenatrader.com/~gitbook/image?url=https%3A%2F%2F2805764894-files.gitbook.io%2F%7E%2Ffiles%2Fv0%2Fb%2Fgitbook-x-prod.appspot.com%2Fo%2Fspaces%252F-MKZSsJBtSP9L4sqIe_q-887967055%252Fuploads%252FUQFk2D9rMYKmjA8D9y65%252Fimage.png%3Falt%3Dmedia%26token%3Db6d354aa-142e-470b-9fb4-99675a551ccf&#x26;width=768&#x26;dpr=4&#x26;quality=100&#x26;sign=f7570132&#x26;sv=1" alt=""><figcaption></figcaption></figure>
4. Klicken Sie auf Weiter und lassen Sie alle Kontrollkästchen aktiviert.

   Wählen Sie aus, auf welche Profile die Regel angewendet werden soll

   <figure><img src="https://docs.agenatrader.com/~gitbook/image?url=https%3A%2F%2F2805764894-files.gitbook.io%2F%7E%2Ffiles%2Fv0%2Fb%2Fgitbook-x-prod.appspot.com%2Fo%2Fspaces%252F-MKZSsJBtSP9L4sqIe_q-887967055%252Fuploads%252FWkylcJp4MPlo2No4FAah%252Fimage.png%3Falt%3Dmedia%26token%3Dadd2ce47-773f-4f31-b127-57b18938454a&#x26;width=768&#x26;dpr=4&#x26;quality=100&#x26;sign=d0d59f9b&#x26;sv=1" alt=""><figcaption></figcaption></figure>
5. Der letzte Schritt besteht darin, die hinzugefügte Regel zu benennen und zu beschreiben. So haben wir sie beschrieben: Name: Bloomberg Server API\
   Beschreibung: Eingehende Verbindungen zu Bloomberg SAPI am Port 8294 erlauben

   Benenne und beschreibe die Regel

   <figure><img src="https://docs.agenatrader.com/~gitbook/image?url=https%3A%2F%2F2805764894-files.gitbook.io%2F%7E%2Ffiles%2Fv0%2Fb%2Fgitbook-x-prod.appspot.com%2Fo%2Fspaces%252F-MKZSsJBtSP9L4sqIe_q-887967055%252Fuploads%252F8srUagvzlkHeUSQ1dxwR%252Fimage.png%3Falt%3Dmedia%26token%3Dce45f5df-496c-4963-ba86-41849e480488&#x26;width=768&#x26;dpr=4&#x26;quality=100&#x26;sign=6b3378e5&#x26;sv=1" alt=""><figcaption></figcaption></figure>

Verbinden

1. Kontaktieren Sie unseren Support, damit wir den Bloomberg-Connector für Ihre Lizenz aktivieren können.
2. Nachdem Sie eine Bestätigung erhalten haben, starten Sie Ihren AgenaTrader neu.
3. Klicken Sie in AgenaTrader auf Haupt -> Verbindungen -> Neuen Account hinzufügen.
4. Im Fenster zur Kontoeinrichtung klicken Sie auf Hinzufügen. Fügen Sie die Verbindung hinzu.

   <figure><img src="https://docs.agenatrader.com/~gitbook/image?url=https%3A%2F%2F2805764894-files.gitbook.io%2F%7E%2Ffiles%2Fv0%2Fb%2Fgitbook-x-prod.appspot.com%2Fo%2Fspaces%252F-MKZSsJBtSP9L4sqIe_q-887967055%252Fuploads%252FG2Cr3rSxXaKtHjck1CiJ%252Fimage.png%3Falt%3Dmedia%26token%3Dfaf42ee0-38cc-4e9e-b9d4-2e75647b7631&#x26;width=768&#x26;dpr=4&#x26;quality=100&#x26;sign=ed083d62&#x26;sv=1" alt=""><figcaption></figcaption></figure>
5. Wählen Sie Bloomberg als Anbieter und benennen Sie die Verbindung

   <figure><img src="https://docs.agenatrader.com/~gitbook/image?url=https%3A%2F%2F2805764894-files.gitbook.io%2F%7E%2Ffiles%2Fv0%2Fb%2Fgitbook-x-prod.appspot.com%2Fo%2Fspaces%252F-MKZSsJBtSP9L4sqIe_q-887967055%252Fuploads%252F2kn2GvDg8tmBu3NEATJ4%252Fimage.png%3Falt%3Dmedia%26token%3Ddd466882-b939-4028-b79e-dee891b2e142&#x26;width=768&#x26;dpr=4&#x26;quality=100&#x26;sign=b335adda&#x26;sv=1" alt=""><figcaption></figcaption></figure>
6. **Bloomberg BLPAPI-Protokollebene:** Wählen Sie aus, welche Art von Protokollen gesammelt werden soll:**Installationsort des Bloomberg Terminals (optional):** Verwenden Sie diese Option nur, wenn AgenaTrader den Installationspfad Ihres Bloomberg Terminals nicht finden kann.**Hostname oder IP-Adresse der „Bloomberg SAPI“:** Geben Sie den Hostnamen oder die IP-Adresse Ihres SAPI-Servers ein **Port der „Bloomberg SAPI“:** Geben Sie den Port Ihres SAPI-Servers einVerbindungsdetailsNachdem Sie auf Weiter geklickt haben, erscheint das folgende Fenster:

   1. Off (default): no BLPAPI logs
   2. Error: BLPAPI errors
   3. Warning: BLPAPI warnings
   4. Info: BLPAPI info request
   5. Verbose: All BLPAPI requests

      <figure><img src="https://docs.agenatrader.com/~gitbook/image?url=https%3A%2F%2F2805764894-files.gitbook.io%2F%7E%2Ffiles%2Fv0%2Fb%2Fgitbook-x-prod.appspot.com%2Fo%2Fspaces%252F-MKZSsJBtSP9L4sqIe_q-887967055%252Fuploads%252FIJrbWEhvmjLdo1fq4ma0%252Fimage.png%3Falt%3Dmedia%26token%3Da55ee384-9704-4a77-a9d8-3c92e3c3e103&#x26;width=768&#x26;dpr=4&#x26;quality=100&#x26;sign=c03152b4&#x26;sv=1" alt=""><figcaption></figcaption></figure>

   What BLPAPI Logs to collect

   **Response Logging:** Wenn aktiviert, protokolliert AgenaTrader API

   **Request Logging:** Wenn aktiviert, protokolliert AgenaTrader die API

Sowohl die Haupt-BLPAPI- als auch die Anforderungs-/Antwortdateien werden in Ihrem **AgenaTrader Data Directory -> Logs folder.**&#x20;

**Auto start “Bloomberg Terminal“ on connect:** Wenn aktiviert, startet Agenatrader automatisch Bloomberg Terminal während des Verbindungsprozesses.

**Login Name (optional, not used for BLPAPI):** Bitte geben Sie Ihre Bloomberg-Terminal-Anmeldung ein. Nur erforderlich, wenn "Automatischer Start „Bloomberg Terminal“ bei Verbindung" aktiviert wurde.

**Password (optional, not used for BLPAPI):** Bitte geben Sie Ihr Bloomberg-Terminal-Passwort ein. Nur erforderlich, wenn "Automatisches Starten des Bloomberg Terminals bei Verbindung" aktiviert ist.

**Auto close “Bloomberg Terminal“ on disconnect:** Wenn aktiviert, schließt Agenatrader das Bloomberg Terminal während des Trennungsprozesses automatisch.

<figure><img src="https://docs.agenatrader.com/~gitbook/image?url=https%3A%2F%2F2805764894-files.gitbook.io%2F%7E%2Ffiles%2Fv0%2Fb%2Fgitbook-x-prod.appspot.com%2Fo%2Fspaces%252F-MKZSsJBtSP9L4sqIe_q-887967055%252Fuploads%252FAX4W8wOli62JSr8pVaY0%252Fimage.png%3Falt%3Dmedia%26token%3D5f0de3fc-bf61-4d65-b88c-969cc2ded06d&#x26;width=768&#x26;dpr=4&#x26;quality=100&#x26;sign=e46c5494&#x26;sv=1" alt=""><figcaption></figcaption></figure>

Klicken Sie auf die **Fertig stellen** Schaltfläche, um den Verbindungseinrichtungsprozess abzuschließen.

## FAQ

### Fehlende Marktdaten <a href="#fehlende_marktdaten" id="fehlende_marktdaten"></a>

Manchmal kann es auch vorkommen, dass die Charts im AgenaTrader nicht ticken oder keine Marktdaten anzeigen (Historien und aktuelle Kurse) oder aber die Daten werden erst nach manueller Aktualisierung geladen.

### Habe ich die aktuellste Version? <a href="#habe-ich-die-aktuellste-version" id="habe-ich-die-aktuellste-version"></a>

Stellen Sie sicher, dass Sie den aktuellste AgenaTrader-Release verwenden. Sie sollten stets die aktuellste Version installiert haben, da Sie beim Starten des AgenaTrader per Popup auf das Update aufmerksam gemacht werden und dieses dann auch gleich durchführen sollten. Sollten Sie aus irgendeinem Grund dennoch mit einer älteren Version arbeiten, für die es bereits ein Update gibt, so erkennen Sie das an dem kleinen grünen Icon neben der Versions-Nummer rechts unten in Ihrem AgenaTrader-Fenster. Mit einem Klick darauf starten Sie den Update-Vorgang. Zudem können Sie von unserer Website unter Plattform / Aktuelle Version stets die jeweils aktuelle Version herunterladen bzw. sogar auf die neueste Beta-Version updaten.

Wichtig: Beta-Versionen befinden sich noch in der Entwicklung befinden - Sie sollten diese also in dem Bewusstsein verwenden, dass Sie ein Produkt verwenden, das noch in der Testphase ist.

### Habe ich den AgenaTrader richtig an Broker und Datenfeed angebunden? <a href="#habe-ich-den-agenatrader-richtig-an-broker-und-datenfeed-angebunden" id="habe-ich-den-agenatrader-richtig-an-broker-und-datenfeed-angebunden"></a>

Unsere [Connection-Guides](https://agenatrader.com/de/agenaspace-online-ausbildung/) helfen Ihnen bei der Herstellung von Verbindungen, Sie finden sie unter anderem in unserem [AgenaSpace](https://agenatrader.com/de/agenaspace-online-ausbildung/). Dazu einfach den gewünschten Partner auswählen (Broker und Datenfeed). Sehen Sie sich diese Kurz-Videos in Ruhe und sehr genau an, denn je nach Anbieter gilt es jeweils gewisse Anweisungen und kleine Setup-Hinweise (wie z.B. synchronisieren von Ports o.ä.) zu befolgen und zu beachten.

### Habe ich die richtigen Kontoeinstellungen? <a href="#habe-ich-die-richtigen-kontoeinstellungen" id="habe-ich-die-richtigen-kontoeinstellungen"></a>

Ihr Datenfeed muss als Datenfeed (DF) selektiert sein und im Reiter Datenfeed muss "all" oder die Instrument-Typen eingestellt werden, die Sie sehen möchten. Überprüfen Sie auch, ob Sie die Daten für das betreffende Instrument bei Ihrem Anbieter abonniert haben.

<figure><img src="https://docs.agenatrader.com/~gitbook/image?url=https%3A%2F%2F1347375179-files.gitbook.io%2F%7E%2Ffiles%2Fv0%2Fb%2Fgitbook-legacy-files%2Fo%2Fassets%252F-MKZSsJBtSP9L4sqIe_q%252F-MPEsNvvtjP2k0b1-L-6%252F-MPEuE2gSXu3j9Dy8_vV%252FKontoverbindungen.png%3Falt%3Dmedia%26token%3D84dba63f-931f-460f-bfe1-0d4379522c34&#x26;width=768&#x26;dpr=4&#x26;quality=100&#x26;sign=32a8cc33&#x26;sv=1" alt=""><figcaption></figcaption></figure>

### Habe ich die InstrumentListen und Mappings importiert? <a href="#habe-ich-die-instrumentlisten-und-mappings-importiert" id="habe-ich-die-instrumentlisten-und-mappings-importiert"></a>

Prüfen Sie unter Tools -> Instrument Editor: Märkte und Mappings, dass alle Mappings der jeweilige Börse zum Datenfeed importiert sind. Das Importieren von Instrument Listen alleine reicht nicht aus. In diesem Wiki Artikel finden Sie eine detaillierte Beschreibung zum Importieren von Mappings und Listen. Wenn Sie im Instrument Editor die gewünschten Märkte suchen, dann sehen Sie unter Provider zum gewünschten Datenfeed ein MappedSymbol:

<figure><img src="https://docs.agenatrader.com/~gitbook/image?url=https%3A%2F%2F1347375179-files.gitbook.io%2F%7E%2Ffiles%2Fv0%2Fb%2Fgitbook-legacy-files%2Fo%2Fassets%252F-MKZSsJBtSP9L4sqIe_q%252F-MPEsNvvtjP2k0b1-L-6%252F-MPEuJ68Cv3qh8o83VBO%252FInstrumentEscort.png%3Falt%3Dmedia%26token%3D04959a58-fa66-4a9c-9124-a2d52de850c0&#x26;width=768&#x26;dpr=4&#x26;quality=100&#x26;sign=287880a5&#x26;sv=1" alt=""><figcaption></figcaption></figure>

### Sind die Handelszeiten korrekt eingestellt? <a href="#sind-die-handelszeiten-korrekt-eingestellt" id="sind-die-handelszeiten-korrekt-eingestellt"></a>

Im InstrumentEditor können Sie überprüfen, ob Sie die Handelszeiten für das betreffende Instrument richtig eingestellt haben. In Allgemeine Einstellungen unter Historie -> MarktplatzEscort können Sie Handelszeiten, Handelspausen und Umkehrzeiten überprüfen. Wir empfehlen dringendst, diese stets auf default-Einstellung zu belassen!

### Habe ich den richtigen Chart-Style gewählt? <a href="#habe-ich-den-richtigen-chart-style-gewahlt" id="habe-ich-den-richtigen-chart-style-gewahlt"></a>

Prüfen Sie in der ChartToolBar (Zeiteinheiten -> Custom Parameter -> Periodizität) bzw. in Chartauswahl (Custom Parameter -> Periodizität) ob hier ein Style eingestellt wurde (z.B.: Heikin Ashi), der für dieses Instrument oder den Datenfeed nicht anwendbar ist.

### Wurden Marktdaten für das Instrument (Symbol) abonniert? <a href="#wurden-marktdaten-fur-das-instrument-symbol-abonniert" id="wurden-marktdaten-fur-das-instrument-symbol-abonniert"></a>

Kontaktieren Sie Ihren Broker oder Datenfeed und erkundigen Sie sich, ob Sie für die Daten der gewünschte Instrumente (Symbole/Märkte)freigeschalten sind. Sollten Sie nur verzögerte Daten erhalten, wird Ihnen ein roter Schriftzug "verzögerte Daten" (delayed data) angezeigt.

### (Nur für Futures) Wurde das richtige Kontraktmonat eingestellt? <a href="#nur-fur-futures-wurde-das-richtige-kontraktmonat-eingestellt" id="nur-fur-futures-wurde-das-richtige-kontraktmonat-eingestellt"></a>

Öffnen Sie im InstrumentEditor das gewünschte Instrument über das Suchfeld links oben und ändern Sie die Zeile Ablauf im Details-Tab entsprechend ab.

Hier finden Sie weitere Informationen zu den [Kontrakten](https://docs.agenatrader.com/v/german/menue-erklaerungen-and-inhalt/tool-menue/instrument-escort/futures-kontrakt-rollover).

<figure><img src="https://docs.agenatrader.com/~gitbook/image?url=https%3A%2F%2F1347375179-files.gitbook.io%2F%7E%2Ffiles%2Fv0%2Fb%2Fgitbook-legacy-files%2Fo%2Fassets%252F-MKZSsJBtSP9L4sqIe_q%252F-MPEsNvvtjP2k0b1-L-6%252F-MPEuZqJxOWgi2pm71Xw%252FAblaufFutures.png%3Falt%3Dmedia%26token%3D5de22620-ddc0-4a6f-a26e-657d291ca9b3&#x26;width=768&#x26;dpr=4&#x26;quality=100&#x26;sign=cb58f490&#x26;sv=1" alt=""><figcaption></figcaption></figure>


# Broker

{% hint style="info" %}
Wenn Sie eine Verbindung zu einem Broker herstellen möchten, der über einen der folgenden **Technologieanbieter** betrieben wird:

* **Gain Futures**
* **Interactive Brokers**
* **Rithmic**
* **MetaTrader 5**

dann navigieren Sie bitte zum Abschnitt [**Technologieanbieter**](/german/main/broker-und-datenfeed/technology-provider) in der Dokumentation. Dort finden Sie **detaillierte Anleitungen** zur Einrichtung und Konfiguration jeder Verbindung, um eine **reibungslos funktionierende Integration mit AgenaTrader** sicherzustellen.
{% endhint %}

## AMP <a href="#amp" id="amp"></a>

### **Kurzer Überblick von AMP**

AMP bietet einen direkten Zugang zu allen wichtigen globalen Börsen und exotischen Märkten. AMP Global Clearing ist ein FCM (Futures Commission Merchant oder Terminbörsenmakler) mit Hauptsitz in Chicago, der Zugang zu den globalen elektronischen Futures-Märkten für einzelne Händler zur Verfügung stellt.

**Unterstützte Assetklassen:** Future

**Order-Verknüpfungen:** OCO Order-Verknüpfungen werden lokal simuliert ORO Order-Verknüpfungen werden lokal simuliert IFDone Order-Verknüpfungen werden lokal simuliert

**OrderAusführung** AgenaTrader führt keine Orders aus, wir bekommen nur Rückmeldungen seitens des Brokers dass eine Order mit einem bestimmten Preis ausgeführt worden ist. Simmen also zu einem Instrument die gelieferten Daten des Datenfeed-Lieferanten nicht mit den Quotes der Brokerplattform überein, kommt es zu einem Verhalten, dass Entry-\&Exit-Preise nicht zum Chartbid passen.

Sie können ein Echtkonto oder Demokonto von AMP über unsere [Webseite](https://agenatrader.com/de/broker/) eröffnen.

### **Verbindung**

Bitte folgen Sie den Anweisungen in folgendem Video um, die Verbindung korrekt einzurichten:

{% embed url="<https://www.youtube.com/watch?v=3dZRtG024cI>" %}

**WICHTIGER HINWEIS:**

DIE PLATTFORM DES BROKERS STELLT IMMER DIE REFERENZPLATTFORM DAR.

Das heißt, dass die auf der BROKER-Plattform an Orders und Geld angezeigten Werte Gültigkeit haben. Lassen Sie immer die Plattform des Brokers als Backup gleichzeitig mit dem AgenaTrader laufen. Dies gibt Ihnen den notwendigen Überblick über das Zusammenspiel zwischen AgenaTrader und Ihrem Broker. Damit Sie immer exakt wissen, wie Ihre Orders/Positionen und im Endeffekt Ihr Kontoguthaben abgebildet werden.

{% hint style="info" %}
*Hinweis! Das funktioniert nicht mit der Desktop-MB-Trading Plattform.*
{% endhint %}

## Dukascopy <a href="#dukascopy" id="dukascopy"></a>

### **Kurzer Überblick von Dukascopy**

Dukascopy gehört zu den ECN (Electronic Communication Network) Brokern. Diese Broker liefern die Möglichkeit, die Orders zum internationalen Tradingdesk zu bewegen und damit die besten Angebote von anderen Brokern in Realzeit zu erhalten. Einer der wichtigsten Vorteile der ECN Broker ist es, dass sie keine Market-Maker sind und daher nicht gegen ihre eigenen Kunden handeln.

**Unterstützte Assetklassen:** Currency, CFD's

**Order-Verknüpfungen:** OCO Order-Verknüpfungen werden lokal simuliert ORO Order-Verknüpfungen werden lokal simuliert IFDone Order-Verknüpfungen werden lokal simuliert

**OrderAusführung** AgenaTrader führt keine Orders aus, wir bekommen nur Rückmeldungen seitens des Brokers dass eine Order mit einem bestimmten Preis ausgeführt worden ist. Simmen also zu einem Instrument die gelieferten Daten des Datenfeed-Lieferanten nicht mit den Quotes der Brokerplattform überein, kommt es zu einem Verhalten, dass Entry-\&Exit-Preise nicht zum Chartbild passen.

Sie können ein Echtkonto oder Demokonto von Dukascopy über die [Website](https://agenatrader.com/de/broker/) eröffnen.

### **Verbindung**

Bitte folgen Sie den Anweisungen in folgendem Video, um die Verbindung korrekt einzurichten:

**Wie Sie eine Verbindung zu Dukascopy herstellen:**

Schritt 1. Das erste Authentifikations-Popup wird während des Verbindungsprozesses zu Dukascopy erscheinen. AgenaTrader braucht dies, um sich mit der jForex API zu verbinden. Hier müssen Sie nun Ihre Zugangsdaten eingeben und die PIN-Code-Checkbox anklicken.

<figure><img src="https://docs.agenatrader.com/~gitbook/image?url=https%3A%2F%2F1347375179-files.gitbook.io%2F%7E%2Ffiles%2Fv0%2Fb%2Fgitbook-legacy-files%2Fo%2Fassets%252F-MKZSsJBtSP9L4sqIe_q%252F-MP90U0cGdmgoHZ4mJOn%252F-MP91M_0ncIVSO28lUWu%252FDC%25201.png%3Falt%3Dmedia%26token%3Dcd6d1f10-dbde-4fdb-999f-06ee01f3e97f&#x26;width=768&#x26;dpr=4&#x26;quality=100&#x26;sign=5860ab7b&#x26;sv=1" alt=""><figcaption></figcaption></figure>

Schritt 2. Nach der Eingabe Ihres PIN-Codes erscheint das zweite Authentifications-Popup. Dieses Popup erstellt eine Verbindung zur Website von Dukascopy her, von der AgenaTrader die historischen Ausführungen erhält. Bitte aktivieren Sie die PIN-Code-Checkbox und geben Sie so wie zuvor Ihren PIN ein und bestätigen dann mit „Submit“.

<figure><img src="https://docs.agenatrader.com/~gitbook/image?url=https%3A%2F%2F1347375179-files.gitbook.io%2F%7E%2Ffiles%2Fv0%2Fb%2Fgitbook-legacy-files%2Fo%2Fassets%252F-MKZSsJBtSP9L4sqIe_q%252F-MP90U0cGdmgoHZ4mJOn%252F-MP91SWH5Kix0lZ-sVsN%252FDC%25202.png%3Falt%3Dmedia%26token%3D56493c01-d431-412c-81e7-aa0a91b3f147&#x26;width=768&#x26;dpr=4&#x26;quality=100&#x26;sign=ca338c2d&#x26;sv=1" alt=""><figcaption></figcaption></figure>

### **Wissenswertes**

Wenn Sie ein DukasCopy Account haben bzw. Sie ein neues Konto anfordern, so achten Sie darauf, dass das Konto vom Typ "NonHedged" ist.

![](https://docs.agenatrader.com/~gitbook/image?url=https%3A%2F%2F2805764894-files.gitbook.io%2F%7E%2Ffiles%2Fv0%2Fb%2Fgitbook-legacy-files%2Fo%2Fassets%252F-MKZSsJBtSP9L4sqIe_q%252F-MPiSv8m6HiRuT_J32LT%252F-MPiUuNH8i_K5aS0eKKv%252FDukascopy.png%3Falt%3Dmedia%26token%3D9368c961-1ea6-458e-a138-b51a81a8fbb9\&width=768\&dpr=4\&quality=100\&sign=9e8c280d\&sv=1)

Nur mit diesen Einstellungen funktioniert AgenaTrader problemlos mit DukasCopy.

Jeder Client, der Agena Trader verwendet, wird auf globalen Modus gesetzt. Der globale Modus ist der Nettopositionsmodus, bei dem jeder neue Handel automatisch in die vorhandene Position des gleichen Instruments verschmolzen wird. CFDs müssen manuell für Kunden hinzugefügt werden, die mit AgenaTrader arbeiten.

Wenn Ihr DukasCopy-Konto noch nicht für CFDs aktiviert wurde, kann der AgenaTrader nur historische Daten aber keine Realtime- oder verzögerte Daten laden.

In einigen Fällen kann es zu Problemen mit dem Dukascopy Autostart oder der automatischen Wiederverbindung kommen.

Es gibt drei Möglichkeiten, das zu lösen: 1. Überprüfen Sie in den Kontoverbindngseinstellungen, ob das Kontrollkästchen "Auto-Start" aktiviert ist. 2. Deaktivieren des Pin (Nur für Live-Konten) 3. Wenn Sie eine statische IP Adresse besitzen (fragen Sie diesbezüglich Ihren Internet-Anbieter), dann kontaktieren Sie bitte das DukasCopy Support-Team, damit diese IP freigeschaltet und der PIN nicht mehr benötigt wird.

**WICHTIGER HINWEIS:**

DIE PLATTFORM DES BROKERS STELLT IMMER DIE REFERENZPLATTFORM DAR.

Das heißt, dass die auf der BROKER-Plattform an Orders und Geld angezeigten Werte Gültigkeit haben. Lassen Sie immer die Plattform des Brokers als Backup gleichzeitig mit dem AgenaTrader laufen. Dies gibt Ihnen den notwendigen Überblick über das Zusammenspiel zwischen AgenaTrader und Ihrem Broker. Damit Sie immer exakt wissen, wie Ihre Orders/Positionen und im Endeffekt Ihr Kontoguthaben abgebildet werden.

{% hint style="info" %}
*Hinweis! Das funktioniert nicht mit der Desktop-MB-Trading Plattform.*
{% endhint %}

## FXCM

### **Kurzer Überblick von FXCM (Forex Capital Markets)**

FXCM is einer den bekanntesten Broker, der Zugang zu dem FOREX Währungsmarkt anbietet. Seit Dezember 2010 ist FXCM an der NYSE notiert. FXCM ermöglicht den Zugang für Preise von Währungen, CFD, Aktienindizes sowie Handelswaren wie Öl, Gold, Silber uvm. Sie können am FOREX Markt 24 Stunden pro Tag handeln (exkl. Wochenende). Das Ziel von FXCM ist es, die fortschrittlichste Technologie zu Verfügung zu stellen, um den besten Support für den Kunden anbieten zu können.

**Unterstützte Assetklassen:** Currency, CFD's

**Order-Verknüpfungen:** OCO Order-Verknüpfungen werden unterstützt ORO Order-Verknüpfungen werden lokal simuliert IFDone Order-Verknüpfungen werden lokal simuliert

**OrderAusführung** AgenaTrader führt keine Orders aus, ir bekommen nur Rückmeldungen seitens des Brokers dass eine Order mit einem bestimmten Preis ausgeführt worden ist. Simmen also zu einem Instrument die gelieferten Daten des Datenfeed-Lieferanten nicht mit den Quotes der Brokerplattform überein, kommt es zu einem Verhalten, dass Entry-\&Exit-Preise nicht zum Chartbid passen.

Sie können ein Echtkonto oder Demokonto von FXCM über unsere [Website](https://agenatrader.com/de/broker/) eröffnen.

### **Verbindung**

Bitte folgen Sie den Anweisungen in folgendem Video, um die Verbindung korrekt einzurichten:

{% embed url="<https://www.youtube.com/watch?v=3dZRtG024cI>" %}

**Wichtig!** Der Benutzer muss die Anmelde-url-Eingabe nicht mehr ausfüllen.

### **Wissenswertes**

FXCM stellt Volumen für historischen Ticks nur für die folgenden Symbole zur Verfügung: EUR/USD, USD/JPY, GBP/USD, EUR/JPY, AUD/USD, GBP/JPY, USD/CAD, AUD/JPY, USD/CHF, EUR/CHF, NZD/USD, EUR/AUD, EUR/GBP und EUR/CAD.

Bitte beachten Sie Folgendes:

1. Wenn Sie ein bestehendes FXCM-Konto haben bzw. Sie ein neues Konto anfordern, so achten Sie darauf, dass das Konto vom Typ **"NonHedged"** ist und
2. Die Begrenzung von 20 parallelen Realtime-Feeds auf 'unbegrenzt' geändert wurde.
3. Bitte stellen Sie sicher, dass in der FXCM Trading Station alle Instrumente aktiviert wurden und aktivieren Sie ggf. fehlende Symbole.Nur mit diesen Einstellungen funktioniert AgenaTrader problemlos mit FXCM!

{% hint style="info" %}
**Important.** AgenaTrader unterschützt keine hedged Konten. Non-hedged Konten werden ausschließlich von der FXCM Trading Station unterstützt.

MT4 unterstützt keine non-hedged Konten. Aktivieren Sie daher den \
MT4 nicht, wenn Sie ein FXCM Konto eröffnen.
{% endhint %}

**FOREX**

Ordergrößen werden in 1.000er Schritten angeboten.

### **Datenfeed - Laden von Historien und Real-Time Daten**

Sollte das Laden von Historien (Charts) zu lange dauern, oder Charts werden nicht geladen und bleiben leer, dann liegt es daran, dass der Server von FXCM ein Timeout zurückgegeben hat. Das bedeutet, dass die Menge an Instrumente und Historien, die angefragt wurden, zu hoch sind. Verringern der Instrumente schafft hier Abhilfe. Verringern Sie auch die länge der Historie über die Chart Einstellungen.

**Minimum tick distance**

AT++ plusplus Einstiege: Lesen Sie dazu [Synthetic-Orders on MinStopDistance](https://docs.agenatrader.com/v/german/~/changes/OSCbxUs5SNZxGeFH88XF/menue-erklaerungen-and-inhalt/tool-menue/konfigurations-escort/at-plus-plus#einstiege). AT++ plusplus stops: Lesen Sie dazu [Synthetic-Orders on MinStopDistance](https://docs.agenatrader.com/v/german/~/changes/OSCbxUs5SNZxGeFH88XF/menue-erklaerungen-and-inhalt/tool-menue/konfigurations-escort/at-plus-plus#stops). Bestellen Größenvergleich

Auftragsgröße in AgenaTrader und FXCM Station unterscheidet sich für einige Arten von Symbolen:

**Achtung!** FXCM's Plattform-Werte-Anzeigen sind immer in accountCurrency (unabhängig von Instrumenten). Unter PnL zeigen wir FXCMs BRUTTO PnL​.

**WICHTIGER HINWEIS**

DIE PLATTFORM DES BROKERS STELLT IMMER DIE REFERENZPLATTFORM DAR.

Das heißt, dass die auf der BROKER-Plattform an Orders und Geld angezeigten Werte Gültigkeit haben. Lassen Sie immer die Plattform des Brokers als Backup gleichzeitig mit dem AgenaTrader laufen. Dies gibt Ihnen den notwendigen Überblick über das Zusammenspiel zwischen AgenaTrader und Ihrem Broker. Damit Sie immer exakt wissen, wie Ihre Orders/Positionen und im Endeffekt Ihr Kontoguthaben abgebildet werden.

{% hint style="info" %}
*Hinweis! Das funktioniert nicht mit der Desktop-MB-Trading Plattform.*
{% endhint %}


# Arbeitsplatz & Oberfläche

Eine Voraussetzung bei der Entwicklung von AgenaTrader war es Ihnen, dem Trader, einen sehr ergonomischen Arbeitsplatz zur Verfügung zu stellen.

Weiters wurde darauf Wert gelegt, dem Anwender ein professionelles Trading von vielen Instrumenten und Positionen auf so wenig Platz wie möglich, zu erlauben. Das Ziel ist, soviel Information wie möglich auf so wenig Raum wie nötig zur Verfügung zu stellen und diese Informationen mit einem Mausklick erreichbar zu machen.

Beispiel eine Arbeitsbereich mit nur einem Bildschirm:

<figure><img src="https://docs.agenatrader.com/~gitbook/image?url=https%3A%2F%2F1347375179-files.gitbook.io%2F%7E%2Ffiles%2Fv0%2Fb%2Fgitbook-legacy-files%2Fo%2Fassets%252F-MKZSsJBtSP9L4sqIe_q%252F-MP94sEHsBtunBqWgdf0%252F-MP9AU5W8EPc2VWyHlgk%252Fworkspace1.png%3Falt%3Dmedia%26token%3D51efa856-b4e7-4db0-aa85-df9371ceb328&#x26;width=768&#x26;dpr=4&#x26;quality=100&#x26;sign=3f3bcf7e&#x26;sv=1" alt=""><figcaption></figcaption></figure>

Wir haben uns von 'frei fliegenden', in der Task-Leiste verschwindenden und nicht bzw. schwer wieder auffindbaren Fenstern gelöst.

Die Lösung dafür ist eine [**DockingTab-Technologie**](https://docs.agenatrader.com/v/german/~/changes/OSCbxUs5SNZxGeFH88XF/arbeitsplatz-und-oberflaeche-einrichten/arbeitsplatz-dockingtabs). Diese Technologie bietet für die unterschiedlichsten Funktionalitäten wie Listen, Charts & Tools eine Darstellung in einem Reiter (Tab), und lässt es zu diese 'Informationscontainer' durch Drag\&Drop sehr flexibel im Arbeitsbereich zu positionieren.

<figure><img src="https://docs.agenatrader.com/~gitbook/image?url=https%3A%2F%2F1347375179-files.gitbook.io%2F%7E%2Ffiles%2Fv0%2Fb%2Fgitbook-legacy-files%2Fo%2Fassets%252F-MKZSsJBtSP9L4sqIe_q%252F-MP94sEHsBtunBqWgdf0%252F-MP9AZGFmj6zWdVXGrpL%252FDocking.jpg%3Falt%3Dmedia%26token%3D3abf5827-98e9-4e1c-82ba-be54296b42ca&#x26;width=768&#x26;dpr=4&#x26;quality=100&#x26;sign=f0ef63e5&#x26;sv=1" alt=""><figcaption></figcaption></figure>

## <img src="/files/kPHNoG61TYuQEZbLIP3L" alt="" data-size="line"> Arbeitsplatz-Menü

In AgenaTrader können beliebig viele Arbeitsplätze verwaltet werden. Durch einen Klick auf die angelegten Arbeitsplätze kann zwischen diesen gewechselt werden.

Starten Sie einfach mit einem der vor gefertigten Arbeitsplätze um ein Gespür zu bekommen, wie man die DockingTab Technologie verwendet.

<figure><img src="https://docs.agenatrader.com/~gitbook/image?url=https%3A%2F%2F1347375179-files.gitbook.io%2F%7E%2Ffiles%2Fv0%2Fb%2Fgitbook-legacy-files%2Fo%2Fassets%252F-MKZSsJBtSP9L4sqIe_q%252F-MPE3XYPZiq_RM5wlkeu%252F-MPE3oo77Xetw79OuPkc%252FWorkspace.png%3Falt%3Dmedia%26token%3D2d639452-daba-4c33-ac36-20ef6b8436d5&#x26;width=768&#x26;dpr=4&#x26;quality=100&#x26;sign=6a5ce5d9&#x26;sv=1" alt=""><figcaption></figcaption></figure>

For each new workspace, you may create or add to existing Category. This is made for more convenient navigation through the workspaces.

<figure><img src="https://docs.agenatrader.com/~gitbook/image?url=https%3A%2F%2F1347375179-files.gitbook.io%2F%7E%2Ffiles%2Fv0%2Fb%2Fgitbook-legacy-files%2Fo%2Fassets%252F-MKZSsJBtSP9L4sqIe_q%252F-MPE3XYPZiq_RM5wlkeu%252F-MPE3ugBaT2TTF6fB6I2%252FCategory.png%3Falt%3Dmedia%26token%3Db21fa2bb-d5d3-4a21-bf53-0d677947308a&#x26;width=768&#x26;dpr=4&#x26;quality=100&#x26;sign=4dc89af0&#x26;sv=1" alt=""><figcaption></figcaption></figure>

| Option          | Bedeutung                                                                                                                                                    |
| --------------- | ------------------------------------------------------------------------------------------------------------------------------------------------------------ |
| Speichern       | Speichert den aktuellen Arbeitsplatz bzw. öffnet ein Fenster zur Auswahl des Namens und des Speicherortes, falls dieser noch nicht gespeichert wurde.        |
| Speichern unter | Gibt die Möglichkeit eine Kopie des Arbeitsplatzes unter einem neuen Namen zu speichern                                                                      |
| Neu             | Öffnet einen leeren Arbeitsplatz                                                                                                                             |
| Entfernen       | Löscht einen Arbeitsplatz                                                                                                                                    |
| Import from URL | Ermöglicht das Importieren eines Arbeitsplatzes über einen angegebenen Link (Link-Provider könnte zum Beispiel ein Trading-Mentor oder das Agena-Team sein). |

Sobald Sie einen Arbeitsplatz gespeichert haben, wird im **Protokoll-Tab** eine Nachricht über die Durchführung ausgegeben.

Der Arbeitsplatz wird standardmäßig im Ordner "Dokumente" im UserVerszeichnis AgenaTrader/Workspaces gespeichert:

<figure><img src="https://docs.agenatrader.com/~gitbook/image?url=https%3A%2F%2F1347375179-files.gitbook.io%2F%7E%2Ffiles%2Fv0%2Fb%2Fgitbook-legacy-files%2Fo%2Fassets%252F-MKZSsJBtSP9L4sqIe_q%252F-MPE3XYPZiq_RM5wlkeu%252F-MPE3xq9cmDkU3KDE57Q%252FWorkspace%2520%281%29.png%3Falt%3Dmedia%26token%3Dacac2bb0-875d-4b00-b935-8a3058ffee8a&#x26;width=768&#x26;dpr=4&#x26;quality=100&#x26;sign=b275aed9&#x26;sv=1" alt=""><figcaption></figcaption></figure>

### DockingTabs <a href="#dockingtabs" id="dockingtabs"></a>

*Die DockingTabs-Technology nimmt an:*

1. Diese Tabs können beliebig am Bildschirm platziert bzw. gruppiert werden. Dadurch können die Reiter auch logisch kategorisiert werden z.B.: alle Positions-/Trades-/Ausführungslisten zu einem Control-Center zusammengefügt werden.
2. Andere Tabs wie Nachrichten/Protokoll/Strategie-Escort usw. können zu einem Info-Center frei zusammengestellt werden.
3. Charts- bzw. Chartcontainer können in Chartingbereiche platziert werden.

<figure><img src="https://docs.agenatrader.com/~gitbook/image?url=https%3A%2F%2F2805764894-files.gitbook.io%2F%7E%2Ffiles%2Fv0%2Fb%2Fgitbook-legacy-files%2Fo%2Fassets%252F-MKZSsJBtSP9L4sqIe_q%252F-MPinJIpmc2clAcUejgw%252F-MPirUcwvidyvygVq2BX%252Fdocking%2520tabs1.png%3Falt%3Dmedia%26token%3D0d0c1002-c033-4d8d-9212-20e207f7a571&#x26;width=768&#x26;dpr=4&#x26;quality=100&#x26;sign=8976ec2f&#x26;sv=1" alt=""><figcaption></figcaption></figure>

#### Detaching a tab when using a multi-display system <a href="#detaching-a-tab-when-using-a-multi-display-system" id="detaching-a-tab-when-using-a-multi-display-system"></a>

1\. A right click on the tab will open the following contextualized menu:

<figure><img src="https://docs.agenatrader.com/~gitbook/image?url=https%3A%2F%2F2805764894-files.gitbook.io%2F%7E%2Ffiles%2Fv0%2Fb%2Fgitbook-legacy-files%2Fo%2Fassets%252F-MKZSsJBtSP9L4sqIe_q%252F-MPinJIpmc2clAcUejgw%252F-MPirUcxN6z0bnwMhsfL%252Fdocking%2520tabs2.png%3Falt%3Dmedia%26token%3D8b797951-b0a2-4fa6-b785-aab5ef128457&#x26;width=768&#x26;dpr=4&#x26;quality=100&#x26;sign=23ffae86&#x26;sv=1" alt=""><figcaption></figcaption></figure>

2\. Select the **Detach** menu item to move the tab to a different display.

<figure><img src="https://docs.agenatrader.com/~gitbook/image?url=https%3A%2F%2F2805764894-files.gitbook.io%2F%7E%2Ffiles%2Fv0%2Fb%2Fgitbook-legacy-files%2Fo%2Fassets%252F-MKZSsJBtSP9L4sqIe_q%252F-MPinJIpmc2clAcUejgw%252F-MPirUctMqHbh-Folifc%252FDocking%2520%281%29.jpg%3Falt%3Dmedia%26token%3D036b9b6a-d3e0-4696-867a-c9f8672c157d&#x26;width=768&#x26;dpr=4&#x26;quality=100&#x26;sign=af34bf8d&#x26;sv=1" alt=""><figcaption></figcaption></figure>

3\. To reattach the tab, right click on it and select the **Attach** option from the context menu.

<figure><img src="https://docs.agenatrader.com/~gitbook/image?url=https%3A%2F%2F2805764894-files.gitbook.io%2F%7E%2Ffiles%2Fv0%2Fb%2Fgitbook-legacy-files%2Fo%2Fassets%252F-MKZSsJBtSP9L4sqIe_q%252F-MPinJIpmc2clAcUejgw%252F-MPirUcyeKwYBrgap-CG%252Fdocking%2520tabs4.png%3Falt%3Dmedia%26token%3D92ac43de-d346-4a2b-99b9-75ba5e788806&#x26;width=768&#x26;dpr=4&#x26;quality=100&#x26;sign=1d63b298&#x26;sv=1" alt=""><figcaption></figcaption></figure>

4\. To add a further tab to a detached tab, right mouse click on the tab to be attached and select the **Attach to** option.

<figure><img src="https://docs.agenatrader.com/~gitbook/image?url=https%3A%2F%2F2805764894-files.gitbook.io%2F%7E%2Ffiles%2Fv0%2Fb%2Fgitbook-legacy-files%2Fo%2Fassets%252F-MKZSsJBtSP9L4sqIe_q%252F-MPinJIpmc2clAcUejgw%252F-MPirUd0bobpVcXy1hbL%252Fdocking%2520tabs5.png%3Falt%3Dmedia%26token%3Daec330ca-76de-40bd-bdf4-bfb3c850ec98&#x26;width=768&#x26;dpr=4&#x26;quality=100&#x26;sign=6f816955&#x26;sv=1" alt=""><figcaption></figcaption></figure>

5\. If you want to move a detached tab back to the main window (or to a different window) use the **Attach to** option in the context menu again. The selected window will display the background color as slightly transparent during this process to clarify the user's choice.

Select the **Rename** option to change the name of an existing tab and the **Close** option to close the tab.

**Potential issues may arise when working with multiple PCs and Dropbox.**

If you save your AgenaTrader data in Dropbox in order to use the same settings on different PCs, then you may face problems involving disappearing windows due to the difference in display settings of your monitors. To avoid this issue, save your AgenaTrader workspace without detached windows. You can detach them once more after loading the configurations.

### Datenfeed-Historien

#### Historien Laden <a href="#historien_laden" id="historien_laden"></a>

Startet man AgenaTrader, so benötigt das System eine gewisse Zeit bis die historischen Daten von den Servern der Datenfeed-Anbieter geladen wurden und die Charts aufgebaut sind. Um zu sehen wie weit AgenaTrader beim Laden der historischen Daten bereits fortgeschritten ist, gibt es rechts unten einen Progress-Bar (Fortschrittsanzeiger). Solange dieser Balken gelb ist kann es vorkommen, dass leere Charts angezeigt werden.

<figure><img src="https://docs.agenatrader.com/~gitbook/image?url=https%3A%2F%2F1347375179-files.gitbook.io%2F%7E%2Ffiles%2Fv0%2Fb%2Fgitbook-legacy-files%2Fo%2Fassets%252F-MKZSsJBtSP9L4sqIe_q%252F-MP94sEHsBtunBqWgdf0%252F-MP9AiXrhHM5AUVCG6rC%252Fbars%2520history.png%3Falt%3Dmedia%26token%3D2247279d-1f18-4881-a5d3-fd6959b4bf52&#x26;width=768&#x26;dpr=4&#x26;quality=100&#x26;sign=201ef3fa&#x26;sv=1" alt=""><figcaption></figcaption></figure>

*Historien werden unter anderem bei folgenden Tools benötigt:*

* Chart
  * [Chart Container: EinzelChart](https://docs.agenatrader.com/v/german/~/changes/OSCbxUs5SNZxGeFH88XF/menue-erklaerungen-and-inhalt/hauptmenue/hauptmenue/einzelchart)
  * [Chart Container: EinzelChart-Gruppe](https://docs.agenatrader.com/v/german/~/changes/OSCbxUs5SNZxGeFH88XF/menue-erklaerungen-and-inhalt/hauptmenue/hauptmenue/einzelchart-gruppe)
  * [Chart Container: ListChart-Gruppe](https://docs.agenatrader.com/v/german/~/changes/OSCbxUs5SNZxGeFH88XF/menue-erklaerungen-and-inhalt/hauptmenue/hauptmenue/listchart-gruppe)(LCG)
  * [Chart Container: TabChart-Gruppe](https://docs.agenatrader.com/v/german/~/changes/OSCbxUs5SNZxGeFH88XF/menue-erklaerungen-and-inhalt/hauptmenue/hauptmenue/tabchart-gruppe)(TCG)
* [Indikatoren im Scanner](https://docs.agenatrader.com/v/german/~/changes/OSCbxUs5SNZxGeFH88XF/menue-erklaerungen-and-inhalt/hauptmenue/realtime-scanner) ("bars required" für das Laden)
* [Indikatoren am Chart](https://docs.agenatrader.com/v/german/~/changes/OSCbxUs5SNZxGeFH88XF/menue-erklaerungen-and-inhalt/hauptmenue/chart-toolbar/indikatoren) ("bars required" für die Berechnung)
* [Strategien im Strategie-Escort](https://docs.agenatrader.com/v/german/~/changes/OSCbxUs5SNZxGeFH88XF/erstellen-sie-ihre-eigene-handelsstrategie/strategie-escort) ("bars required" für das Laden)
* [Strategien am Chart](https://docs.agenatrader.com/v/german/~/changes/OSCbxUs5SNZxGeFH88XF/erstellen-sie-ihre-eigene-handelsstrategie/programmierung/strategie) ("bars required" für die Berechnung)

#### Historien Overflow <a href="#historien_overflow" id="historien_overflow"></a>

Dieses Problem kann grundsätzlich mit allen Datenfeeds bestehen.

IB ermöglicht nämlich innerhalb von 10 Minuten nur 60 historische Abfragen. D.h, wenn man eine ListChartGruppe mit 20 Instrumenten in 3 Zeiteinheiten laufen hat, so hat man die 60 historischen Abfragen bereits erreicht. Wechselt man danach mit einem Chart in eine neue Zeiteinheit, so bleibt dieses Chart leer, weil Interactive-Brokers keine Daten mehr liefert.

Barchart bietet historische Pakete von 100, 200 und 500 an – aber ein 100er Paket ist ebenfalls bald ausgeschöpft.

TeleTrader bietet im 500, 750 und 1000 gleichzeitige historische Requests an. Hier kann man schon ziemlich viele Instrumente in unterschiedlichen Zeiteinheiten gleichzeitig öffnen.

Jeder Datenfeed hat jedoch seine Eigenheiten. Wird bei IB die maximale Anzahl der Historien überschritten, so muss man 10 Minuten warten um neue Historien laden zu können. Bei Barchart wartet man eine ganze Stunde.

<figure><img src="https://docs.agenatrader.com/~gitbook/image?url=https%3A%2F%2F1347375179-files.gitbook.io%2F%7E%2Ffiles%2Fv0%2Fb%2Fgitbook-legacy-files%2Fo%2Fassets%252F-MKZSsJBtSP9L4sqIe_q%252F-MP94sEHsBtunBqWgdf0%252F-MP9Am6U95yTvfgloXDL%252Fhistories2.png%3Falt%3Dmedia%26token%3D9ad67e57-d6e8-48e8-80e3-9a86c4d9833b&#x26;width=768&#x26;dpr=4&#x26;quality=100&#x26;sign=226af4e3&#x26;sv=1" alt=""><figcaption></figcaption></figure>

### Status Indikatoren

Am unteren Ende des AgenaTrader Arbeitsplatzes finden sich die Status Indikatoren.

Diese zeigen System, Internetverkehr (Ping), Cpu-Nutzung und Data Feed (Broker) Verbindungsstatus:

Farben der Indikatoren:

* **Grün:** System und Verbindung sind in Ordnung.
* **Gelb:** Das System gibt eine mittel-kritische Warnung aus. Prüfen Sie das Protokoll auf Meldungen und beheben Sie den Fehler, der ausgegeben wird. Ihre Internetverbindung weist einen höheren Ping auf und Daten (Charts) werden langsamer geladen.
* **Rot:** Es gibt ein kritisches Systemproblem, welches behoben werden muss. Prüfen Sie das Protokoll auf Meldungen und beheben den Fehler der im Protokoll ausgegeben wird. Betreffend der Internetverbindung ist der Ping sehr hoch und Daten (Charts) können nur sehr langsam geladen werden.

<figure><img src="https://docs.agenatrader.com/~gitbook/image?url=https%3A%2F%2F1347375179-files.gitbook.io%2F%7E%2Ffiles%2Fv0%2Fb%2Fgitbook-legacy-files%2Fo%2Fassets%252F-MKZSsJBtSP9L4sqIe_q%252F-MP94sEHsBtunBqWgdf0%252F-MP9Arh7mtzCkojcWzo0%252FStatus_Indicators.png%3Falt%3Dmedia%26token%3Db0b92f24-7f1a-4886-85b1-992a799a558f&#x26;width=768&#x26;dpr=4&#x26;quality=100&#x26;sign=218c28ba&#x26;sv=1" alt=""><figcaption></figcaption></figure>

## Hauptmenü und Toolbar <a href="#hauptmenu-und-toolbar" id="hauptmenu-und-toolbar"></a>

Die grundlegenden Funktionalitäten des AgenaTrader können über die platzsparende Applikations-Toolbar bedient werden. Neben den aufklappbaren Menüs [**Haupt**](https://docs.agenatrader.com/v/german/~/changes/OSCbxUs5SNZxGeFH88XF/menue-erklaerungen-and-inhalt/hauptmenue), [**Tools** ](https://docs.agenatrader.com/v/german/~/changes/OSCbxUs5SNZxGeFH88XF/menue-erklaerungen-and-inhalt/tool-menue), [**Strategien**](https://docs.agenatrader.com/v/german/~/changes/OSCbxUs5SNZxGeFH88XF/arbeitsplatz-und-oberflaeche-einrichten/arbeitsplatz-hauptmenue-und-toolbar) und [**Glattstellen**](https://docs.agenatrader.com/v/german/~/changes/OSCbxUs5SNZxGeFH88XF/arbeitsplatz-und-oberflaeche-einrichten/arbeitsplatz-hauptmenue-und-toolbar#glattstellen) sind die wichtigsten Funktionen über die angeschlossene Symbolleiste erreichbar.

<figure><img src="https://docs.agenatrader.com/~gitbook/image?url=https%3A%2F%2F1347375179-files.gitbook.io%2F%7E%2Ffiles%2Fv0%2Fb%2Fgitbook-legacy-files%2Fo%2Fassets%252F-MKZSsJBtSP9L4sqIe_q%252F-MP94sEHsBtunBqWgdf0%252F-MP9AweuV-t6LOYUHqe1%252FToolbar.png%3Falt%3Dmedia%26token%3D08b32517-afca-4505-b7cf-660df3e05e13&#x26;width=768&#x26;dpr=4&#x26;quality=100&#x26;sign=49ac11ec&#x26;sv=1" alt=""><figcaption></figcaption></figure>

In der oberen linken Ecke des Hauptfensters finden SIe das Suchfeld. Es ermöglicht Ihnen, schnell Informationen in der Online-Hilfe zu finden. Geben Sie einfach den genauen Begriff, wie er in der Plattform verwendet wird, ein und klicken Sie auf Search.

<figure><img src="https://docs.agenatrader.com/~gitbook/image?url=https%3A%2F%2F1347375179-files.gitbook.io%2F%7E%2Ffiles%2Fv0%2Fb%2Fgitbook-legacy-files%2Fo%2Fassets%252F-MKZSsJBtSP9L4sqIe_q%252F-MP94sEHsBtunBqWgdf0%252F-MP9BsFuIouos0cck2KM%252Fsearch.jpg%3Falt%3Dmedia%26token%3D8c9b3ffc-6632-4b30-a34b-cf278c16fde1&#x26;width=768&#x26;dpr=4&#x26;quality=100&#x26;sign=cddc0523&#x26;sv=1" alt=""><figcaption></figcaption></figure>

Der Haupt-Toolbar kann per Drag\&Drop an alle vier Ecken Ihres Bildschirms bewegt werden oder vollständig losgelöst dorthin verschoben werden, wo Sie ihn gerne hätten:

<figure><img src="https://docs.agenatrader.com/~gitbook/image?url=https%3A%2F%2F1347375179-files.gitbook.io%2F%7E%2Ffiles%2Fv0%2Fb%2Fgitbook-legacy-files%2Fo%2Fassets%252F-MKZSsJBtSP9L4sqIe_q%252F-MP94sEHsBtunBqWgdf0%252F-MP9BwdYlVk9KpYyRNBy%252FManu%2520Toolbar.png%3Falt%3Dmedia%26token%3D5fb98e12-c887-47bf-9de7-45a98d6643f1&#x26;width=768&#x26;dpr=4&#x26;quality=100&#x26;sign=dbc295b1&#x26;sv=1" alt=""><figcaption></figcaption></figure>

**Wichtige Hinweis zum losgelösten Toolbar:** Nach einem Neustart des AgenaTrader erscheint der Bar dort, wo Ihr Cursor in dem Moment steht.

Wählen Sie den Menüpunkt **Add/Remove Commands** um auszuwählen, welche Symbole im Toolbar angezeigt werden sollen. Wenn der Toolbar aufgrund der eines verkleinerten Fensters komprimmiert ist, können Sie die verborgenen Symbole anzeigen, indem Sie auf den **Hidden Commands** Button klicken.

<figure><img src="https://docs.agenatrader.com/~gitbook/image?url=https%3A%2F%2F1347375179-files.gitbook.io%2F%7E%2Ffiles%2Fv0%2Fb%2Fgitbook-legacy-files%2Fo%2Fassets%252F-MKZSsJBtSP9L4sqIe_q%252F-MP94sEHsBtunBqWgdf0%252F-MP9C5lPoWE-jlSBh5OJ%252FApplication%2520toolbar2.PNG%3Falt%3Dmedia%26token%3D9c43902c-4c07-4999-b1ba-56444acf2eeb&#x26;width=768&#x26;dpr=4&#x26;quality=100&#x26;sign=7b7b8d11&#x26;sv=1" alt=""><figcaption></figcaption></figure>

## GLATTSTELLEN <a href="#glattstellen" id="glattstellen"></a>

Durch drücken des **Glattstellen**-Button werden ALLE Positionen und Orders gelöscht.

<figure><img src="https://docs.agenatrader.com/~gitbook/image?url=https%3A%2F%2F1347375179-files.gitbook.io%2F%7E%2Ffiles%2Fv0%2Fb%2Fgitbook-legacy-files%2Fo%2Fassets%252F-MKZSsJBtSP9L4sqIe_q%252F-MPdGVdakovIBe-xwvur%252F-MPdICijAg992f5eGBMK%252FFlatten.png%3Falt%3Dmedia%26token%3D94fedff3-f552-47a2-8b5f-8e908b44c523&#x26;width=768&#x26;dpr=4&#x26;quality=100&#x26;sign=3b4648fe&#x26;sv=1" alt=""><figcaption></figcaption></figure>


# Chart-Bereich


# Charting

*AgenaTrader hat ein neuartiges Chart-Container Konzept in dem es möglich ist:*

* [Einzelne Chart](https://docs.agenatrader.com/v/german/~/changes/OSCbxUs5SNZxGeFH88XF/menue-erklaerungen-and-inhalt/hauptmenue/hauptmenue/einzelchart) in einem Tab darzustellen
* Mehrere Charts zum selben Instrument in einem Charting-Bereich zu präsentieren:
  * [EinzelChart-Gruppen](https://docs.agenatrader.com/v/german/~/changes/OSCbxUs5SNZxGeFH88XF/menue-erklaerungen-and-inhalt/hauptmenue/hauptmenue/einzelchart-gruppe)
  * [ListChart-Gruppen](https://docs.agenatrader.com/v/german/~/changes/OSCbxUs5SNZxGeFH88XF/menue-erklaerungen-and-inhalt/hauptmenue/hauptmenue/listchart-gruppe) (LCG)
  * [TabChart-Gruppen](https://docs.agenatrader.com/v/german/~/changes/OSCbxUs5SNZxGeFH88XF/menue-erklaerungen-and-inhalt/hauptmenue/hauptmenue/tabchart-gruppe) (TCG)
  * [Chart Galerie](https://docs.agenatrader.com/v/german/~/changes/OSCbxUs5SNZxGeFH88XF/menue-erklaerungen-and-inhalt/hauptmenue/hauptmenue/chart-galerie)
  * [Dynamic Scanner](https://docs.agenatrader.com/v/german/~/changes/OSCbxUs5SNZxGeFH88XF/menue-erklaerungen-and-inhalt/hauptmenue/hauptmenue/dynamic-scanner)

<figure><img src="/files/PuW9bHdfpNFCP15F4Vwz" alt=""><figcaption></figcaption></figure>

## Chart-Navigation

Die Navigation innerhalb des Charts kann anhand:

* der Chart-Navigation: Maus oder
* der Chart-Navigation: Tastatur erfolgen.

Auf der unteren linken Seite des Diagramms können Sie Statusindikatoren sehen:

![Demo](https://docs.agenatrader.com/~gitbook/image?url=https%3A%2F%2F1347375179-files.gitbook.io%2F%7E%2Ffiles%2Fv0%2Fb%2Fgitbook-legacy-files%2Fo%2Fassets%252F-MKZSsJBtSP9L4sqIe_q%252F-MP9Hk_wuyGSOjwmX_ze%252F-MP9IDIn5vbr3MmlMFG1%252Fdemo.png%3Falt%3Dmedia%26token%3D63f9c887-de44-4356-8f80-b8abd269d449\&width=300\&dpr=4\&quality=100\&sign=c51bd586\&sv=1) Demo Account Broker verbunden

![Real](https://docs.agenatrader.com/~gitbook/image?url=https%3A%2F%2F1347375179-files.gitbook.io%2F%7E%2Ffiles%2Fv0%2Fb%2Fgitbook-legacy-files%2Fo%2Fassets%252F-MKZSsJBtSP9L4sqIe_q%252F-MP9Hk_wuyGSOjwmX_ze%252F-MP9IG0RwaDkY3fsMnfF%252Freal.png%3Falt%3Dmedia%26token%3D820c259b-90b0-4d57-b94d-efccacb45ead\&width=300\&dpr=4\&quality=100\&sign=f98b6d8\&sv=1) Real Account Broker verbunden

![Simulation](https://docs.agenatrader.com/~gitbook/image?url=https%3A%2F%2F1347375179-files.gitbook.io%2F%7E%2Ffiles%2Fv0%2Fb%2Fgitbook-legacy-files%2Fo%2Fassets%252F-MKZSsJBtSP9L4sqIe_q%252F-MP9Hk_wuyGSOjwmX_ze%252F-MP9IJhyfaXYBZ9QctOr%252Fsimulation.png%3Falt%3Dmedia%26token%3Dd026022a-13aa-4414-8224-f859ac1150b8\&width=300\&dpr=4\&quality=100\&sign=4e231d4e\&sv=1) Simulated Account Broker verbunden

![Delayed](https://docs.agenatrader.com/~gitbook/image?url=https%3A%2F%2F1347375179-files.gitbook.io%2F%7E%2Ffiles%2Fv0%2Fb%2Fgitbook-legacy-files%2Fo%2Fassets%252F-MKZSsJBtSP9L4sqIe_q%252F-MP9Hk_wuyGSOjwmX_ze%252F-MP9IMk6XK9Qghbc78ZM%252FDelayed.png%3Falt%3Dmedia%26token%3D9c2ca9bf-4009-4932-b5e3-9a3ba5c9d6ff\&width=300\&dpr=4\&quality=100\&sign=33363462\&sv=1) Delayed Data Datafeed verbunden. (Sofern ein Datenfeed verzögerte Daten liefert. z.B. typische Verzögerungen sind: 10-20min)

![Realtime](https://docs.agenatrader.com/~gitbook/image?url=https%3A%2F%2F1347375179-files.gitbook.io%2F%7E%2Ffiles%2Fv0%2Fb%2Fgitbook-legacy-files%2Fo%2Fassets%252F-MKZSsJBtSP9L4sqIe_q%252F-MP9Hk_wuyGSOjwmX_ze%252F-MP9IPTioApUa6KDr0IY%252Frealtime.png%3Falt%3Dmedia%26token%3D3a53c925-72e2-42aa-81a2-3ec0a659e261\&width=300\&dpr=4\&quality=100\&sign=2d602f3f\&sv=1) Realtime Data Datafeed verbunden

![](/files/szdjFZXM0Yyp1waHEoli) account

### Maus <a href="#chart-navigation-_maus" id="chart-navigation-_maus"></a>

Dieses Kapitel umfasst die Maus-Funktionalitäten bei der Anwendung der AgenaTrader-Plattform.

**Doppelklick auf Indikator oder Zeichenobjekt**

Mit einem Doppelklick auf einen Indikator, ein Indikatorpanel bzw. ein Zeichenobjekt, öffnet sich der jeweilige ParameterDialog. Wird z.B. ein Indikator doppelgeklickt, so wird dieser in der Indikator-Liste im Dialog automatisch ausgewählt.

<figure><img src="/files/PDDXwlvbe83pQME8t0aQ" alt=""><figcaption></figcaption></figure>

**Klick in den Charting-Bereich**

Ein Klick in den Chart-Bereich mit der linken Maus-Taste öffnet die Daten-Box.

<figure><img src="/files/jreqpsygA6ormgmY5HI5" alt=""><figcaption></figcaption></figure>

In der Daten-Box findet man alle wichtigen Informationen zur Preisperiode (z.B. Kerze) in dessen Bereich sich der Mauszeiger gerade befindet:

* Date\&Zeit
* Eröffnungskurs
* Hoch
* Tief
* Schlusskurs
* Volumen
* bzw. die Werte der sich am Chart befindlichen Indikatoren.

**Zeit-Skala**

Die horizontale Zeit-Skala beinhaltet je nach ausgewählter Zeiteinheit die Zeitmarken des Charts. In Intraday-Charts sieht man den Tagesumbruch als Datum+Zeit, alle anderen Zeitmarken werden im HH:MM bzw. HH:MM:SS Format dargestellt.

Ist der CrossHair-Pointer aktiviert, so wird das aktuelle Datum/Zeit in einem gefärbten Bereich hervorgehoben.

<figure><img src="/files/8YeRIX5i1XPMwuebGDrO" alt=""><figcaption></figcaption></figure>

Mit gedrückter **linker Maustaste** in der Zeit-Skala kann der Chart nach links/rechts verschoben werden. Mit gedrückter **rechter Maustaste** in der Zeit-Skala kann der Chart horizontal gezoomt werden.

Das ein Chart nicht in seiner Ursprungsposition ist bzw. ein Teil des Charts verschoben und/oder verdeckt ist, erkennt man am Vorhandensein eines Pfeils rechts oben im Chart.

<figure><img src="/files/tBGkSeIBGVxXjFyvU80b" alt=""><figcaption></figcaption></figure>

Mit einem Doppelklick auf die Zeitlinie bzw. einem Einfachklick auf den Pfeil, wird der verstellte Chart wieder in seine Originalposition gebracht.

**Preis-Skala**

Die vertikale Preis-Skala beinhaltet im Chart-Panel die unterschiedlichen Preise bzw. die Preis-Marken verschiedenster Chart-Objekte wie:

* Aktueller Preis
* Indikatorenwerte
* Werte von Horizontalen Linien u.A.

<figure><img src="/files/W2KY8gDvWL0EPoAGcGzd" alt=""><figcaption></figcaption></figure>

Mit gedrückter **linker Maustaste** in der Preis-Skala kann der Chart nach oben/unten verschoben werden. Mit gedrückter **rechter Maustaste** in der Preis-Skala kann der Chart vertikal gezoomt werden.

Wurde das Chart verstellt, so kann es mit einem Klick auf einen der Pins [![Pin](https://docs.agenatrader.com/~gitbook/image?url=https%3A%2F%2Fagenatrader.com%2Fwiki%2Ftiki-download_file.php%3FfileId%3D117%26display\&width=300\&dpr=4\&quality=100\&sign=b121e430\&sv=1) ](https://agenatrader.com/wiki/tiki-download_file.php?fileId=117\&display)wieder in die Ursprungsposition gebracht werden. Ein Doppelklick in die Preisskala richtet das Chart ebenfalls wieder korrekt aus.

<figure><img src="/files/qfiwKLdYydLzihfY8Od6" alt=""><figcaption></figcaption></figure>

**Autoskalierung nach Veränderung des Charts**

Sind die Pins im Chart sichtbar, so bedeutet dies, dass der Autoscale-Modus für den Chart deaktiviert ist (der Chart richtet sich nicht mehr automatisch aus). Sind die Kerzen nun nach oben bzw. nach unten aus dem Chart geschoben worden und tickt der Chart, so färbt sich das jeweilige Pin-Icon rot, damit man erkennt, dass sich die aktuellen Kerzen nicht im sichtbaren Bereich des Charts befinden. Ein Klick auf einen der Pins aktiviert den Autoskalierungs-Modus wieder und richtet den Chart korrekt aus.

<figure><img src="/files/roHUrNqlstnYhcdOjafJ" alt=""><figcaption></figcaption></figure>

**Mausrad**

Mit **Ctrl(Strg)-Mausrad** kann man den Chart vertikal zoomen.

Mit **Alt-Mausrad** kann man den Chart horizontal zoomen.

**Preis\&Zeit Skalierung**

Wenn die **STRG (CTRL)** Taste gedrückt und gehalten wird sowie die linke Maustaste gedrückt ungehalten wird, ist es möglich die Preis & Zeit Achse gleichzeitig zu scalieren.

### Tastatur <a href="#chart-navigation-_tastatur" id="chart-navigation-_tastatur"></a>

Wie man mit der Tastatur durch den Chart navigieren kann, kann man sich mit den [Tastenkombinationen](https://docs.agenatrader.com/v/german/~/changes/OSCbxUs5SNZxGeFH88XF/menue-erklaerungen-and-inhalt/tool-menue/konfigurations-escort#Konfigurations_Escort__Hot_Keys) einstellen bzw. verändern.

<figure><img src="/files/kXA8gqxMiXwS3ebAiJIL" alt=""><figcaption></figcaption></figure>

## <img src="/files/doXAt96KCXSHnUtERjo1" alt="" data-size="line"> EinzelChart

*Sie können über den ChartContainer ein Chart wie folgt anzeigen lassen:*

1. Klicken Sie in der Hauptmenüleiste auf **Haupt -> Neu -> Chart Container** und wählen dort **EinzelChart** aus oder
2. Klicken Sie mit der linken Maustaste auf das Symbol <img src="/files/pUQaTmBIh65JRm0SB0Zn" alt="" data-size="line"> in der Hauptmenüleiste.

<figure><img src="/files/Fb5O62ZbK4EqsV1Noolm" alt=""><figcaption></figcaption></figure>

Am Chart-Definitions Popup kann man folgende Werte eingeben:

| Parameter     | Bedeutung                                                                                                                                                                                                                                                                                                                                                                                                                                                                                                                                                                                                                 |
| ------------- | ------------------------------------------------------------------------------------------------------------------------------------------------------------------------------------------------------------------------------------------------------------------------------------------------------------------------------------------------------------------------------------------------------------------------------------------------------------------------------------------------------------------------------------------------------------------------------------------------------------------------- |
| Instrument    | Börsenkurzbezeichnung des Instruments. Über den ![Instr](https://docs.agenatrader.com/~gitbook/image?url=https%3A%2F%2F1347375179-files.gitbook.io%2F%7E%2Ffiles%2Fv0%2Fb%2Fgitbook-legacy-files%2Fo%2Fassets%252F-MKZSsJBtSP9L4sqIe_q%252F-MP9Hk_wuyGSOjwmX_ze%252F-MP9J31wYzpH4XVwS8uk%252Finstr.png%3Falt%3Dmedia%26token%3D22496402-92f9-46d2-a0b7-54fb22d74638\&width=300\&dpr=4\&quality=100\&sign=4f615fa0\&sv=1) -Button öffnet sich der Selektionsbaum des [Instrument-Editors](https://docs.agenatrader.com/v/german/~/changes/OSCbxUs5SNZxGeFH88XF/menue-erklaerungen-and-inhalt/tool-menue/instrument-escort) |
| Periodenart   | Sekunden, Minuten, Stunden, Tage, usw.                                                                                                                                                                                                                                                                                                                                                                                                                                                                                                                                                                                    |
| Intervall     | Ist das Interval zur Periodenart (z.B. 5 Minuten auf dem Bild)                                                                                                                                                                                                                                                                                                                                                                                                                                                                                                                                                            |
| Anzahl Kerzen | Definert die Anzahl der Perioden                                                                                                                                                                                                                                                                                                                                                                                                                                                                                                                                                                                          |
| Zeitabstand   | <p>Hier kann ein Zeitraum definiert werden zu dem der Chart angezeigt wird. <strong>Days back</strong> bestimmt die Länge der Historie in die Vergangenheit.<br></p>                                                                                                                                                                                                                                                                                                                                                                                                                                                      |
| Template      | Wurden bereits [Chart Toolbar: Chart Vorlagen](https://docs.agenatrader.com/v/german/~/changes/OSCbxUs5SNZxGeFH88XF/menue-erklaerungen-and-inhalt/hauptmenue/chart-toolbar/chart-vorlagen) definiert, so kann hier eine ausgewählt werden.                                                                                                                                                                                                                                                                                                                                                                                |

Beim Bestätigen der Eingabe wird ein einzelner Chart geöffnet, welcher am Arbeitsplatz platziert werden kann, wie z.B. im u.a. Fall in eine bereits bestehende Tab-Gruppierung.

<figure><img src="/files/qRqe7qLqC6aR0YwynmOp" alt=""><figcaption></figcaption></figure>

Die zuletzt getätigten Charteinstellungen werden immer beibehalten und beim nächsten Mal als Voreinstellung wieder angeboten.

## <img src="/files/ODvUlkdP5ulrmNP9pUQz" alt="" data-size="line"> EinzelChart-Gruppe

Möchte man für ein Instrument mehrere Zeiteinheiten angezeigt bekommen, so kann man dies durch Auswahl der EinzelChart-Gruppe erreichen.

Öffnen Sie die EinzelChart-Gruppe wie folgt:

1. Klicken Sie in der Hauptmenüleiste auf **Haupt -> Neu -> Chart Container** und wählen dort **EinzelChart-Gruppe** aus oder
2. Klicken Sie mit der linken Maustaste auf das Symbol <img src="/files/0Lv87CD9dJoDW8Bo6tiA" alt="" data-size="line"> in der Hauptmenüleiste.

<figure><img src="/files/kr3qGqp91eQCMkZftoUQ" alt=""><figcaption></figcaption></figure>

Im Dialogfenster kann man folgende Werte eingeben:

| Parameter     | Bedeutung                                                                                                                                                                                                                                                                                                                                                                                                                                                                                                                                                                                  |
| ------------- | ------------------------------------------------------------------------------------------------------------------------------------------------------------------------------------------------------------------------------------------------------------------------------------------------------------------------------------------------------------------------------------------------------------------------------------------------------------------------------------------------------------------------------------------------------------------------------------------ |
| Instrument    | Börsenkurzbezeichnung des Instruments. Über den ![Instr](https://docs.agenatrader.com/~gitbook/image?url=https%3A%2F%2F1347375179-files.gitbook.io%2F%7E%2Ffiles%2Fv0%2Fb%2Fgitbook-legacy-files%2Fo%2Fassets%252F-MKZSsJBtSP9L4sqIe_q%252F-MP9Hk_wuyGSOjwmX_ze%252F-MP9J31wYzpH4XVwS8uk%252Finstr.png%3Falt%3Dmedia%26token%3D22496402-92f9-46d2-a0b7-54fb22d74638\&width=300\&dpr=4\&quality=100\&sign=4f615fa0\&sv=1) -Button öffnet sich der Selektionsbaum des [Instrument-Editors](https://docs.agenatrader.com/v/german/menue-erklaerungen-and-inhalt/tool-menue/instrument-escort) |
| Anzahl Kerzen | Definert die Anzahl der Perioden                                                                                                                                                                                                                                                                                                                                                                                                                                                                                                                                                           |
| Zeitabstand   | Hier kann ein Zeitraum definiert werden zu dem der Chart angezeigt wird: Days back bzw. Start-Datum bis End-Datum                                                                                                                                                                                                                                                                                                                                                                                                                                                                          |
| Zeiteinheiten | Hier können die vordefinierten Zeiteinheiten ausgewählt werden. Diese kann man im **Konfigurations-Еscort** in den Tabs **Generell ->** [**ActionBar**](https://docs.agenatrader.com/v/german/menue-erklaerungen-and-inhalt/tool-menue/konfigurations-escort#actionbar)                                                                                                                                                                                                                                                                                                                    |
| Hinzufügen    | <p>Mit einem Klick auf "Hinzufügen", kann man eine nicht vordefinierte Zeiteinheit in die ChartGruppe hinzufügen. <br><img src="/files/210P272E4evcdFx2wGNk" alt=""></p>                                                                                                                                                                                                                                                                                                                                                                                                                   |
| Vorlage       | Wurden bereits [Chart Toolbar: Chart Vorlagen](https://docs.agenatrader.com/v/german/menue-erklaerungen-and-inhalt/hauptmenue/chart-toolbar/chart-vorlagen) definiert, so kann hier eine ausgewählt werden.                                                                                                                                                                                                                                                                                                                                                                                |

Durch Drücken des **OK**-Button öffnet sich nun der Chart.

<figure><img src="/files/pFKmDdNnCcv1xX83P0MF" alt=""><figcaption></figcaption></figure>

Jetzt können Sie über **Einstellungen -> ChartGruppe ->** [**ContainerStyle setzen**](https://docs.agenatrader.com/v/german/menue-erklaerungen-and-inhalt/hauptmenue/chart-toolbar/chart-gruppe#Container_Style_setzen) die Anordnung der Charts verändern.

<figure><img src="/files/1vxaa8fxi9vPVia4t0Pb" alt=""><figcaption></figcaption></figure>

## <img src="/files/CfxtJoXzTKL8BIYSCwoC" alt="" data-size="line"> ListChart-Gruppe (LCG) anlegen <a href="#listchart-gruppe_lcg_anlegen" id="listchart-gruppe_lcg_anlegen"></a>

Eine ListChart-Gruppe ist ein Chartcontainer, welcher einen [Scanner](https://docs.agenatrader.com/v/german/~/changes/OSCbxUs5SNZxGeFH88XF/menue-erklaerungen-and-inhalt/hauptmenue/realtime-scanner) und einen Chartingbereich beinhaltet. Im Chartingbereich können sich 1 - 4 Charts in unterschiedlichen Zeiteinheiten befinden, die mit der Scannerliste verlinkt sind.

*Öffnen Sie die ListChart-Gruppe wie folgt:*

1. Klicken Sie in der Hauptmenüleiste auf **Haupt -> Neu -> Chart Container** und wählen dort **ListChart-Gruppe** aus oder
2. Klicken Sie mit der linken Maustaste auf das Symbol <img src="/files/qFkfSmzYprHTbVh0KNfJ" alt="" data-size="line"> in der Hauptmenüleiste.

<figure><img src="/files/FG69H5DSIwlDpzQauDxu" alt=""><figcaption></figcaption></figure>

Im ListChart-Gruppen Definitions-Popup können folgende Werte eingegeben werden:

| Parameter                   | Bedeutung                                                                                                                                                                                                                                                                                                                                    |
| --------------------------- | -------------------------------------------------------------------------------------------------------------------------------------------------------------------------------------------------------------------------------------------------------------------------------------------------------------------------------------------- |
| Instrument List             | Die Bezeichnung der [Instrumentliste](https://docs.agenatrader.com/v/german/~/changes/OSCbxUs5SNZxGeFH88XF/menue-erklaerungen-and-inhalt/tool-menue/instrument-escort/neuanlage-und-verwaltung-von-instrumentlisten), welche in der Scannerliste angezeigt werden soll; kann entweder manuell bzw. aus der DropDown-Liste ausgewählt werden. |
| Fav.                        | Mit einem Klick können Sie Ihre Favoriten "Instrument List" bestimmen. Die ausgewählte Liste wird beim nächsten Anlegen einer LCG/TCG als erste Auswahlmöglichkeit angeführt.                                                                                                                                                                |
| Price Style                 | Candle-, Bar-, Line-Chart, u.a. oder wenn man eine Vorlage ausgewählt hat "From Template".                                                                                                                                                                                                                                                   |
| Anzahl Kerzen               | Definert die Anzahl der Perioden                                                                                                                                                                                                                                                                                                             |
| Zeitabstand                 | Hier kann ein Zeitraum definiert werden zu dem der Chart angezeigt wird: Days back bzw. Start-Datum bis End-Datum                                                                                                                                                                                                                            |
| Vordefinierte Zeiteinheiten | Hier kann aufgrund einer Vordefinition im [**Allgemeine Einstellungen**](https://docs.agenatrader.com/v/german/~/changes/OSCbxUs5SNZxGeFH88XF/menue-erklaerungen-and-inhalt/tool-menue/konfigurations-escort) aus einer Liste von Zeiteinheiten ausgewählt werden (maximal 4 Zeiteinheiten).                                                 |
| Hinzufügen                  | <p>Mit einem Klick auf <strong>Hinzufügen</strong>, kann man eine nicht vordefinierte Zeiteinheit in die ChartGruppe hinzufügen. <br><img src="/files/u81FoWVuE2l4fXDjs81z" alt=""></p>                                                                                                                                                      |
| Vorlage                     | Wurden bereits [Scanner Vorlage](https://docs.agenatrader.com/v/german/~/changes/OSCbxUs5SNZxGeFH88XF/menue-erklaerungen-and-inhalt/hauptmenue/realtime-scanner/kontextmenue-des-scanners#scanner-vorlagen) definiert, so kann hier eine ausgewählt werden.                                                                                  |

<figure><img src="/files/Vj6tiagQFeR57TY6O47p" alt=""><figcaption></figcaption></figure>

Durch Drücken des OK-Button öffnet sich nun die ListChart-Gruppe.

Jetzt können Sie über **Einstellungen -> ChartGruppe ->** [**ContainerStyle setzen**](https://docs.agenatrader.com/v/german/~/changes/OSCbxUs5SNZxGeFH88XF/menue-erklaerungen-and-inhalt/hauptmenue/chart-toolbar/chart-gruppe#Container_Style_setzen) die Anordnung der Charts verändern.

Doppelclick auf den Splitter-Bar zwischen Chart und LCG Scanner verkleinert den Scanner bis auf die SymbolSpalte bzw. bis auf die Größe der erste Spalte.

Das Kontextmenü einer ListChartGroup sieht folgendermaßen aus (im nächsten Teil sind die einzelnen Funktionen beschrieben):

<figure><img src="/files/ToQ7rsVj6ViTiF1F8yEJ" alt=""><figcaption></figcaption></figure>

**ListChart-Gruppe neu laden**

Lesen Sie bitte mehr dazu in dem Kapitel: [Kontextmenü des Scanners: Instrumentliste neu laden](https://docs.agenatrader.com/v/german/~/changes/OSCbxUs5SNZxGeFH88XF/menue-erklaerungen-and-inhalt/hauptmenue/realtime-scanner/kontextmenue-des-scanners#instrumentliste-neu-laden).

[AgenaTrader ++ (plus plus](https://docs.agenatrader.com/v/german/~/changes/OSCbxUs5SNZxGeFH88XF/menue-erklaerungen-and-inhalt/tool-menue/konfigurations-escort/setup-escort)) setups funktionieren auch in der EinzelChart-Gruppe.

## <img src="/files/W54bknHXH3EtzTxUMIH8" alt="" data-size="line"> TabChart-Gruppe anlegen <a href="#tabchart-gruppe_anlegen" id="tabchart-gruppe_anlegen"></a>

Eine TabChart-Gruppe ist ein Chartcontainer, welcher eine Vielzahl von Charts zu unterschiedlichen Instrumenten gleichzeitig öffnet und die Instrumentbezeichnungen in einer BottomTab-Leiste zur Auswahl anbietet.

<figure><img src="/files/4XKFVKE1sCsSz9wdHW8G" alt=""><figcaption></figcaption></figure>

Im Chartingbereich können sich 1 - 4 Charts in unterschiedlichen Zeiteinheiten befinden. AgenaTrader schafft es ohne weiteres 100e Instrument mit jeweils 3 Charts in unterschiedlichen Zeiteinheiten anzuzeigen. Alle Charts in einem TabChart-Gruppen Container werden Realtime mit Daten versorgt. *Öffnen Sie die TabChart-Gruppe wie folgt:*

1. Klicken Sie in der Hauptmenüleiste auf **Haupt -> Neu -> Chart Container** und wählen dort **TabChart-Gruppe** aus oder
2. Klicken Sie mit der linken Maustaste auf das Symbol <img src="/files/rRaAXy2dS6ir2IJnaz0o" alt="" data-size="line"> in der Hauptmenüleiste.

<figure><img src="/files/128sOy75ftwo4roOEfSu" alt=""><figcaption></figcaption></figure>

Am TabChart-Gruppen Definitions Popup können folgende Werte eingegeben werden:

| Parameter                   | Meaning                                                                                                                                                                                                                                                                                      |
| --------------------------- | -------------------------------------------------------------------------------------------------------------------------------------------------------------------------------------------------------------------------------------------------------------------------------------------- |
| Instrument List             | Die Bezeichnung der Instrumentliste, welche die Bottom-Tab Liste aufbauen soll; kann entweder manuell bzw. aus der DropDown-Liste ausgewählt werden.                                                                                                                                         |
| Fav.                        | Mit einem Klick können Sie Ihre Favoriten "Instrument List" bestimmen. Die ausgewählte Liste wird beim nächsten Anlegen einer LCG/TCG als erste Auswahlmöglichkeit angeführt.                                                                                                                |
| Price Style                 | Candle-, Bar-, Line-Chart, u.a. oder wenn man eine Vorlage ausgewählt hat "From Template"                                                                                                                                                                                                    |
| Anzahl Kerzen               | Definert die Anzahl der Perioden                                                                                                                                                                                                                                                             |
| Zeitabstand                 | Hier kann ein Zeitraum definiert werden zu dem der Chart angezeigt wird: Days back bzw. Start-Datum bis End-Datum                                                                                                                                                                            |
| Vordefinierte Zeiteinheiten | Hier kann aufgrund einer Vordefinition im [**Allgemeine Einstellungen**](https://docs.agenatrader.com/v/german/~/changes/OSCbxUs5SNZxGeFH88XF/menue-erklaerungen-and-inhalt/tool-menue/konfigurations-escort) aus einer Liste von Zeiteinheiten ausgewählt werden (maximal 4 Zeiteinheiten). |
| Hinzufügen                  | <p>Mit einem Klick auf <strong>Hinzufügen</strong>, kann man eine nicht vordefinierte Zeiteinheit in die ChartGruppe hinzufügen. <br><img src="/files/JU27A6UfwabIdCcb829i" alt=""></p>                                                                                                      |
| Vorlage                     | Wurden bereits [ListChartGruppen-Vorlagen](https://docs.agenatrader.com/v/german/~/changes/OSCbxUs5SNZxGeFH88XF/menue-erklaerungen-and-inhalt/hauptmenue/chart-toolbar/chart-vorlagen) definiert, so kann hier eine ausgewählt werden.                                                       |

<figure><img src="/files/xYJAbVTyvBznls3WJKnv" alt=""><figcaption></figcaption></figure>

Durch Drücken des **OK**-Button öffnet sich nun die TabChart-Gruppe.

Jetzt können Sie über **Einstellungen -> ChartGruppe ->** [**ContainerStyle setzen**](https://docs.agenatrader.com/v/german/~/changes/OSCbxUs5SNZxGeFH88XF/menue-erklaerungen-and-inhalt/hauptmenue/chart-toolbar/chart-gruppe#Container_Style_setzen) die Anordnung der Charts verändern.

Das Kontextmenü einer ListChartGroup sieht folgendermaßen aus (im nächsten Teil sind die einzelnen Funktionen beschrieben):

<figure><img src="/files/ToQ7rsVj6ViTiF1F8yEJ" alt=""><figcaption></figcaption></figure>

Lesen Sie bitte mehr dazu in dem Kapitel: [Chart Toolbar: Chart-Gruppe](https://docs.agenatrader.com/v/german/~/changes/OSCbxUs5SNZxGeFH88XF/menue-erklaerungen-and-inhalt/hauptmenue/chart-toolbar/chart-gruppe).

**Bewegliche Bottom-Tabs**

Die Bottom-Tabs der TabChartGruppe können mit festgehaltener linken Maustaste an die gewünschte Position verschoben werden.

<figure><img src="/files/jSzoozrXoxVqW4yeA3Mx" alt=""><figcaption></figcaption></figure>

**Farbliche Hinterlegung der Bottom-Tabs**

Mit einem Rechtsklick auf ein Symbol, kann für dieses unter dem Menüpunkt **Eintrag markieren** eine Farbe ausgewählt werden, und durch **Reset Marked Item** entfernt werden.

<figure><img src="/files/9Gwo4NDYZaI2VMOMe7Ar" alt=""><figcaption></figcaption></figure>

**AgenaTrader++ plusplus Setups in TabChart-Gruppen**

Ist AgenaTrader++ plusplus in einem Chart der TabChartGruppe aktiviert, so werden beim Auftreten eines Setups die Vorschlags-Orders in den Chart gelegt. Darüber hinaus sieht man durch die Markierung mit dem grauen Punkt, in welcher ChartGruppe der TabChartGruppe Vorschlags-Orders (also ein Setup) vorhanden sind.

Weiter wird eine Long-Position in einer ChartGruppe der TabChartGruppe mit einem grünen Punkt und eine Short-Position in einer ChartGruppe der TabChartGruppe mit einem roten Punkt gekennzeichnet.

<figure><img src="https://docs.agenatrader.com/~gitbook/image?url=https%3A%2F%2F1347375179-files.gitbook.io%2F%7E%2Ffiles%2Fv0%2Fb%2Fgitbook-legacy-files%2Fo%2Fassets%252F-MKZSsJBtSP9L4sqIe_q%252F-MP9Hk_wuyGSOjwmX_ze%252F-MP9KOxnnNDmSM9_oQYX%252FTabChartGroup%28DE%29.jpg%3Falt%3Dmedia%26token%3D213f2f55-452a-4adc-a168-d712ce5a8eb0&#x26;width=768&#x26;dpr=4&#x26;quality=100&#x26;sign=f512489d&#x26;sv=1" alt=""><figcaption></figcaption></figure>

**TabChart-Gruppe neu laden**

TabChartGruppen-Listen sind von Instrumentlisten zu unterscheiden. Wenn man z.b. seine Instrumentliste (Currency-LongList) erweitert, so landen die neu hinzugefügten Instrumente nicht automatisch in der TabChart-Gruppe, sondern die TabChart-Gruppe muss mit der Instrumentliste (Currency-LongList) neu geladen werden.

Man hat in AgenaTrader die Möglichkeit, über **Instrument-Liste neu laden** mehrere Instrumentlisten auszuwählen (zu selektieren). Diese Information wird für die jeweilige TabChart-Gruppe gespeichert. Nun genügt z.B. ein tägliches,... **Reload Selected** im Menü um die veränderte(n) Liste(n) mit einem Mausklick neu zu laden.

Dies ist z.B. dann sinnvoll, wenn man sich jeden Tag die aktuellen Werte einer dynamischen Instrumentenliste oder eines **Screener Presets** holen möchte.

<figure><img src="https://docs.agenatrader.com/~gitbook/image?url=https%3A%2F%2F1347375179-files.gitbook.io%2F%7E%2Ffiles%2Fv0%2Fb%2Fgitbook-legacy-files%2Fo%2Fassets%252F-MKZSsJBtSP9L4sqIe_q%252F-MP9Hk_wuyGSOjwmX_ze%252F-MP9KSJ50M2XZy6NLb-9%252Ftab_reload_de.png%3Falt%3Dmedia%26token%3D5e1a0a5a-476a-440a-a482-2791aca23793&#x26;width=768&#x26;dpr=4&#x26;quality=100&#x26;sign=a33ba1cf&#x26;sv=1" alt=""><figcaption></figcaption></figure>

## <img src="/files/QAsdyu006FSaWotvpY0u" alt="" data-size="line"> Chart Galerie (AddOn)

**Chart Galerie Actionbar**

Der ActionBar befindet sich rechts vom Chart und ist mit diversen Funktionen bestückt um die Ergonomie zu verbessern.

Es gibt ein paar neue Features nur für Galerien:

* **Add New Chart** ![](/files/IiQDFfccESHpckVF6oGa)Taste kann der Benutzer die neue Kopie Chart in der Chart-Galerie hinzuzufügen.
* Mit der linken Maustaste klicken **Remove Chart** ![](/files/hDznCQUsV3zgt7BceKTW)bestehendes Chart entfernen.
* Mit **Maximize/Minimize** ![](/files/9NkMHxX5MRiLJC1aaWQD) Kann mit festgehaltener linken Maustaste an die bitte Position verschoben werden:

<figure><img src="/files/qpuxJAwHEtd3uXM6s3Vd" alt=""><figcaption></figcaption></figure>

{% hint style="info" %}
**Achtung!** Details zu den Standardfunktionen finden Sie hier [**ActionBar**](https://docs.agenatrader.com/v/german/~/changes/OSCbxUs5SNZxGeFH88XF/menue-erklaerungen-and-inhalt/hauptmenue/actionbar).
{% endhint %}

## <img src="/files/rlNpWL8uDhgIT7VmQzU0" alt="" data-size="line"> **EinzelChart Galerie**

Ermöglicht, einen Wert in zahlreichen Zeitperioden anzuzeigen.

*Sie können über den ChartContainer ein Chart wie folgt anzeigen lassen:*

1. Klicken Sie in der Hauptmenüleiste auf Haupt -> Neu -> Chart Container-> Chart Galerie und wählen dort EinzelChart Galerie aus oder
2. Klicken Sie mit der linken Maustaste auf das Symbol <img src="/files/rJzwRirxerpx7l8paRbz" alt="" data-size="line"> in der Hauptmenüleiste.

<figure><img src="/files/Dno6Zme64tHtxk7mpIkU" alt=""><figcaption></figcaption></figure>

Am Chart-Definitions Popup kann man folgende Werte eingeben:

| Parameter     | Bedeutung                                                                                                                                                                                                                                                                         |
| ------------- | --------------------------------------------------------------------------------------------------------------------------------------------------------------------------------------------------------------------------------------------------------------------------------- |
| Instrument    | Börsenkurzbezeichnung des Instruments. Über den ![](/files/7X1sp5UiUXJheG8eWtrR) -Button öffnet sich der Selektionsbaum des [Instrument-Editors](https://docs.agenatrader.com/v/german/~/changes/OSCbxUs5SNZxGeFH88XF/menue-erklaerungen-and-inhalt/tool-menue/instrument-escort) |
| Anzahl Kerzen | Legen Sie hier die Anzahl der Kerzen fest                                                                                                                                                                                                                                         |
| Zeitabstand   | Hier kann ein Zeitraum definiert werden zu dem der Chart angezeigt wird. **Days back** bestimmt die Länge der Historie in die Vergangenheit. Das **End-Datum** kann nicht verändert werden und bleibt immer das aktuelle Datum und Uhrzeit.                                       |
| Zeiteinheiten | Wählen Sie hier die gewünschten Zeiteinheiten aus unserer Liste. Sie können im Allgemeine Einstellungen->ActionBar->Zeiteinheiten auch weitere eigene hinzfügen und dann zusätzlich anwählen.                                                                                     |
| Hinzufügen    | <p>Mit einem Klick auf "Hinzufügen", kann man eine nicht vordefinierte Zeiteinheit in die ChartGruppe hinzufügen. <br><img src="/files/qc4dPIXmK7W5kpfYGzyT" alt=""></p>                                                                                                          |
| Template      | Wurden bereits [Chart Toolbar: Chart Vorlagen](https://docs.agenatrader.com/v/german/~/changes/OSCbxUs5SNZxGeFH88XF/menue-erklaerungen-and-inhalt/hauptmenue/chart-toolbar/chart-vorlagen) definiert, so kann hier eine ausgewählt werden.                                        |

**Beispiel:**

<figure><img src="/files/CH1LogSMXkGla7SRPf7Z" alt=""><figcaption></figcaption></figure>

## <img src="/files/cQ6dDHEU5qIscrPnoEmT" alt="" data-size="line"> **ListChart Galerie**

Hier können Sie eine Listen-basierte Chartgalerie erstellen, in der Sie mehrere Werte in zahlreichen Zeitperioden sehen können

Öffnen Sie die ListChart Galerie wie folgt:

1. Klicken Sie in der Hauptmenüleiste auf Haupt -> Neu -> Chart Container-> Chart Galerie und wählen dort ListChart-Gruppe Galerie aus oder
2. Klicken Sie mit der linken Maustaste auf das Symbol <img src="/files/N6rCcyIjH9eHFqLHkWaE" alt="" data-size="line"> in der Hauptmenüleiste.

<figure><img src="/files/65078eUWofyWCX8TlitS" alt=""><figcaption></figcaption></figure>

Im Dialogfenster kann man folgende Werte eingeben:

| Parameter       | Bedeutung                                                                                                                                                                                                                                  |
| --------------- | ------------------------------------------------------------------------------------------------------------------------------------------------------------------------------------------------------------------------------------------ |
| Instrument List | Die Bezeichnung der Instrumentliste, welche die Bottom-Tab Liste aufbauen soll; kann manuell bzw.<img src="/files/EbFzD0b9f60AQToIV9fA" alt="" data-size="line"> aus der DropDown-Liste ausgewählt werden.                                 |
| Fav.            | Mit einem Klick können Sie Ihre Favoriten "Instrument List" bestimmen. Die ausgewählte Liste wird beim nächsten Anlegen einer LCG/TCG als erste Auswahlmöglichkeit angeführt.                                                              |
| Anzahl Kerzen   | Definiert die Anzahl der Kerzen                                                                                                                                                                                                            |
| Zeitabstand     | Hier kann ein Zeitraum definiert werden zu dem der Chart angezeigt wird: Days back bzw. Start-Datum bis End-Datum                                                                                                                          |
| Zeiteinheiten   | Wählen Sie hier die gewünschten Zeiteinheiten aus unserer Liste. Sie können im Allgemeine Einstellungen->ActionBar->Zeiteinheiten auch weitere eigene hinzfügen und dann zusätzlich anwählen.                                              |
| Hinzufügen      | Mit einem Klick auf "Hinzufügen", kann man eine nicht vordefinierte Zeiteinheit in die ChartGruppe hinzufügen. ![](/files/N4hZIMkZRKJ7qEWWJl46)                                                                                            |
| Vorlage         | Wurden bereits [Chart Toolbar: Chart Vorlagen](https://docs.agenatrader.com/v/german/~/changes/OSCbxUs5SNZxGeFH88XF/menue-erklaerungen-and-inhalt/hauptmenue/chart-toolbar/chart-vorlagen) definiert, so kann hier eine ausgewählt werden. |

**Beispiel**

<figure><img src="/files/6Mn6yeCaYlaiwg3qDmkt" alt=""><figcaption></figcaption></figure>

## <img src="/files/iSV2WD0HfWhcPy7FtUjo" alt="" data-size="line"> **TabChart Galerie**

Erlaubt Ihnen, eine Tab-basierte Chartgalerie zu erstellen, in der Sie mehrere Werte in zahlreichen Zeiteinheiten ansehen können

Öffnen Sie die TabChart Galerie wie folgt:

1. Klicken Sie in der Hauptmenüleiste auf Haupt -> Neu -> Chart Container -> Chart Galerie und wählen dort TabChart-Gruppe Galerie aus oder
2. Klicken Sie mit der linken Maustaste auf das Symbol <img src="/files/wwQ9Hfz9gzR9d8ComqOO" alt="" data-size="line"> in der Hauptmenüleiste.

<figure><img src="/files/zNvSoPWt4q8hirtUv2Xa" alt=""><figcaption></figcaption></figure>

Im TabChart-Gruppen Kontextmenü können folgende Werte eingegeben werden:

| Parameter                   | Meaning                                                                                                                                                                                                                                |
| --------------------------- | -------------------------------------------------------------------------------------------------------------------------------------------------------------------------------------------------------------------------------------- |
| Instrument List             | Die Bezeichnung der Instrumentliste, welche die Bottom-Tab Liste aufbauen soll; kann entweder manuell oder aus der DropDown-Liste ausgewählt werden. Die Instrument Liste sollte weniger als 100 Instrumente enthalten.                |
| Fav.                        | Mit einem Klick können Sie Ihre Favoriten "Instrument List" bestimmen. Die ausgewählte Liste wird beim nächsten Anlegen einer LCG/TCG als erste Auswahlmöglichkeit angeführt.                                                          |
| Anzahl Kerzen               | Definert die Anzahl der Kerzen. Sie sollten maximal 1000 Bars laden                                                                                                                                                                    |
| Zeitabstand                 | Hier kann ein Zeitraum definiert werden zu dem der Chart angezeigt wird: Days back bzw. Start-Datum bis End-Datum/Sie sollten maximal 1000 Bars laden                                                                                  |
| Vordefinierte Zeiteinheiten | Wählen Sie hier die gewünschten Zeiteinheiten aus unserer Liste. Sie können im Allgemeine Einstellungen->ActionBar->Zeiteinheiten auch weitere eigene hinzfügen und dann zusätzlich anwählen.                                          |
| Hinzufügen                  | Mit einem Klick auf **Hinzufügen**, kann man eine nicht vordefinierte Zeiteinheit in die ChartGruppe hinzufügen. ![](/files/N4hZIMkZRKJ7qEWWJl46)                                                                                      |
| Vorlage                     | Wurden bereits [ListChartGruppen-Vorlagen](https://docs.agenatrader.com/v/german/~/changes/OSCbxUs5SNZxGeFH88XF/menue-erklaerungen-and-inhalt/hauptmenue/chart-toolbar/chart-vorlagen) definiert, so kann hier eine ausgewählt werden. |

**Beispiel**

<figure><img src="/files/7YaEqXCzwJhhFS6xAkhq" alt=""><figcaption></figcaption></figure>

## <img src="/files/9rzC4qwXD2JZYIEg59uT" alt="" data-size="line"> **EinzelChart Galerie für Instrumentenliste**

Erstellen Sie eine Diagrammgalerie, um mehrere Wertpapiere in zahlreichen Zeiträumen anzuzeigen.

*Sie können über den EinzelChart Galerie für Instrumentenliste ein Chart wie folgt anzeigen lassen:*

1. Klicken Sie in der Hauptmenüleiste auf Haupt -> Neu -> Chart Container ->Chart Galerie und wählen dort EinzelChart Galerie für Instrumentenliste aus oder
2. Klicken Sie mit der linken Maustaste auf das Symbol <img src="/files/IEXzeAFxYzkmu7Y5NyQG" alt="" data-size="line"> in der Hauptmenüleiste.

<figure><img src="/files/2vuE1HyTksuc3Aj5nk99" alt=""><figcaption></figcaption></figure>

Bitte beachten Sie, dass das Laden von Charts auf 100 Instrumente beschränkt ist, jedoch kann man händisch weitere Instrumente hinzufügen. Am Chart-Definitions Popup kann man folgende Werte eingeben:

| Parameter       | Bedeutung                                                                                                                                                                                                                                   |
| --------------- | ------------------------------------------------------------------------------------------------------------------------------------------------------------------------------------------------------------------------------------------- |
| Instrument List | Die Bezeichnung der Instrumentliste, welche die Bottom-Tab Liste aufbauen soll; kann entweder manuell bzw. aus der DropDown-Liste ausgewählt werden. Die Instrument Liste sollte weniger als 100 Instrumente enthalten.                     |
| Fav.            | Mit einem Klick können Sie Ihre Favoriten "Instrument List" bestimmen. Die ausgewählte Liste wird beim nächsten Anlegen einer LCG/TCG als erste Auswahlmöglichkeit angeführt.                                                               |
| Anzahl Kerzen   | Definert die Anzahl der Kerzen. Sie sollten maximal 1000 Bars laden                                                                                                                                                                         |
| Zeitabstand     | Hier kann ein Zeitraum definiert werden zu dem der Chart angezeigt wird. **Days back** bestimmt die Länge der Historie in die Vergangenheit. Das **End-Datum** kann nicht verändert werden und bleibt immer das aktuelle Datum und Uhrzeit. |
| Zeiteinheit     | Wählen Sie hier die gewünschten Zeiteinheiten aus unserer Liste. Sie können im Allgemeine Einstellungen->ActionBar->Zeiteinheiten auch weitere eigene hinzfügen und dann zusätzlich anwählen.                                               |
| Hinzufügen      | Mit einem Klick auf **Hinzufügen**, kann man eine nicht vordefinierte Zeiteinheit in die ChartGruppe hinzufügen. ![](/files/N6soMzpI2Yxx25sEKATj)                                                                                           |
|                 |                                                                                                                                                                                                                                             |
| Template        | Wurden bereits [Chart Toolbar: Chart Vorlagen](https://docs.agenatrader.com/v/german/~/changes/OSCbxUs5SNZxGeFH88XF/menue-erklaerungen-and-inhalt/hauptmenue/chart-toolbar/chart-vorlagen) definiert, so kann hier eine ausgewählt werden.  |

**Beispiel**

<figure><img src="/files/BtzT6o58SkZH1fp4Dfza" alt=""><figcaption></figcaption></figure>

## <img src="/files/0OsGYieiXFrTGyr7xF5I" alt="" data-size="line"> Dynamic Scanner

Öffnen Sie den Dynamic Scanner über **Haupt-> Neu->Chart Container->Dynamic Scanner** und wählen Sie aus der Liste ein Template aus, das für den Dynamic Scanner verwendet werden soll.

<figure><img src="/files/1YPAdbpWnOwvLJQII7Sa" alt=""><figcaption></figcaption></figure>

Der DynamicScanner wird geöffnet und sammelt nun automatisch alle verfügbaren Signale ein, die in einer Ihrer geöffneten Charts/ChartGruppen aktiv sind. Per default wird nach allen AnalyzerSessions gesucht, also nach jedem Signal, das Sie in einer Ihrer AnalyzerSessions aktiviert haben.

<figure><img src="/files/wm86I0C6OUleXbQkU2wf" alt=""><figcaption></figcaption></figure>

Wenn Sie die Anzeige auf bestimmte Sessions beschränken möchten, wählen Sie einfach die Sessions aus dem Dropdownmenü aus, für die der DynamicScanner die Signale sammeln soll.

<figure><img src="/files/XuP8GaMHllVpYhGBYUcT" alt=""><figcaption></figcaption></figure>

**Show open trades:** Wenn aktiviert, zeigt Dynamic Scanner offene Trades an **Show open orders:** Wenn aktiviert, zeigt Dynamic Scanner offene Aufträge an​

<figure><img src="/files/6ZGmv8b1xXcsHFSxHLRR" alt=""><figcaption></figcaption></figure>

Der DynamicScanner ist nun das einzige Tab im AgenaTrader, auf das Sie Ihren Fokus legen müssen. Sie müssen nicht mehr zwischen einzelnen Tabs wechseln und prüfen, ob Sie Signale bekommen, jedes Signal landet automatisch im DynamischenScanner und Sie können ganz bequem die Orders für alle aktiven Signale setzen.

Jedes neue Signal das im DynamicScanner angezeigt wird, erscheint mit fetter Schrift im Symbolnamen. Sobald Sie einmal auf das Signal klicken, wird das Signal als „gesehen“ angenommen und der Symbolname erscheint wieder in normaler Schrift. Dieses Verhalten soll Ihnen dabei helfen, den Überblick darüber zu behalten, welche Signale Sie schon geprüft haben, und welche gerade neu in den DynamicScanner geladen wurden.

Sobald irgendwo in Ihrem AgenaTrader wieder ein neues Signal generiert wird, wird dieses sofort und in realtime im DynamicScanner angezeigt.

Mit dem DynamicScanner wird Ihr täglicher Handel noch einen Schritt bequemer und Sie müssen sich ab sofort nur mehr auf ein einziges Tab im AgenaTrader konzentrieren, Ihre Orders setzen und die Tradeverwaltung anschließend wieder an den AT++ Algorithmus abgeben.

**Bitte beachten Sie:** Wenn Sie im AT++ Manager eine neue Session anlegen, wid diese nicht automatisch in den Dynamic Scanner übernommen, solange dieser aktiv ist. Um Ihre neue Session in den Dynamic Scanner zu übernehmen, müssen Sie ihn schließen und neu öffnen. Danach finden Sie Ihre Session unter "Aktive Sessions".

Lassen Sie sich mit dem DynamicScanner einen weiteren Arbeitsschritt abnehmen und konzentrieren Sie sich zu 100% nur noch auf die direkte Handelsentscheidung, ob Sie eine Vorschlagorder in den Markt legen oder nicht – das ist halbautomatischer Handel in Perfektion!


# Chart Typen

### Einführung <a href="#einf_hrung" id="einf_hrung"></a>

Charts in AgenaTrader teilt sich in zwei Gruppen: TB (Time based) charts:

* Candle chart
* Line chart
* Mountain chart
* Bar chart
* EquiVolume chart
* EquiVolume Shadow chart
* Candle Volume chart
* Heikin Ashi

Mehr Details über TB -Charts (mit Ausnahme Heikin Ashi und Lautstärke) können Sie in [Chart Toolbar: Preis Style](https://docs.agenatrader.com/v/german/~/changes/OSCbxUs5SNZxGeFH88XF/menue-erklaerungen-and-inhalt/hauptmenue/chart-toolbar/preis-style)

NTB (Non time based) charts:

* Ticks
* Range
* Line Break
* Kagi
* Point & Figure
* Renko
* Volume

Für diese Datenserien können nun alle AgenaTrader++ Funktionen angewendet werden. Erstellen Sie Trading Signale und Conditions im Signal Builder basierend auf z.B. Heikin Ashi aber auch allen anderen. Lassen Sie sich Indikatoren anhand des Range Charts anzeigen und Sie werden die Unterschiede zwischen dem normalen zeitbasierenden Chart sehen. Ein weiterer Meilenstein sind die Kombinationen im Signal Builder, bei welchen Sie z.B. Line Break Conditionen mit regulären Zeiteinheiten vermischen können. Abschließend scannt auch der Multi-Time-Frame und jetzt auch Multi-Data- Series Scanner nach diese Conditions und Signalen.

### Zeiteinheit- und Intervall-Einstellungen im Chart <a href="#zeiteinheit-und-intervall-einstellungen-im-chart" id="zeiteinheit-und-intervall-einstellungen-im-chart"></a>

*Zum Öffnen der Zeiteinheiten haben Sie drei Möglichkeiten:*

1. Ein Klick auf das Symbol ![](/files/eBA3Mtqx5X47RnwFAEFY)in der Chart-Toolbar oder
2. Klicken Sie mit der rechten Maustaste in den Chart und wählen Sie **Einstellungen -> Zeiteinheit** aus.
3. Klicken SIe ins Chart, drücken Sie dann die **Leertaste** und geben dann im offenem Dialogtyp das Intervall ein:

<figure><img src="/files/b0b9OpDW1wOo5sadhIiZ" alt=""><figcaption></figcaption></figure>

Hier kann man sich die voreingestellten Zeiteinheiten (Periodenart bzw. Intervall) über [Tools -> Allgemeine Einstellungen -> Generell -> ActionBar](https://docs.agenatrader.com/v/german/menue-erklaerungen-and-inhalt/hauptmenue/actionbar) selbst definieren bzw. abändern.

Die Einstellungen für die Chart finden Sie unter Zeitrahmen. Um ein voreingestelltes Chart zur Liste der Zeitrahmen hinzuzufügen, öffnen Sie die Globale Konfiguration und die Aktionsleisten-Einstellungen. Unter Zeitrahmen können Sie nun Ihre gewünschten Chart -Zeitraum-Einstellungen eingeben.

<figure><img src="/files/rFgMNcHZaZ1LkdqzOjRK" alt=""><figcaption></figcaption></figure>

**Folgende Einstellungen können getroffen werden:**

* Seconds: x Sekunden pro Candle
* Minutes: x Minuten pro Candle
* Hours: x Stunden pro Candle
* Days: x Tage pro Candle
* Weeks: x Wochen pro Candle
* Months: x Monate pro Candle
* Ticks: x Ticks pro Candle (ein Tick steht für einen Trade)
* Volumes: x gehandelte Aktien/Kontrakte pro Candle
* Range: x Cents/Pips/Punkte/Ticks pro Candle (Preisspanne)

In diesem Fall steht x für das eingegebene Intervall.

![](https://docs.agenatrader.com/~gitbook/image?url=https%3A%2F%2F1347375179-files.gitbook.io%2F%7E%2Ffiles%2Fv0%2Fb%2Fgitbook-legacy-files%2Fo%2Fassets%252F-MKZSsJBtSP9L4sqIe_q%252F-MP9P3vFZH_eTVbqUMdh%252F-MP9PLQxmqMQcIJmppck%252Fchart_timeframe.png%3Falt%3Dmedia%26token%3D2f18d81d-2e8f-45e5-9d93-215b34825bf1\&width=768\&dpr=4\&quality=100\&sign=74f90e5\&sv=1)

### Instrument wechseln

Über **Custom Parameter** öffnet man den **Instrument-Dialog** über den man folgende Chart-Einstellungen tätigen kann:

* Instrument: Eingabe des Instrumenten-Symbols. Dafür kann man eine von den Methoden verwenden:
  * Das Instrument-Symbol manuell eingeben. bei der Eingabe wird geprüft, ob das Instrument im InstrumentManager registriert ist. Existiert keine Registratur wird die Eingabe automatisch gelöscht.
  * Mit einem Klick auf das ![](/files/84F2LW3sq9PdC6xXjwDl) -Button kann der InstrumentManager geöffnet werden, woraus ein Instrument ausgewählt werden kann.
* Periodenart/Intervall: hier kann man die Zeiteinheit für den Chart definieren.
* PriceStyle: definiert den ChartType (candle chart, bar chart, line chart, usw.)
* Historie:
  * Über **Anzahl Kerzen** wird exakt diese Anzahl historischer Perioden im Chart angezeigt.
  * Bei **Zeitabstand** kann man sich mittels "Days back" bzw. dem "Von/Bis Datum" die Historie über eine Zeitspanne hinweg anzeigen lassen.
* Vorlage: hat man Chart-Vorlagen definiert und gespeichert, so kann man diese Vorlagen zum Aufbau des Charts verwenden. Wurde keine Vorlage ausgewählt, so wird die Default-Vorlage herangezogen.

![](https://docs.agenatrader.com/~gitbook/image?url=https%3A%2F%2F1347375179-files.gitbook.io%2F%7E%2Ffiles%2Fv0%2Fb%2Fgitbook-legacy-files%2Fo%2Fassets%252F-MKZSsJBtSP9L4sqIe_q%252F-MP9P3vFZH_eTVbqUMdh%252F-MP9PROlEprZP8Z8ULB-%252Ftimeframe.PNG%3Falt%3Dmedia%26token%3D0b685848-bbf7-489e-a9ed-d7ef04826db1\&width=768\&dpr=4\&quality=100\&sign=4661b270\&sv=1)

{% hint style="info" %}
Hinweis: Mit "Direkt" ist ein Chart gemeint, dessen Daten und Style 1:1 vom Datenfeed kommt. Im Gegensatz dazu ist mit "Verarbeitet" gemeint, dass zwar die Daten vom Datenfeed kommen, jedoch wird der spezifische Chartstyle vom AgenaTrader erstellt.
{% endhint %}

### **Direktes Chart** <a href="#direktes-chart" id="direktes-chart"></a>

Daten und Style 1 zu 1 vom Datenfeed

<figure><img src="/files/X8Phr1OMN6GmqXxFlibe" alt=""><figcaption></figcaption></figure>

{% hint style="warning" %}
**Achtung!** Für Minuten-Charts (wie 3min, 7min etc) startet die Berechnung, wenn Märkte öffnen
{% endhint %}

### **Verarbeitetes Chart** <a href="#verarbeitetes-chart" id="verarbeitetes-chart"></a>

Daten vom Datenfeed, Chartstyle in AgenaTrader berechnet.

<figure><img src="/files/Jn3u9fVB31moK5IbbXgT" alt=""><figcaption></figcaption></figure>

## Time Based

*Öffnen Sie die Preistypen-Liste wie folgt:*

1. Klicken Sie auf das Symbol ![](/files/eg9vqcQGGt84Q0YGEAG1) in der Chart-Toolbar oder
2. Klicken Sie mit der rechten Maustaste in den Chart und wählen Sie **Einstellungen -> Preis Style** aus.

<figure><img src="/files/perMIHlC2bMtWTYcc0ks" alt=""><figcaption></figcaption></figure>

**Darvas boxes** Darvas boxes sind eine mächtige Handelsmethode. Grafische Darstellung der Boxen basiert auf der Trend-Methode (Momentum). Möchte man die Darvas Boxes am Chart angezeigt bekommen, so kann man diese Option im Kontextmenü wählen.

Hier erfahren Sie alles über die im AgenaTrader vorhandenen Preistypen.

## <img src="/files/uPrtm31TfDdkkM1Ugyrg" alt="" data-size="line"> Candle Chart <a href="#candle-chart" id="candle-chart"></a>

Die Candle Charts zeigen zur ausgewählten Perioden/Intervall-Kombination an:

* der Eröffnungskurs
* das Kurshoch
* das Kurstief
* der Schlusskurs

<figure><img src="/files/ocDdVBoYBpKi1zDqj8VG" alt=""><figcaption></figcaption></figure>

Aufgrund des Kerzenkörpers und der Kerzenfarbe (siehe [Farbeinstellungen](https://docs.agenatrader.com/v/german/menue-erklaerungen-and-inhalt/hauptmenue/chart-toolbar/farbe)) erkennt man den Eröffnungs- bzw. Schlusskurs. Die Hoch- und Tiefkurse erkennt man an den Linien (Tails) die über bzw. unter dem Körper herausragen.

## <img src="/files/0JyKCTeOHCR1YPoQ499A" alt="" data-size="line"> Linien Chart <a href="#linien-chart" id="linien-chart"></a>

Im Linien Chart werden die Schlusskurse der Periode miteinander verbunden.

<figure><img src="/files/A8PFnxTKyuuOPHd2xIZt" alt=""><figcaption></figcaption></figure>

## <img src="/files/HEuBzr5DKCfGpYnvK2V8" alt="" data-size="line"> Mountain Chart <a href="#mountain-chart" id="mountain-chart"></a>

Im Mounten Chart werden wie im Linien Chart die Schlusskurse der Periode miteinander verbunden, und noch zusätzlich der untere Bereich farblich eingefärbt.

<figure><img src="/files/7gKjUvWe6UWCkAhHKLz5" alt=""><figcaption></figcaption></figure>

## <img src="/files/HWjHjlLRbtvRSMB6Ed4m" alt="" data-size="line"> Bar Chart <a href="#bar-chart" id="bar-chart"></a>

Im Bar(Balken)Chart werden die Kurse ähnlich wie im CandleChart dargestellt. Der Unterschied ist, dass der Eröffnungskurs anhand des kurzen Striches links bzw. der Schlusskurs rechts vom Kursbalken ersichtlich ist.![](/files/KG6A7X9Mn2Zux460OJaf)

## <img src="/files/24F7UT5hqkthX7zxlEaw" alt="" data-size="line"> EquiVolume <a href="#equivolume" id="equivolume"></a>

Das EquiVolume-Chart ist eine Chart-Darstellungs-Art in der die Preis/Zeit-Komponente und die Volumens-Komponente miteinander verbunden werden.

In diesem Chart wird jedoch nur der Hoch- und Tiefkurs der Preisbewegung innerhalb der Periode in Betracht gezogen. Anhand der Dicke der Kerze kann man das jeweilige Volumen erahnen.

<figure><img src="/files/yDIrL3xRlBLf3oYtZApP" alt=""><figcaption></figcaption></figure>

## <img src="/files/1WYVrGOpFfRavJo3hktd" alt="" data-size="line"> EquiVolume Shadow <a href="#equivolume-shadow" id="equivolume-shadow"></a>

Diese Kerzendarstellung ist grundsätzlich gleich zu betrachten wie die des EquiVolume-Charts.

Der Unterschied liegt haupsächlich darin, dass der Kerzenkörper bei steigendem Kurs vom Tief- bis zum Schlusskurs bzw. bei fallendem Kurs vom Hoch- bis zum Schlusskurs dargestellt wird. Der restliche Teil der gegen die Richtung der Kerze lief, wird als Schatten dargestellt.

<figure><img src="/files/CfAy3cZcyl8oQeR4v5qw" alt=""><figcaption></figcaption></figure>

## <img src="/files/15XHEapwAUvGfBEwrfvR" alt="" data-size="line"> Candle Volumen <a href="#candle-volumen" id="candle-volumen"></a>

Die KerzenVolume Darstellung verhält sich gleich wie die Candle Chart-Darstellung. Die Stärke der Kerzen richtet sich nach dem Volumen.

<figure><img src="/files/jZepIyeeugr0hRTlcInV" alt=""><figcaption></figcaption></figure>

## Non Time Based <a href="#action_bar" id="action_bar"></a>

### Ticks <a href="#ticks" id="ticks"></a>

Bei Zeit basierten Charts wird nach einem bestimmten Zeitraum (z.B. 5 Minuten) eine neue Kerze gezeichnet.

Bei Tick Charts wird immer dann eine neue Kerze gezeichnet wenn eine bestimmte Anzahl an Trades (z.B. 150 Ticks/Trades) ausgeführt worden ist.

<figure><img src="/files/Sa1krE3SFw891rlao7vu" alt=""><figcaption></figcaption></figure>

{% hint style="warning" %}
HINWEIS: Wir haben das Limit zur Verwendung von Tickdaten auf 20 Werktage (gedeckelt auf 10.000 Bars) hinauf gesetzt. Wir hoffen uns damit den Wünschen nach mehr Historie anzunähern
{% endhint %}

### <img src="/files/jxg0OeKDZRIQZImrszBU" alt="" data-size="line"> **Point & Figure** <a href="#point_real_amp_figure" id="point_real_amp_figure"></a>

Der Point & Figure (P\&F) Chart ist von Charles Dow entwickelt worden und wurde 1898 erstmals publiziert. Damit ist diese Chartdarstellungsform die älteste aller westlichen Chartdarstellungsformen. Das besondere an dieser Chartdarstellung ist, dass hier auf die Zeitachse verzichtet wird. Ziel dieser Darstellungsform ist es bestehende Trends besser hervorheben zu können. Der P\&F-Chart besteht aus 'X'-Säulen, die steigende Kurse repräsentieren und 'O'-Säulen, die fallende Kurse repräsentieren. Die Höhe einer Säule hängt von der so genannten 'Box-size', der Kursspanne für ein X oder ein O ab. Erst wenn der Preis eines Basiswertes die 'Box-size' übersteigt, wird in einem Aufwärtstrend ein neues X gezeichnet.

**Beispiel.** Nehmen wir an, dass Der Kurs der Daimler-Aktie aktuell bei 35,10€ leigt. Bei einer 'Box-size' von 1€ würde im P\&F-Chart erst ein neues X gezeichnet werden können, wenn der Kurs bei mindestens 36€ steht. Alle Werte zwischen 35€ und 36€ finden keine Beachtung. Für O-Säulen verhält sich mit verändertem Vorzeichen genauso.

Neben der 'Box-size' ist das 'Reversal' das zweite wichtige Element des P\&F-Charts. Das 'Reversal' bestimmt den Zeitpunkt des Wechsels zwischen X- und O-Säulen. Das 'Reversal' ist vom Trader festzulegen und gibt an, nach wie vielen 'Box-sizes' vom letzten Hoch- oder Tiefpunkt eine Trendwende angenommen werden kann.

**Beispiel.** Nehmen wir an, dass Der Tiefstkurs der Daimler Aktie bei 15€ steht. Bei einem 'Reversal' von fünf 'Box-sizes' und einer 'Box-sizes' von einem Euro (1€ x 5), findet ab einem Kurs von 20€ einen Wechsel von O-Säulen auf X-Säulen statt. Steigt der Kurs nur auf 19€ und fällt danach wieder, sogar noch unter das Tief bei 15€, wird die Erholung komplett ignoriert und die O-Säule wird weiter fortgesetzt.

<figure><img src="https://docs.agenatrader.com/~gitbook/image?url=https%3A%2F%2F1347375179-files.gitbook.io%2F%7E%2Ffiles%2Fv0%2Fb%2Fgitbook-legacy-files%2Fo%2Fassets%252F-MKZSsJBtSP9L4sqIe_q%252F-MP9Hk_wuyGSOjwmX_ze%252F-MP9O0tJoyMCMbNXpts1%252FPoint%2526Figure.PNG%3Falt%3Dmedia%26token%3D9307a04f-6bef-4416-a6a2-c185ed830d87&#x26;width=768&#x26;dpr=4&#x26;quality=100&#x26;sign=bfa480a7&#x26;sv=1" alt=""><figcaption></figcaption></figure>

Folgende Einstellungen können getätigt werden:

<figure><img src="https://docs.agenatrader.com/~gitbook/image?url=https%3A%2F%2F1347375179-files.gitbook.io%2F%7E%2Ffiles%2Fv0%2Fb%2Fgitbook-legacy-files%2Fo%2Fassets%252F-MKZSsJBtSP9L4sqIe_q%252F-MP9Hk_wuyGSOjwmX_ze%252F-MP9O3haK1j02FWuIqRP%252FpOINTS%2520AND%2520FIGURE%2520time%2520frame%2520reversal.PNG%3Falt%3Dmedia%26token%3Da8b08c38-4694-4732-929e-0d98079d292f&#x26;width=768&#x26;dpr=4&#x26;quality=100&#x26;sign=4c8defe5&#x26;sv=1" alt=""><figcaption></figcaption></figure>

1\. Box Size: die Größe eines "X" oder "O"; nach welcher Anzahl an Ticks/Pips/etc. soll eine neue Box gezeichnet werden. Je kleiner die 'Box Size' ist, desto sensibeler wird der Chart.ATR (20): ATR-Multiplikator; die 'Box Size'/'Reversal Size' wird aus der eingegebenen Zahl und der durchschnittlichen Kerzengröße der letzten 20 Kerzen berechnet. 2. Reversal Size: die Größe der Umkehr; nach wievielen 'Reversal-Boxes' wird eine neue Spalte mit dem neuen Symbol ("X" oder "O") gezeichnet

### <img src="/files/dWNp5uSxz5GPjd8NtkrK" alt="" data-size="line"> Renko <a href="#renko" id="renko"></a>

Der Renko-Chart ist ebenfalls eine Preisdarstellungsform, welcher die Zeitkomponente fehlt. Der Renko-Chart kommt, genau wie der Candlestick-Chart, aus Japan. Sein Ursprung liegt im japanischen Wort "Renga", was auf deutsch "Ziegel" bedeutet. In seiner Art ähnelt der Renko Chart aber eher dem Point & Figure von Charles Dow. Genau wie der Point & Figure Chart kommt auch der Renko Chart ohne Zeitachse aus. Dieser Chart besteht aus schwarzen und weißen "Ziegel" den so genannten Bricks, wobei ein schwarzer Brick für fallende Kurse steht und ein weißer Brick für steigende Kurse. Für die Darstellung einer Kursreihe durch den Renko Chart reichen lediglich die Schlusskurse des beobachteten Wertpapiers. Ein neuer Brick entsteht, wenn sich der Kurs auf Schlusskursbasis um die Mindest-Brick-Größe verändert hat. Bewegt sich der Kurs mehrere Tage mit einer nur sehr geringen Volatilität, bzw. ist die kritische Brick-Größe entsprechend groß gewählt, so kann es einige Tage dauern, bis ein neuer Brick entsteht.

Die wesentliche Eigenschaft des Renko Charts ist wie beim Point & Figure Chart die klare Darstellung von bestehenden Trends und Trendwenden. Wichtig bei der Chartdarstellung durch den Renko Chart ist die Wahl der Brick-Größe. Eine zu kleine Brick-Größe würde sehr häufig Trendwenden anzeigen und dementsprechend oft auch Fehlsignale produzieren. Eine zu große Brick-Größe würde demgegenüber erst sehr spät eine Trendwende anzeigen.

<figure><img src="https://docs.agenatrader.com/~gitbook/image?url=https%3A%2F%2F1347375179-files.gitbook.io%2F%7E%2Ffiles%2Fv0%2Fb%2Fgitbook-legacy-files%2Fo%2Fassets%252F-MKZSsJBtSP9L4sqIe_q%252F-MP9Hk_wuyGSOjwmX_ze%252F-MP9O7Vir9VteJtKGf75%252FRENKO.PNG%3Falt%3Dmedia%26token%3D8be2d0cb-bb5b-432a-b100-7fb3d8195b27&#x26;width=768&#x26;dpr=4&#x26;quality=100&#x26;sign=63a87e76&#x26;sv=1" alt=""><figcaption></figcaption></figure>

Folgende Einstellungen können getätigt werden:

<figure><img src="https://docs.agenatrader.com/~gitbook/image?url=https%3A%2F%2F1347375179-files.gitbook.io%2F%7E%2Ffiles%2Fv0%2Fb%2Fgitbook-legacy-files%2Fo%2Fassets%252F-MKZSsJBtSP9L4sqIe_q%252F-MP9Hk_wuyGSOjwmX_ze%252F-MP9OB5laJCRvuKEU_RL%252FRENKO%2520time%2520frame.PNG%3Falt%3Dmedia%26token%3D7f878869-2d43-44e6-ada3-5474be90ebb9&#x26;width=768&#x26;dpr=4&#x26;quality=100&#x26;sign=736f30d0&#x26;sv=1" alt=""><figcaption></figcaption></figure>

1\. Brick Size: Größe eines Renko-Bricks 2. Use ATR (20): ATR-Multiplikator; die Brick Size wird aus der eingegebenen Zahl und der durchschnittlichen Kerzengröße der letzten 20 Kerzen berechnet

Renko Chart erstellen und Indikatoren berechnen lassen

Im Beispiel wird ein Renko Chart auf Basis von Tagesdaten mit einer Box-Size von 25 Points eingestellt. Dieser NTB-Chart ist nun im Zeiteinheiten-Dropdown zu finden, mit einem Klick wird der Renko-Chart geladen.

Da die NTB-Charts mit der Chart Historien Erweiterung nun komplett als eigene Datenserie verfügbar sind, können Sie jeden verfügbaren Indikator auf Basis von z.B. Renko-Charts berechnen. Das Ergebnis sehen Sie im Screenshot rechts. Sie haben jetzt eine bisher noch nicht dagewesene Auswahl an Berechnungsmethoden und Einsatzgebiete für Indikatoren. Sie sehen bereits im Screenshot rechts, wie stark die Anzeige des RSI im Renko-Chart vom normalen Tageschart abweicht.

<figure><img src="https://docs.agenatrader.com/~gitbook/image?url=https%3A%2F%2F1347375179-files.gitbook.io%2F%7E%2Ffiles%2Fv0%2Fb%2Fgitbook-legacy-files%2Fo%2Fassets%252F-MKZSsJBtSP9L4sqIe_q%252F-MP9Hk_wuyGSOjwmX_ze%252F-MP9NqIFtEXLW_REXhHx%252FUntitled-1.png%3Falt%3Dmedia%26token%3Db7fb1e80-9f8c-4a5a-850f-0dc644429e58&#x26;width=768&#x26;dpr=4&#x26;quality=100&#x26;sign=d5d3e3a6&#x26;sv=1" alt=""><figcaption></figcaption></figure>

#### Signal Builder – RSI Condition mit Renko <a href="#condition_escort_rsi_condition_mit_renko" id="condition_escort_rsi_condition_mit_renko"></a>

Die Historien Management Erweiterung erlaubt es zusätzlich, dass Sie sich auch Conditions und Trading Signale mit diesen Indikatoren berechnen lassen. Im Signal Builder müssen Sie dafür als Time Frame wieder den Renko-Chart auswählen. Hier sind alle NTB-Charts verfügbar, die Sie im Allgemeine Einstellungen eingeben, wie weiter oben beschrieben.

<figure><img src="https://docs.agenatrader.com/~gitbook/image?url=https%3A%2F%2F1347375179-files.gitbook.io%2F%7E%2Ffiles%2Fv0%2Fb%2Fgitbook-legacy-files%2Fo%2Fassets%252F-MKZSsJBtSP9L4sqIe_q%252F-MP9Hk_wuyGSOjwmX_ze%252F-MP9NtMzbooyqWmjpmOk%252FHistory%2520management%2520cond%2520escort.PNG%3Falt%3Dmedia%26token%3D6f9eec73-3fe9-440b-a401-557339461e56&#x26;width=768&#x26;dpr=4&#x26;quality=100&#x26;sign=880b0742&#x26;sv=1" alt=""><figcaption></figcaption></figure>

Diese Condition können Sie nun zusätzlich noch mit einem Setup hinterlegen, z.B. einem BarByBar-Stop, der sich nun ebenfalls auf den Renko-Chart berechnet und den Stopp nach jedem Renko-Bar nachzieht.

<figure><img src="https://docs.agenatrader.com/~gitbook/image?url=https%3A%2F%2F1347375179-files.gitbook.io%2F%7E%2Ffiles%2Fv0%2Fb%2Fgitbook-legacy-files%2Fo%2Fassets%252F-MKZSsJBtSP9L4sqIe_q%252F-MP9Hk_wuyGSOjwmX_ze%252F-MP9NvpQ-26haV-SE10n%252FRSI%2520LONG.PNG%3Falt%3Dmedia%26token%3Dcb13620e-1805-4d42-97a5-2d3245b575ee&#x26;width=768&#x26;dpr=4&#x26;quality=100&#x26;sign=2e9a020f&#x26;sv=1" alt=""><figcaption></figcaption></figure>

#### Multi-Time-Frame und Multi-Data-Series Scanner

Die Historien Management Erweiterung erlaubt es außerdem, dass Sie nach diesem Signal jetzt mit dem Analyzer Spalte in real-time scannen dürfen, und haben tausende Instrumente auf Renko-Basis oder jedes anderen NTB-Style im Blick, jetzt entgeht Ihnen kein Signal mehr.

Um im Analyzer Spalte mit Renko-Daten screenen zu können, wählen Sie für die Zeiteinheit in den Einstellungen für die Analyzer-Spalte wieder die zuvor im Allgemeine Einstellungen eingestellte Datenserie aus.

<figure><img src="https://docs.agenatrader.com/~gitbook/image?url=https%3A%2F%2F1347375179-files.gitbook.io%2F%7E%2Ffiles%2Fv0%2Fb%2Fgitbook-legacy-files%2Fo%2Fassets%252F-MKZSsJBtSP9L4sqIe_q%252F-MP9Hk_wuyGSOjwmX_ze%252F-MP9Nz-PROckD0y8i2xX%252FHistory%2520managemen%2520columns.png%3Falt%3Dmedia%26token%3Dda5c9e3c-eee4-4989-9141-f7327599e9db&#x26;width=768&#x26;dpr=4&#x26;quality=100&#x26;sign=d6baad57&#x26;sv=1" alt=""><figcaption></figcaption></figure>

### <img src="/files/HedMUx4Jm4xfyM7VQ8E9" alt="" data-size="line"> Kagi <a href="#kagi" id="kagi"></a>

Kagi Charts können behilflich sein, um die Hauptstrecke eines Trends zu handeln, denn sie zeigen das zugrundeliegende Angebot-Nachfrage-Kräfteverhältnis eines Wertes an. Eine Serie (dicker) Yang Linien, sprich eine Folge höherer Schultern und Taillen zeigt an, dass die Nachfrage das Angebot übertrifft und eine Aufwärtsbewegung vorhanden ist. Die Bullen behaupten in diesem Fall ihre Vormachtstellung. Eine Serie (dünner) Yin Linien, sprich eine Folge tieferer Schultern und Taillen zeigt dementsprechend das Gegenteil an, nämlich dass das Angebot die Nachfrage übersteigt, was fallende Kurse bedeutet. Die Bären sind in diesem Falle stärker als die Bullen.

<figure><img src="https://docs.agenatrader.com/~gitbook/image?url=https%3A%2F%2F1347375179-files.gitbook.io%2F%7E%2Ffiles%2Fv0%2Fb%2Fgitbook-legacy-files%2Fo%2Fassets%252F-MKZSsJBtSP9L4sqIe_q%252F-MP9Hk_wuyGSOjwmX_ze%252F-MP9ODz9zuhHZK9lTSSt%252FKagi.PNG%3Falt%3Dmedia%26token%3Dd6a0c826-78e3-48db-8ad5-cc802274c4a7&#x26;width=768&#x26;dpr=4&#x26;quality=100&#x26;sign=a33bd5a&#x26;sv=1" alt=""><figcaption></figcaption></figure>

Folgende Einstellungen können getätigt werden:

<figure><img src="https://docs.agenatrader.com/~gitbook/image?url=https%3A%2F%2F2805764894-files.gitbook.io%2F%7E%2Ffiles%2Fv0%2Fb%2Fgitbook-legacy-files%2Fo%2Fassets%252F-MKZSsJBtSP9L4sqIe_q%252F-MRKx3J1QfOTre9v3M5l%252F-MRKyONTIIFBqkGHH1Wo%252FRSI%2520LONG.PNG%3Falt%3Dmedia%26token%3D37b6d607-e3f4-447e-b1a2-170197a83673&#x26;width=768&#x26;dpr=4&#x26;quality=100&#x26;sign=4f4c2646&#x26;sv=1" alt=""><figcaption></figcaption></figure>

#### **Multi-timeframe and multi-data series scanner** <a href="#multi-timeframe_and_multi-data_series_scanner" id="multi-timeframe_and_multi-data_series_scanner"></a>

Besides this, you can now use the Analyzer Column to have this signal scanned for in real time, allowing you to keep an eye on thousands of instruments based on Renko or any other NTB style, so that you do not miss a single signal.

To screen using Renko data in the Analyzer Column, in the settings for the Analyzer Column column, again select the data series previously set in the Global Configuration for the timeframe.

<figure><img src="https://docs.agenatrader.com/~gitbook/image?url=https%3A%2F%2F2805764894-files.gitbook.io%2F%7E%2Ffiles%2Fv0%2Fb%2Fgitbook-legacy-files%2Fo%2Fassets%252F-MKZSsJBtSP9L4sqIe_q%252F-MRKx3J1QfOTre9v3M5l%252F-MRKyTIS5h445w78GCjA%252FHistory%2520managemen%2520columns.png%3Falt%3Dmedia%26token%3Dbc57b070-2594-4450-9e58-5f7efcc20a79&#x26;width=768&#x26;dpr=4&#x26;quality=100&#x26;sign=cbf1e499&#x26;sv=1" alt=""><figcaption></figcaption></figure>

<figure><img src="https://docs.agenatrader.com/~gitbook/image?url=https%3A%2F%2F1347375179-files.gitbook.io%2F%7E%2Ffiles%2Fv0%2Fb%2Fgitbook-legacy-files%2Fo%2Fassets%252F-MKZSsJBtSP9L4sqIe_q%252F-MP9Hk_wuyGSOjwmX_ze%252F-MP9OGupjy8WUmEFWIql%252FKagi%2520timeframe.PNG%3Falt%3Dmedia%26token%3D151ca34b-fd94-48ef-a944-6d315c42e5aa&#x26;width=768&#x26;dpr=4&#x26;quality=100&#x26;sign=e9c3cba0&#x26;sv=1" alt=""><figcaption></figcaption></figure>

1\. Reversal Size: die Größe der Umkehr 2. Use ATR (20): ATR-Multiplikator; die Reversal Size wird aus der eingegebenen Zahl und der durchschnittlichen Kerzengröße der letzten 20 Kerzen berechnet.

### <img src="/files/5hfOxLwAX1Pokco6Y7iy" alt="" data-size="line"> Three Line Break <a href="#three_line_break" id="three_line_break"></a>

Der Three Line Break Chart passt sich der Dynamik der Kurse automatisch an und hat den Ruf Trendwenden anzuzeigen. Die Säulen dieses Chart Typs sind dabei unterschiedlich hoch, wobei eine weiße für steigende und eine rote für fallende Kurse steht. Eine weiße Säule wird gezeichnet, wenn der heutige Schlusskurs über dem gestrigen Hoch liegt. Eine rote Säule wird gezeichnet, wenn der heutige Schlusskurs unter dem gestrigen Tief liegt. Ist keines dieser beiden Szenarien zutreffend, so wird die Handelsperiode vernachlässigt. Ist ein starker Trend vorhanden, in dem drei weiße Säulen hintereinander gezeichnet werden ohne dass unter dem Tief geschlossen wird, so muss das Tief dieser drei Linien durchschritten werden, um eine Trendumkehr hervorzurufen. Der Kurs von drei weißen oder schwarzen Säulen muss also durchbrochen werden, um eine Trendwende zu signalisieren.

<figure><img src="https://docs.agenatrader.com/~gitbook/image?url=https%3A%2F%2F1347375179-files.gitbook.io%2F%7E%2Ffiles%2Fv0%2Fb%2Fgitbook-legacy-files%2Fo%2Fassets%252F-MKZSsJBtSP9L4sqIe_q%252F-MP9Hk_wuyGSOjwmX_ze%252F-MP9OJfFEMJPGR-2LPjT%252FLine%2520Break.PNG%3Falt%3Dmedia%26token%3D96ac9a3d-fc8a-4313-ac83-4bfd45f4fdc5&#x26;width=768&#x26;dpr=4&#x26;quality=100&#x26;sign=4c02620&#x26;sv=1" alt=""><figcaption></figcaption></figure>

Folgende Einstellungen können getätigt werden:

<figure><img src="https://docs.agenatrader.com/~gitbook/image?url=https%3A%2F%2F1347375179-files.gitbook.io%2F%7E%2Ffiles%2Fv0%2Fb%2Fgitbook-legacy-files%2Fo%2Fassets%252F-MKZSsJBtSP9L4sqIe_q%252F-MP9Hk_wuyGSOjwmX_ze%252F-MP9OM9Qmwd-Tu1D0AVo%252Fthree%2520liness%2520time%2520frame.PNG%3Falt%3Dmedia%26token%3D5083d383-5b49-4522-b411-eb24019c81e8&#x26;width=768&#x26;dpr=4&#x26;quality=100&#x26;sign=e0a207ff&#x26;sv=1" alt=""><figcaption></figcaption></figure>

### ![](/files/TK0C9Z8vMUFoUfohrnW5) Heikin Ashi <a href="#heikin_ashi" id="heikin_ashi"></a>

Der Heikin-Ashi-Chart wird wie ein regulärer Candlestick-Chart konstruiert. Wie bei jedem Chartmodul kann auch im Heikin-Ashi der Zeitraum frei gewählt werden und beliebig mit der Chartsoftware ausgeweitet oder verengt werden (z.B. täglich, 5-minütlich, minütlich). In dem Chart werden der Eröffnungskurs und der Schlusskurs der letzten Periode sowie der Eröffnungskurs, der Schlusskurs, das Kurshoch und das Kurstief aus der aktueller Priode verwendet, um kombinierte Kerzen zu erzeugen und "Noise" aus dem chart herauszufiltern.

In einem Tageschart bedeutet ein Heikin-Ashi-Candlestick einen Zeitraum von genau einem Tag. Tage, die eine Abwärtsbewegung zeigen, sind rote Kerzen, Tage mit Aufwärtsbewegung dagegen grüne Kerzen. Der Rest der Darstellung von Heikin-Ashi-Kerzen, ist wie bei den normalen Candlesticks.

Heikin-Ashi-Kerzen sind für jeden Markt geeignet, werden jedoch häufig in Aktienmärkten oder in Rohstoffmärkten eingesetzt.

**Es gibt fünf wichtige Signalwirkungen, die die Identifizierung von Trends erleichtern sollen:**

* Grüne Kerzen mit keinen langen Schatten indizieren einen starken Aufwärtstrend (man soll die Gewinne dann laufen lassen).
* Grüne Kerzen indizieren einen Aufwärtstrend, so dass der Trader möglicherweise seine Long-Positionen ausweiten könnte oder aus Short-Positionen besser aussteigt.
* Eine Kerze mit einem schmalen Körper begleitet von höheren und tieferen Schatten (damit sind immer die schmalen Linien oberhalb und unterhalb des Kerzenkörpers gemeint) indiziert einen Trendwechsel. Trader, die das Risiko lieben, können hier kaufen oder verkaufen, während andere Trader auf eine Trendbestätigung warten, bevor sie Long oder Short gehen.
* Rote Kerzen indizieren einen Abwärtstrend, man könnte demnach zu bereits bestehenden Short-Positionen zugeben oder bestehende Long-Positionen lösen und Verluste begrenzen.
* Rote Kerzen mit weniger langen Schatten indizieren einen starken Abwärtstrend - Trader in Short-Positionen bleiben mit diesen im Markt bis der Trend wechselt.

<figure><img src="https://docs.agenatrader.com/~gitbook/image?url=https%3A%2F%2F1347375179-files.gitbook.io%2F%7E%2Ffiles%2Fv0%2Fb%2Fgitbook-legacy-files%2Fo%2Fassets%252F-MKZSsJBtSP9L4sqIe_q%252F-MP9Hk_wuyGSOjwmX_ze%252F-MP9OOtOuMKdi9pY-F0L%252FHeik%2520Akashi.PNG%3Falt%3Dmedia%26token%3D70aa8c85-fdd8-4b1e-ae10-7c4f482c7058&#x26;width=768&#x26;dpr=4&#x26;quality=100&#x26;sign=7a54e650&#x26;sv=1" alt=""><figcaption></figcaption></figure>

Folgende Einstellungen können getätigt werden:

<figure><img src="https://docs.agenatrader.com/~gitbook/image?url=https%3A%2F%2F1347375179-files.gitbook.io%2F%7E%2Ffiles%2Fv0%2Fb%2Fgitbook-legacy-files%2Fo%2Fassets%252F-MKZSsJBtSP9L4sqIe_q%252F-MP9Hk_wuyGSOjwmX_ze%252F-MP9ORPmdJUcPOTYU9hU%252FHA%2520timeframe.PNG%3Falt%3Dmedia%26token%3D50b06c14-78de-4b78-b9ff-b4ec993d2970&#x26;width=768&#x26;dpr=4&#x26;quality=100&#x26;sign=67f3411d&#x26;sv=1" alt=""><figcaption></figcaption></figure>

### Volume <a href="#volume" id="volume"></a>

Beim Volumen-Kerzen-Chart wird eine neue Kerze dann gezeichnet, wenn ein bestimmter Wert an gehandeltem Volumen erreicht wurde. Mit einer Einstellung von z.B. 1.000.000 Volumen für Aktien, wir eine neue Kerze gezeichnet, sobald 1.000.000 Aktien gehandelt wurden. Kleine Kerzen weisen demnach auf hohe Volatilität und starke Bewegung hin, da das benötigte Volumen schnell erreicht wird und die nächste Kerze gezeichnet wird. Vice versa weist eine große Kerze auf niedrige Volatilität hin, da lange Zeit benötigt wird, um das benötigte Volumen für den Start der nächsten Kerze zu erreichen.

<figure><img src="https://docs.agenatrader.com/~gitbook/image?url=https%3A%2F%2F1347375179-files.gitbook.io%2F%7E%2Ffiles%2Fv0%2Fb%2Fgitbook-legacy-files%2Fo%2Fassets%252F-MKZSsJBtSP9L4sqIe_q%252F-MP9Hk_wuyGSOjwmX_ze%252F-MP9OTxf3AxaBmIQtRtF%252FVolume%2520chart.PNG%3Falt%3Dmedia%26token%3D93e02d8e-3940-4bec-95ad-895352d7a6d0&#x26;width=768&#x26;dpr=4&#x26;quality=100&#x26;sign=2b295cf9&#x26;sv=1" alt=""><figcaption></figcaption></figure>

Folgende Einstellungen können getätigt werden:

<figure><img src="https://docs.agenatrader.com/~gitbook/image?url=https%3A%2F%2F1347375179-files.gitbook.io%2F%7E%2Ffiles%2Fv0%2Fb%2Fgitbook-legacy-files%2Fo%2Fassets%252F-MKZSsJBtSP9L4sqIe_q%252F-MP9Hk_wuyGSOjwmX_ze%252F-MP9OZXLHAQm-kUZJ4eC%252FVOl%2520timeframe.PNG%3Falt%3Dmedia%26token%3D42e6e12f-dc42-489b-93f2-fd9abbd22bd4&#x26;width=768&#x26;dpr=4&#x26;quality=100&#x26;sign=2f746db4&#x26;sv=1" alt=""><figcaption></figcaption></figure>

### Range <a href="#range" id="range"></a>

Range-bars beachten nur den Preis, die Zeit-Komponente wird nicht berücksichtigt. Jeder Bar repräsentiert also eine festgelegte Veränderung des Preises. Während hoch volatiler Phasen werden mehr Kerzen gezeichnet als während niedriger Volatilität. Wieviele Kerzen in eine TradingSession gezeichnet werden, hängt auch vom betrachteten Instrument und von der eingestellten notwendigen Preisbewegung ab.

Drei Regeln der Range bars:

Jeder Range bar muss eine Hoch/Tief-Spanne besitzen, die exakt der eingestellten Preisbewegung entspricht Jeder Range bar muss außerhalb der Hoch/Tief-Spanne des vorangegangenen bars öffnen. Jeder Range bar muss an seinem Hoch oder Tief schließen.

**Mehr dazu finden Sie im** [**Investopedia**](http://www.investopedia.com/articles/trading/10/range-bar-charts-different-view.asp#ixzz4HUtd774Y%C2%A0) **(EN).**

<figure><img src="https://docs.agenatrader.com/~gitbook/image?url=https%3A%2F%2F1347375179-files.gitbook.io%2F%7E%2Ffiles%2Fv0%2Fb%2Fgitbook-legacy-files%2Fo%2Fassets%252F-MKZSsJBtSP9L4sqIe_q%252F-MP9Hk_wuyGSOjwmX_ze%252F-MP9ObCaBKxd9OC8BKuN%252FRange%2520chart.PNG%3Falt%3Dmedia%26token%3D74bd45ae-03f0-4bbe-9c81-864a5e93a3f2&#x26;width=768&#x26;dpr=4&#x26;quality=100&#x26;sign=64fc0c3&#x26;sv=1" alt=""><figcaption></figcaption></figure>

Bei Zeit basierten Charts wird nach einem bestimmten Zeitraum (z.B. 5 Minuten) eine neue Kerze gezeichnet.

Bei Range Charts wird immer dann eine neue Kerze gezeichnet wenn eine bestimmte Preisspanne (z.B. 30 Ticks/Points/Cents/Pips) zurückgelegt worden ist.

![](https://docs.agenatrader.com/~gitbook/image?url=https%3A%2F%2F1347375179-files.gitbook.io%2F%7E%2Ffiles%2Fv0%2Fb%2Fgitbook-legacy-files%2Fo%2Fassets%252F-MKZSsJBtSP9L4sqIe_q%252F-MP9P3vFZH_eTVbqUMdh%252F-MP9QTcSeCRqksFn3PC5%252Fchart_Range1.png%3Falt%3Dmedia%26token%3D56959e36-2f93-4974-9f39-8fa6aeb47fc9\&width=768\&dpr=4\&quality=100\&sign=4bfad5fd\&sv=1)

<figure><img src="/files/nvADOgdjHSCCqVr1IFeY" alt=""><figcaption></figcaption></figure>

Folgende Einstellungen können getätigt werden:

<figure><img src="https://docs.agenatrader.com/~gitbook/image?url=https%3A%2F%2F1347375179-files.gitbook.io%2F%7E%2Ffiles%2Fv0%2Fb%2Fgitbook-legacy-files%2Fo%2Fassets%252F-MKZSsJBtSP9L4sqIe_q%252F-MP9Hk_wuyGSOjwmX_ze%252F-MP9OdrkZXf7spr0pEkQ%252FRange%2520timeframe.PNG%3Falt%3Dmedia%26token%3D78039d52-353d-4535-a782-5197da2f7926&#x26;width=768&#x26;dpr=4&#x26;quality=100&#x26;sign=6527ab64&#x26;sv=1" alt=""><figcaption></figcaption></figure>

#### Nicht zeitbasierte Charts <a href="#nicht-zeitbasierte-charts" id="nicht-zeitbasierte-charts"></a>

*Vorteile:*

* Zeiträume mit wenig Aktivität werden komprimiert (weniger Kerzen)
* Zeiträume mit viel Aktivität werden ausgedehnt dargestellt (mehr Kerzen)
* Kursverlauf zeigt schönere Zyklen und ist "weicher"

*Nachteile:*

* Starke und schwache Marktphasen sind weniger gut ersichtlich, da es keine wirklich lange/kurze Kerzen gibt

**Wann gilt im Kerzenchart die Kerze als beendet?**

Sie haben unterschiedlichen Möglichkeiten, sich Charts anzeigen zu lassen. Es fängt bei 1 Minute an und ist individuell einzustellen. Vollständige Kerzen sind zu den jeweiligen Zeitangaben fertig gestellt. Es ist zu beachten, dass es unterschiedliche Börsenöffnungszeiten gibt. Die US-Börse öffnet um 15.30Uhr, d.h. die nächste Kerzeneinheit bei z.B. „1 Std. Chart“ ist mit 16.30Uhr beendet. Zur vollen Stunde (Bsp. 16.00Uhr) ist die Kerze nur zu Hälfte fertig bzw. berechnet.

Taipan startet seine Stundenkerze immer zu vollen Stunden Bsp. 8:00 Uhr. Wenn der Markt erst ab 8:30 Uhr öffnet, enhält die erste Stundenkerze nur eine halbe Stunden an Marktdaten.

#### **Können eigene Datenquellen (Tickdaten-Historien) importiert werden?** <a href="#konnen-eigene-datenquellen-tickdaten-historien-importiert-werden" id="konnen-eigene-datenquellen-tickdaten-historien-importiert-werden"></a>

Diese Möglichkeit bieten wir nicht an. Es wären tief gehende Kenntnisse in unserer Programmiersprache nötig und die Datenanbindungen sind meist sehr unterschiedlich. Dies hängt mit den verschiedenen Brokern zusammen. Wir raten daher davon dringend ab, selbst den Versuch zu unternehmen!

Die Funktion *Backtest* erlaubt einen Import von Tickdaten-Historien.

#### **Sommer- und Winterzeit** <a href="#sommer-und-winterzeit" id="sommer-und-winterzeit"></a>

Während der Umstellung von Sommer- auf Winterzeit sowie umgekehrt, kann es vorkommen, dass ihnen die jeweilige Stunde in der Kursanzeige fehlt. Wenn die Systemuhrzeit (inklusive Sommer- und Winterzeit Funktion) richtig eingestellt wurde, wird die Umstellung der Uhrzeit von AgenaTrader automatisch berücksichtigt. Prüfen Sie daher die Windows-Uhrzeit Einstellungen.

#### **Feiertage** <a href="#feiertage" id="feiertage"></a>

Feiertage werden von AgenaTrader nicht berücksichtigt. AgenaTrader berücksichtigt keine Feiertage und "meint" daher innerhalb normaler Handelszeiten zu arbeiten.

Außerhalb der Handelszeiten wird der Profit\&Loss (P\&L) vom Last-Preis berechnet, innerhalb der Handelszeiten vom „bid“ Preis. Dies könnte zu abweichenden Zahlen führen.


# Chart Tools

## Instrumente

*Öffnen sie den **Instrument-Editor** wie folgt:*

1. Ein Klick in das Instrument-Feld auf das Symbol ![](/files/L5zflUd5OaCKNxjJnziM)  in der Chart-Toolbar oder
2. Klicken Sie mit der rechten Maustaste in dem Chart und wählen Sie **Einstelleungen -> Instrument-Auswahl** aus.

Nachdem öffnet sich das [**Instrument-Editor** ](https://docs.agenatrader.com/v/german/menue-erklaerungen-and-inhalt/tool-menue/instrument-escort)-Fenster, in welchem das Symbol bereits vorausgewählt ist. Somit kann ein schneller Zugriff auf die Instrument-Definitionen gewährleistet werden, um z.B. bei einem Futures-Kontrakt den Ablauf-Monat zu verändern.

<figure><img src="/files/WMWqQh6GaWdadaWkX7MQ" alt=""><figcaption></figcaption></figure>

## Zeiteinheit

#### Zeiteinheit- und Intervall-Einstellungen im Chart <a href="#zeiteinheit-und-intervall-einstellungen-im-chart" id="zeiteinheit-und-intervall-einstellungen-im-chart"></a>

*Zum Öffnen der Zeiteinheiten haben Sie drei Möglichkeiten:*

1. Ein Klick auf das Symbol ![](/files/KNbUY3ruabmcDeNvYPnS) in der Chart-Toolbar oder
2. Klicken Sie mit der rechten Maustaste in den Chart und wählen Sie **Einstellungen -> Zeiteinheit** aus.
3. Klicken SIe ins Chart, drücken Sie dann die **Leertaste** und geben dann im offenem Dialogtyp das Intervall ein:

<figure><img src="/files/k4Vwf8DEEEze2sTlS2fp" alt=""><figcaption></figcaption></figure>

Hier kann man sich die voreingestellten Zeiteinheiten (Periodenart bzw. Intervall) über [Tools -> Allgemeine Einstellungen -> Generell -> ActionBar](https://docs.agenatrader.com/v/german/menue-erklaerungen-and-inhalt/hauptmenue/actionbar) selbst definieren bzw. abändern.

**Folgende Einstellungen können getroffen werden:**

* Seconds: x Sekunden pro Candle
* Minutes: x Minuten pro Candle
* Hours: x Stunden pro Candle
* Days: x Tage pro Candle
* Weeks: x Wochen pro Candle
* Months: x Monate pro Candle
* Ticks: x Ticks pro Candle (ein Tick steht für einen Trade)
* Volumes: x gehandelte Aktien/Kontrakte pro Candle
* Range: x Cents/Pips/Punkte/Ticks pro Candle (Preisspanne)

In diesem Fall steht x für das eingegebene Intervall.

<figure><img src="/files/RIzwg5DIALweWQOgSJLb" alt=""><figcaption></figcaption></figure>

Über **Custom Parameter** öffnet man den **Instrument-Dialog** über den man folgende Chart-Einstellungen tätigen kann:

* Instrument: Eingabe des Instrumenten-Symbols. Dafür kann man eine von den Methoden verwenden:
  * Das Instrument-Symbol manuell eingeben. bei der Eingabe wird geprüft, ob das Instrument im InstrumentManager registriert ist. Existiert keine Registratur wird die Eingabe automatisch gelöscht.
  * Mit einem Klick auf das ![Instr](https://docs.agenatrader.com/~gitbook/image?url=https%3A%2F%2F1347375179-files.gitbook.io%2F%7E%2Ffiles%2Fv0%2Fb%2Fgitbook-legacy-files%2Fo%2Fassets%252F-MKZSsJBtSP9L4sqIe_q%252F-MP9P3vFZH_eTVbqUMdh%252F-MP9POm3UlFx_libN7z-%252Finstr.png%3Falt%3Dmedia%26token%3D28e160d5-a371-4f3c-a508-8d9222889d07\&width=300\&dpr=4\&quality=100\&sign=b78a9dba\&sv=1) -Button kann der InstrumentManager geöffnet werden, woraus ein Instrument ausgewählt werden kann.
* Periodenart/Intervall: hier kann man die Zeiteinheit für den Chart definieren.
* PriceStyle: definiert den ChartType (candle chart, bar chart, line chart, usw.)
* Historie:
  * Über **Anzahl Kerzen** wird exakt diese Anzahl historischer Perioden im Chart angezeigt.
  * Bei **Zeitabstand** kann man sich mittels "Days back" bzw. dem "Von/Bis Datum" die Historie über eine Zeitspanne hinweg anzeigen lassen.
* Vorlage: hat man Chart-Vorlagen definiert und gespeichert, so kann man diese Vorlagen zum Aufbau des Charts verwenden. Wurde keine Vorlage ausgewählt, so wird die Default-Vorlage herangezogen.

<figure><img src="https://docs.agenatrader.com/~gitbook/image?url=https%3A%2F%2F1347375179-files.gitbook.io%2F%7E%2Ffiles%2Fv0%2Fb%2Fgitbook-legacy-files%2Fo%2Fassets%252F-MKZSsJBtSP9L4sqIe_q%252F-MP9P3vFZH_eTVbqUMdh%252F-MP9PROlEprZP8Z8ULB-%252Ftimeframe.PNG%3Falt%3Dmedia%26token%3D0b685848-bbf7-489e-a9ed-d7ef04826db1&#x26;width=768&#x26;dpr=4&#x26;quality=100&#x26;sign=4661b270&#x26;sv=1" alt=""><figcaption></figcaption></figure>

{% hint style="info" %}
Hinweis: Mit "Direkt" ist ein Chart gemeint, dessen Daten und Style 1:1 vom Datenfeed kommt. Im Gegensatz dazu ist mit "Verarbeitet" gemeint, dass zwar die Daten vom Datenfeed kommen, jedoch wird der spezifische Chartstyle vom AgenaTrader erstellt.
{% endhint %}

## <img src="/files/YEAxgcQEKNdF8ASjBSMv" alt="" data-size="line"> Zweite Datenserie

Diese Funktion erlaubt es, eine weitere Datenreihe innerhalb des gleichen Charts hinzuzufügen.

*Öffnen Sie die Multidata-Funktion wie folgt:*

Klicken Sie auf das Symbol <img src="/files/YEAxgcQEKNdF8ASjBSMv" alt="" data-size="line"> in der Chart-Toolbar oder.

Geben dann im offenem Dialogtyp das Symbol ein:

<figure><img src="/files/nQaiYltRbgqYGx2rotAE" alt=""><figcaption></figcaption></figure>

Die zweite Datenserie wird als Mountain Chart angezeigt.

<figure><img src="/files/dIigyJ3fZKt1rtfF0C29" alt=""><figcaption></figcaption></figure>

Im **Allgemeine Einstellungen ->** [**Chart**](https://docs.agenatrader.com/v/german/menue-erklaerungen-and-inhalt/tool-menue/konfigurations-escort#chart) Sie können den Ausgangspunkt der sekundären Datenreihen setzen

<figure><img src="/files/Q9BDfcxvryefQSKxHmoB" alt=""><figcaption></figcaption></figure>

* **First Requested:** Datum & Zeit, in der die Datenreihe hinzugefügt wurde.
* **First Visible:** Der erste Punkt auf der linken Chartseite, der sichtbar ist

Folgende Multidata-Einstellungen werden festgelegt:

| Symbol                                                              | Bedeutung                                                                                                                                                                                                                                                          |
| ------------------------------------------------------------------- | ------------------------------------------------------------------------------------------------------------------------------------------------------------------------------------------------------------------------------------------------------------------ |
| <img src="/files/RTfuDw5jcCq07bozgFSM" alt="" data-size="line">     | Multidata-Datenreihe ersetzt die Hauptdatenreihe (Alle aktuellen Einstellungen des Hauptcharts wurden nicht geändert)                                                                                                                                              |
| <img src="/files/SGLkOhpKAmBtA97qeToS" alt="" data-size="line">     | Hier können Sie die Anzeige der Multidata-Datenreihe umkehren.                                                                                                                                                                                                     |
| <img src="/files/t7twdR0gishPIOi7VJMb" alt="" data-size="line">     | Mit dieser Funktion können Sie Farb- und Linienbreite der Multidata-Datenreihe einstellen(Für weitere Details besuchen Sie bitte [Chart Toolbar: Farbe](https://docs.agenatrader.com/v/german/menue-erklaerungen-and-inhalt/hauptmenue/chart-toolbar/farbe) Seite) |
| <img src="/files/ClkJMSSV80XArSfPak4S" alt="" data-size="original"> | Multidata Datenreihe löschen                                                                                                                                                                                                                                       |

## <img src="/files/6XEYBX5rGntMNyVafEsE" alt="" data-size="line"> Zeichenwerkzeuge

*Öffnen Sie die Zeichenwerkzeuge-Liste wie folgt:*

1. Klicken Sie auf das Symbol <img src="/files/6XEYBX5rGntMNyVafEsE" alt="" data-size="line"> in der Chart-Toolbar oder
2. Klicken Sie mit der rechten Maustaste in den Chart und wählen Sie **Einstellungen -> Zeichenwerkzeuge** aus.

<figure><img src="/files/Dx2SUAcki7yHdvVrMRBn" alt=""><figcaption></figcaption></figure>

Um das Zeichenobjekt am Chart anzeigen zu lassen, befolgen Sie diese Schritte:

* Wählen Sie das Zeichenobjekt aus der Liste aus. Der Mauscursor wird sich zu einem Zeichenstift verändern.
* Klicken Sie im Chartbereich, wo Sie das Zeichenobjekt platzieren möchten.
* Mit linkem Maus-Klick und gedrückter Maustaste können Sie dieses Zeichenwerkzeug am Chart platzieren. Sobald Sie die Maus loslassen wird das Zeichenwerkzeug fixiert.
* Um das Zeichenobjekt zu löschen, wählen SIe es mit einem Linksklick an und drücken dann **DEL**.

Möchten Sie ein zweites Objekt desselben Typs zeichnen, so können Sie das in dem Sie einfach nochmals den linken Maus-Button drücken. Möchten Sie den Zeichenmodus beenden, so drücken Sie bitte **ESC** oder die rechte Maustaste.

Mit Doppelklick auf die nachfolgend beschriebenen Zeichenwerkzeuge öffnet sich der Parameter-Dialog, über den die unterschiedlichen Einstellungen der verschiedenen Zeichenwerkzeuge verwaltet werden können. Der Dialog öffnet sich immer mit den aktuellen Einstellungen des gerade ausgewählten Zeichenwerkzeugs. Ändert man Einstellungen, so werden diese Änderungen sofort übernommen d.h. man muss nicht nochmals einen **OK** oder **Bestätigen**-Button drücken.

<figure><img src="/files/eVFiwlOIlX0orogfWHld" alt=""><figcaption></figcaption></figure>

Sind am Chart mehrere Zeichenwerkzeuge offen, so muss man den Dialog nicht schließen um Einstellungen des anderen Zeichenwerkzeugs ändern zu können. Man klickt einfach auf das andere Zeichenwerkzeug und der Dialog passt sich sofort an. Ist z.B. das aktuelle Zeichenwerkzeug eine Trendlinie und man klickt auf ein Fibonacci-Retracement, so erscheint folgende Dialogdarstellung:

<figure><img src="/files/L62DouJF9b98R4cCoChD" alt=""><figcaption></figcaption></figure>

Über den Standard-Button (**Default**) werden die Standard-System Einstellung des Zeichenwerkzeugs hergestellt.

Wenn Sie unterschiedliche Darstellungen von den Zeichenwerkzeugen benötigen, so bietet AgenaTrader die Möglichkeit sich Zeichenwerkzeug-Vorlagen zu erstellen. Zuerst stellen Sie Ihre Einstellungen ein, danach tragen Sie in der DropDown-Box rechts unten den Namen der Vorlage ein und Bestätigen mit **ENTER** oder **"+"**.

<figure><img src="/files/RyckvBZlqn0BtY50kQ8w" alt=""><figcaption></figcaption></figure>

Dadurch wird in der Auswahl des Zeichenwerkzeugs ein Untermenü erstellt, in dem alle Zeichenwerkzeug-Vorlagen gelistet und auswählbar sind. Außerdem haben Sie die Möglichkeit, sich Zeichenwerkzeuge auf Tastenkombinationen zu legen. Lesen Sie dazu mehr im Kapitel: Tastenkombinationen. Der Linienwert kann im Pricemarker, nach einem „Linksklick“ mit der Maus, über die Tastatur exakt eingeben werden.

<figure><img src="/files/YRIln9cglrAAeXG18Xu0" alt=""><figcaption></figcaption></figure>

Alle Zeichenobjekte können mittels Strg-C / Strg-V kopiert und am selben Chart wieder eingefügt werden sowie mittels Strg-Entf vom Chart gelöscht werden (Die Indikatoren werde mit diesem Befehl nicht gelöscht).

#### Zeichnungen entfernen <a href="#zeichnungen_entfernen" id="zeichnungen_entfernen"></a>

<img src="/files/MGIzrQaAEaeczEvw8z0c" alt="" data-size="line"> **Objekt löschen**: Ausgewaehltes Zeichenobjekt entfernen&#x20;

<img src="/files/9rw9yOerrsArSMPbQ1Lo" alt="" data-size="line"> **All Ojekte entfernen**: Alle Zeichenobjekte entfernen.

<figure><img src="/files/eHVpspymBLjwUsm3eJ2G" alt=""><figcaption></figcaption></figure>

{% hint style="warning" %}
**Achtung​!** "Zeichenwerkzeuge bleiben im Chart erhalten und gespeichert, solange der Chart im Arbeitsplatz geöffnet bleibt. Nach Speichern des Arbeitsplatzes und beenden der Software bleiben die Zeichnungen ebenfalls erhalten. Wenn jedoch der Chart manuell geschlossen wird und damit aus dem Arbeitsplatz entfernt, führt das dazu, dass alle Zeichnungen gelöscht und nicht wiederhergestellt werden können."
{% endhint %}

#### Globale Zeichenobjekte <a href="#globale_zeichenobjekte" id="globale_zeichenobjekte"></a>

**"Globale Zeichenobjekte aktivieren" = Globale Ansicht für alle Zeichenobjekte auf allen Charts**:

<figure><img src="/files/iyFjUuTwRLevndG7SAIj" alt=""><figcaption></figcaption></figure>

Diese Option schaltet im Eigenschaften Dialog die Funktion **"Auf allen Charts zeigen"** frei. **"Auf allen Charts zeigen" = Globale Ansicht für ein einzelnes Zeichenobjekt**:

<figure><img src="/files/2uOmq98yuNBOGpnhi1fm" alt=""><figcaption></figcaption></figure>

Durch Doppelklick auf das Zeichenobjekt öffnet sich das Dialog-Fenster. Hier können Sie die Option **Auf allen Charts zeigen** selektieren, wodurch dieses einzelne Zeichenobjekt, auf allen Charts dieses Instruments, angezeigt wird.

**Workflow:** Für die allgemeine Einstellung öffnen Sie im ChartToolBar die Liste der Zeichenobjekte und wählen dann ganz unten "Globale Zeichnobjekte aktivieren" aus. Dies muss in jedem Chart des Instruments eigens aktiviert sein. Für die Einstellung spezifischer Zeichenobjekte gehen Sie dann folgendermaßen vor:

* Zeichnen Sie das Zeichenobjekt Ihrer Wahl ein
* Mit einem Links-Doppelklick darauf öffnen Sie das entsprechende Kontextmenü
* Klicken Sie "Auf allen Charts zeigen" an und schließen das Menüfenster.

**Umgekehrt gilt genauso:**&#x20;

Wenn Sie beispielsweise in einem Chart-Container 4 Charts offen haben (z.B. Minute, Stunde, Tag und Woche) und im TagesChart ein Zeichenobjekt platziert haben, dass Sie gerne auch in einem oder allen anderen Charts dieses Instruments sehen möchten, so müssen Sie im Kontextmenü des Zeichenobjekts "Auf allen Charts zeigen" aktivieren und dann - falls diese Funktion nicht aktiviert ist - in jedem weiteren Chart, in dem Sie das Zeichenobjekt sehen möchten, "Globale Zeichenobjekte aktivieren" anklicken.&#x20;

Ebenso können Sie das Zeichenobjekt - jedoch nur innerhalb des Arbeitsplatzes - in einen anderen Chart-Container übernehmen, z.B. in ein SingleChart desselben Instruments.

"Show Marker" = Wenn aktiviert, werden die Markierungen für die Anzeige von Zeichnungen angezeigt:

<figure><img src="/files/VtdwxGtdJkkQjO4KrGI7" alt=""><figcaption></figcaption></figure>

#### Zeichenobjekte im Indikator Panel <a href="#zeichenobjekte_im_indikator_panel" id="zeichenobjekte_im_indikator_panel"></a>

Sie können Zeichenobjekte im **Indikator-Panel** auf die gleiche Weise anwenden, wie Sie sie auf dem **Chart** zeichnen.

<figure><img src="/files/kDIulgf5bTbZof6E33tN" alt=""><figcaption></figcaption></figure>

{% hint style="info" %}
**Trendlinien, die in höheren Zeitrahmen erstellt und in niedrigeren Zeitrahmen betrachtet werden, werden oft falsch interpretiert.**

Das folgende Bild veranschaulicht, warum sich die Trendlinie unterscheiden kann.
{% endhint %}

<figure><img src="/files/shGtDK5Bw9rmVqK52kqI" alt=""><figcaption></figcaption></figure>

### ZeichenwerkzeugsTypen <a href="#zeichenwerkzeugstypen" id="zeichenwerkzeugstypen"></a>

In diesem Kapitel werden alle Zeichenwerkzeuge ausführlich beschrieben.

#### <img src="/files/hDKzGhlNxClk5J9Mi11b" alt="" data-size="line"> Text <a href="#text" id="text"></a>

Mit dem **Text Objekt** können beliebige Texte in den Chart eingefügt werden.

<figure><img src="/files/jRrbCmzHCgVk9te5Ma2q" alt=""><figcaption></figcaption></figure>

Es besteht auch die Möglichkeit mehrzeilige Textobjekte durch drücken von **Shift+Enter** zu erzeugen, und diese mit einem Doppelklick zu editieren.

<figure><img src="/files/6gI3KHqJzayriZxVi8fF" alt=""><figcaption></figcaption></figure>

#### <img src="/files/jmTYdRtHmFZEe8PCSeHP" alt="" data-size="line"> Line Shapes <a href="#line-shapes" id="line-shapes"></a>

AgenaTrader erlaubt es, die verschiedenen Linien am Chart zu zeichnen:

<figure><img src="/files/l2oFVTwExy1o8tlOQYQn" alt=""><figcaption></figcaption></figure>

#### <img src="/files/liApnO3R6LEoR7JWFm6t" alt="" data-size="line"> **Trendlinie** <a href="#trendlinie" id="trendlinie"></a>

Eine Methode, um eine Bewegung zu erfassen, ist der Einsatz von Trendlinien. Das Grundprinzip ist einfach. In einer Aufwärtsbewegung werden die Extrempunkte der Reaktionstiefs des Marktes miteinander verbunden und diese Linie bis an das Ende des Charts oder darüber hinaus verlängert. Anders verhält es sich bei einem Abwärtstrend. Hier werden die Extrempunkte der Reaktionshochs miteinander verbunden.

<figure><img src="/files/ZttcsbTkx0nxnSEAbdmm" alt=""><figcaption></figcaption></figure>

#### <img src="/files/s2A7Xfobkm5s63XFrIC8" alt="" data-size="line"> **Trendlinie Advanced** <a href="#trendlinie-advanced" id="trendlinie-advanced"></a>

Diese fortgeschrittene Version der Trendlinie ist magnetisch (bei entsprechender Einstellung - Doppelklick auf die Trendlinie und Aktivierung bzw. Deaktivierung der Funktionalität) und wird gleichzeitig unendlich in die Zukunft projiziert. Auf der Trendlinie sind zwei Punkte vorhanden mit denen der Anfangspunkt und der erste Auflagepunkt ausgewählt werden kann. Die Trendlinie wird dabei je nach Bewegung standardmäßig automatisch auf den nächstgelegenen Eröffnungs-, Schluss-, Hoch- oder Tiefkurs einer Kerze gelegt.

<figure><img src="/files/WV7845pd1F5YtXG9lgRz" alt=""><figcaption></figcaption></figure>

Möchte man diesen Automatismus nicht haben, kann man im Eigenschaften-Dialog (erscheint bei Doppelklick auf die Trendlinie), durch deselektieren der Funktion **Is Magnetized**, diese Funktion abschalten.

<figure><img src="/files/UCdjw1dcHrvxPl1BmrmC" alt=""><figcaption></figcaption></figure>

*Weitere Zeichenmöglichkeit:*

* Mit einem einfachen kurzen Klick auf den gewünschten Bereich, wird eine exakte horizontale Line gezeichnet.
* Standardmäßig wird die Linie nach Rechts gezeichnet, jedoch kann man nun diese im Eigenschaften Dialog nach Links ändern.

#### <img src="/files/H1ClGtQspYtmOqrRlhZh" alt="" data-size="line"> Geometrische Formen <a href="#geometrische-formen" id="geometrische-formen"></a>

Folgende geometrische Formen können gezeichnet werden:

<figure><img src="/files/JiJssTvKG0qBh3ccnu3R" alt=""><figcaption></figcaption></figure>

Einige Beispiele:

<figure><img src="/files/bBxqmOfD246xiaTxfFP1" alt=""><figcaption></figcaption></figure>

#### <img src="/files/RBH0SJaHMtw7dW1sEvgf" alt="" data-size="line"> Chart Markierungen <a href="#chart-markierungen" id="chart-markierungen"></a>

Folgende Chartmarkierungen können eingezeichnet werden:

<img src="/files/qxGVL4OO6HOluzfEJmYl" alt="" data-size="line"> Kreise

<img src="/files/tWIpf4T2z93S0QZNUs5G" alt="" data-size="line">Quadrate

<img src="/files/KfpZqVadMXCMeLnhXYTW" alt="" data-size="line"> Diamanten

<figure><img src="/files/00W1kUDSXlOsUQPpMkSY" alt=""><figcaption></figcaption></figure>

#### <img src="/files/Zv9BYw2kFLFhRm3YAlkn" alt="" data-size="line"> Fibonacci <a href="#fibonacci" id="fibonacci"></a>

Namensgeber ist der Mathematiker Leonardo Fibonacci, der die Zahlenreihe 0,1,1,2,3,5,8,13,21,34,55,89,144,233 usw. im 13. Jahrhundert entdeckte. Die nächstfolgende Zahl der Reihe ergibt sich durch die Addition ihrer beiden Vorgänger. Das Spannende an dieser Zahlenreihe ist, dass - wenn man eine Zahl durch die folgende Zahl dividiert - sich ein Wert nahe 0,618 ergibt. Dividiert man eine Zahl durch die übernächste Zahl erhält man ein Ergebnis von rund 0,382. Je höher die jeweiligen Zahlen dabei sind, desto näher liegen die Ergebnisse an den idealtypischen Werten von 0,382 und 0,618. Weitere Fibonacci-Verhältnisse werden z.B. an den Werten von 0,236; 0,5; 0,764; 1,382; 1,618 usw. festgemacht.

Im Rahmen der Technischen Analyse wird nun unterstellt, dass Korrekturen häufig an solchen Fibonacci-Marken enden und der Markt dort zu drehen beginnt. Kommt es also nach einem Aufwärtsimpuls eines Wertpapiers oder generell eines Basiswerts zu einer Korrektur, so wird zur Ermittlung der Fibonacci-Retracements zunächst die vorangegangene Trendbewegung gemessen. Das Ergebnis wird anschließend mit um 38,2% bzw. 50% bzw. 61,8% der zuvor ermittelten Länge korrigiert. Auf diese Weise ergeben sich die Werte für die entsprechenden Fibonacci-Retracements. Fallen solche Fibonacci-Levels mit anderen charttechnischen Unterstützungen zusammen, so erhöht dies deren Aussagekraft enorm.

<img src="/files/tDsDx2ptJxFZ32FrBoHE" alt="" data-size="line">Timezones und <img src="/files/oLu5XAAkxcLPPnhIn4q6" alt="" data-size="line">Retracements

<figure><img src="/files/JLhDSixFVWdyFeczTotS" alt=""><figcaption></figcaption></figure>

<img src="/files/evK8vEZ9FNclfyXsveOs" alt="" data-size="line"> Fächer und <img src="/files/mZqrZ9fKlRZzZsjffHO5" alt="" data-size="line"> Bögen

<figure><img src="/files/zLfwIQBqRBHLYtt5tV5t" alt=""><figcaption></figcaption></figure>

<img src="/files/9f49ZcoYBqYfkb7WaEuv" alt="" data-size="line"> Projektionen

Anwendungsinformation: Beim Erstellen dieser **Projektion** müssen Sie anfangs die linke Maustaste gedrückt halten, bis zum zweiten Punkt navigieren und die Maustaste dort loslassen. Den letzten Punkt können Sie dann einfach mit einem weitern Klick der linken Maustaste fertigstellen. Wenn Sie die Maustaste anfangs nicht gedrückt halten, wird die Projektion nicht richtig angezeigt.

<figure><img src="/files/w6TUeQQlzA8GnLyHV0I3" alt=""><figcaption></figcaption></figure>

**Erweiterter Dialog** Allen Fibonacci-Objekten steht ein erweiterter Dialog zur Verfügung in dem die Fibonacci-Levels, die Farben für die unterschiedlichen Linien, und welche Fibo-Levels man angezeigt bekommen möchte, einstellen kann:

<figure><img src="/files/ZiomMl4cFzVOYJP0xp4B" alt=""><figcaption></figcaption></figure>

Hier gibt es folgende Möglichkeiten:

| Funktion            | Bedeutung                                                                                                                 |
| ------------------- | ------------------------------------------------------------------------------------------------------------------------- |
| Right Aligned       | Hier kann man einstellen, ob man die gezeichneten Levels, nach Rechts erweitert, angezeigt bekommen möchte.               |
| Is Magnetized       | Hier kann man selektieren, ob beim Einzeichnen der Levels, AT die Auswahl der Zeichenpunkte "magnetisierend" unterstützt. |
| Display Percents    | Zeigt die Prozente an                                                                                                     |
| Display Price       | Zeigt den Preis an                                                                                                        |
| Extend Left         | Erweitert die Linien nach links                                                                                           |
| Extend Right        | Erweitert die Linien nach rechts                                                                                          |
| Display Anchor Line | Zeigt die Ankerlinie                                                                                                      |
| Lock                | Sperrt die weitere Bearbeitung                                                                                            |
| Auto Scale          | Autoskaliert die Ansicht                                                                                                  |
| Show On All Charts  | Zeigt die Fibonacci-Objekt auf allen Charts an                                                                            |

**Löschen ganzer Objekte oder einzelner Levels** Nachdem ein Objekt erstellt wurde, kann es per Mausklick ausgewählt werden und mit der Taste "Entf" (Tastatur) entfert werden. Sie können auch einzelne Levels der Objekte löschen, indem Sie die Umschalt (Shift) Taste (Tastatur) gerückt halten und die Levels mit der linken Maustaste anklicken.

{% hint style="warning" %}
**Achtung!** AgenaTrader behalt die Einstellungen des letzten Objekts, daher wird ein neues Objekt in derselben Weise dargstellt. Dh. die gelöschten Levels werden beim Erneuten Zeichnen nicht mit eingezeichnet. Um die Levels wieder zu aktivieren, müssen per Doppelklick auf das Objekt die Einstellungen im Popup editiert werden.
{% endhint %}

<figure><img src="/files/gSU0epVbKLpJRLBRvr31" alt=""><figcaption></figcaption></figure>

#### <img src="/files/4CzlxNtdL9KrJxW0CKOe" alt="" data-size="line"> Speed Linie <a href="#speed-linie" id="speed-linie"></a>

Speed Resistance Linien dienen dazu potentielle Unterstützungs- und Widerstandsbereiche zu finden. Das Tool wurde von Edson Gould entwickelt und ist ähnlich dem Gann Fan oder dem Fibonacci Fan. Die Speed Lines bestehen aus drei Trendlinien, wobei die erste Linie von einem Tiefpunkt zu einem Hochpunkt (Aufwärtstrend) oder von einem Hochpunkt zu einem Tiefpunkt (Abwärtstrend) gezogen wird. Die beiden anderen Linien sind Unterstützungs- bzw. Widerstandslinien und werden darunter (Aufwärtstrend) bzw. darüber (Abwärtstrend) beim 1/3 und beim 2/3 Retracement gezeichnet.

<figure><img src="/files/230FYgoqH43K0gS7wEZO" alt=""><figcaption></figcaption></figure>

#### <img src="/files/wyjO7leLedrOFrrOMpw6" alt="" data-size="line"> Gann Fächer rauf / Gann Fächer runter <a href="#gann-facher-rauf-gann-facher-runter" id="gann-facher-rauf-gann-facher-runter"></a>

Ein Gann Fan ist ein analytisches Tool aus der technischen Analyse, eine Technik aus der Derivatewelt und von dem Börsenprofi und Aktienbroker W\.D. Gann erfunden. Der Gann Fan indiziert Zeit- und Preisbewegungen, die ihren Ursprungspunkt von wichtigen Hochs oder Tiefs haben und kann so helfen mögliche Ausbruch- bzw. Einbruchsszenarien zu erkennen. Die jeweiligen Linien kommen gestreut (bildlich wie Luft bei einem Fön) vom jeweiligen Ursprungspunkt (einem Hoch oder Tief). Diese Linien des Gann Fans werden dabei durch die verschiedenen Winkel gebildet, die alle von einem besonderen, charttechnisch bedeutsamen Ursprungspunkt ihren Ausgang finden. Die Trendlinie (1x1 = 45°) wird von Gann am wichtigsten eingestuft. Liegt der Kurs über der Trendlinie, so indiziert das Chartbild einen Bullenmarkt. Liegt der Kurs unter der Trendlinie (45° Linie) so indiziert das Chartbild einen Bärenmarkt. Gann interpretierte die 1x1-Linie (45°) als eine starke Unterstützungs- bzw. Widerstandslinie (je nach Marktrichtung zu betrachten), verwies aber auch auf die weiteren Winkel.

*Diverse Gann-Winkel:* 1x8 - 82.5 Grad 1x4 - 75 Grad 1x3 - 71.25 Grad 1x2 - 63.75 Grad 1x1 - 45 Grad 2x1 - 26.25 Grad 3x1 - 18.75 Grad 4x1 - 15 Grad 8x1 - 7.5 Grad

Die Gann Fans benutzen diese genauen geometrischen Muster zur Vorhersage von Kursbewegungen. Bei Gann-Linien werden die oben ausgewiesenen 9 Widerstandslinien in regelmäßigen Abständen in den Chart eingezeichnet.

<figure><img src="/files/dcVkRCO7Mcl3m6YqLkAS" alt=""><figcaption></figcaption></figure>

#### <img src="/files/dWTeYRid9IuHRrpTJnVN" alt="" data-size="line"> Andrew's Pitchfork <a href="#andrews-pitchfork" id="andrews-pitchfork"></a>

Andrew´s Pitchfork eignet sich bedingt als Trendlinien-Indikator. Man könnte diesen Indikator im direkten Vergleich mit anderen Indikatoren als einen sekundären Indikator bezeichnen. Ganz einfach, weil er auch nicht so alltäglich in der Charttechnik verwendet wird. In der täglichen Arbeit der technischen Analyse sind einfache Trendlinien, Trendkanäle und andere Modelle in der Verwendung höher angesiedelt. Dennoch kann Andrew´s Pitchfork unterstützend hinzugezogen werden, um die bereits komplett angefertigte Analyse nochmals mit einem weiteren Indikator zu prüfen und zu untermauern. Andrew´s Pitchfork ist eine Studie über Trendlinien, die von Dr. Alan Andrews vor Jahrzehnten entwickelt wurde. Andrew´s Pitchfork besteht aus drei parallelen Trendlinien, die in ein Chartbild gezeichnet werden. Die Zusammensetzung der Linien, Ihr Bild ähnelt einer "pitchfork" (Mistgabel/Heugabel), sind der Grund für die Namensgebung. Die obere und untere Linie machen Raum für die Unterstützungszone und für die Widerstandszone.

<figure><img src="/files/5y8Adq2jdn69q3xxakde" alt=""><figcaption></figcaption></figure>

Der Indikator ist für alle Zeitintervalle nutzbar. Ein Aufwärtstrend wird durch das Aufsetzen und Abprallen von der Unterstützungslinie verdeutlicht. Ein Abwärtstrend durch das Abprallen an der Widerstandslinie. Wie bei ähnlichen Indikatoren ermöglicht es dieser Indikator an den besagten Schlüsselstellen die jeweiligen Positionen im Markt einzunehmen. Swing-Modus-Anhänger perfektionieren Andrew´s-Pitchfork weiter, indem sie weitere Parallellinien zwischen den jeweiligen Unterstützungs- und Widerstandslinien einziehen, um dann die jeweiligen Zwischenlinien als weitere Indikatoren zu nutzen. Sie beziehen dann immer, wenn der Kurs die jeweilige Linie berührt (je nachdem von oben oder von unten) Position im Markt.

#### <img src="/files/RVGa7FRg1dmkI17gXomi" alt="" data-size="line"> Tirone Levels <a href="#tirone-levels" id="tirone-levels"></a>

Tirone Levels (entwickelt von John Tirone) sind drei horizontale Linien, welche z.B. wie Fibonacci Levels oder Quadrant Lines als Unterstützung/Widerstand dienen können. Die Berechnung basiert auf dem tiefsten Tief und dem höchsten Hoch eines bestimmten Zeitraums:

* Die mittlere Linie wird berechnet, indem man die Differenz zwischen dem Hochpunkt und dem Tiefpunkt kalkuliert und durch 2 dividiert.
* Die obere Linie wird beim 1/3 Level zwischen Hoch- und Tiefpunkt gezeichnet
* Die untere Linie wird beim 2/3 Level zwischen Hoch- und Tiefpunkt gezeichnet.

<figure><img src="/files/8PCspNklxOu4XhCWrTeX" alt=""><figcaption></figcaption></figure>

#### <img src="/files/zDueSUH0VRJGoAXzMkvm" alt="" data-size="line"> Quadrant Linien <a href="#quadrant-linien" id="quadrant-linien"></a>

Quadrant Linien teilen einen Preisbereich in vier gleich große Bereiche. Es werden fünf Linien und vier Quadranten auf den Chart gezeichnet:

* Die obere Linie definiert den Hochpunkt
* Die untere Linie definiert den Tiefpunkt
* Die mittlere Linie markiert das 50 % Level der Preisspanne.
* Die anderen zwei Linien werden aus den forgegangenen Linieniveaus und der Quadrant-Größe berechnet.

Quadrant Linien werden nicht als typischer Indikator gesehen, sondern als ein Maßstab für die Price Action. Die Linien erlauben technischen Analysten visuell Preislevels relativ zu einer ausgewählten Preisspanne zu quantifizieren.

<figure><img src="/files/rKuGDwujjr3zlbhzqvd4" alt=""><figcaption></figcaption></figure>

#### <img src="/files/Xb9G5LlNf4vAb5rIE3ry" alt="" data-size="line"> Raff Regression Kanal <a href="#raff-regression-kanal" id="raff-regression-kanal"></a>

Der Raff Regression Kanal ist eine lineare Regression-Methode, die sich auf der bestmöglichen Anpassung einer Linie zu der Preisreihe basiert (diese wird mit einer OLS (ordinal least squares) Methode berechnet). Die lineare Regressionslinie verläuft genau in der Mitte des fallenden Trendkanals (Mittellinie). An der größten Abweichung von der Mittellinie wird entweder die obere bzw. die untere Trendkanallinie eingezogen. Mit demselben Abstand wird die entgegengesetzte Linie eingezeichnet.

Bei der Erstellung eines Regressionskanals wird folgendermaßen vorgegangen:

* Im ersten Schritt wird aus allen Schlusskursen eine Gerade berechnet (nach der Formel der kleinsten Quadrate), die so durch die Schlusskurspunkte verläuft, dass die Kurse im rechnerischen Durchschnitt so nah wie möglich an dieser Linie liegen.
* Dann wird die erste Trendline als Parallelverschiebung an das erste High oder Low geführt.
* Im nächsten Schritt wird mit derselben Distanz die zweite Trendkanallinie auf der anderen Seite der Regressionslinie eingezeichnet.

<figure><img src="/files/uM1Farg1Eb46YCZzmWYH" alt=""><figcaption></figcaption></figure>

Jetzt ist der Trendkanal mit 3 Linien komplett und rechnerisch sehr viel exakter als ein per Hand eingezeichneter Trendkanal.

#### <img src="/files/bX8iSMCU3g2HdQYAeGrm" alt="" data-size="line"> Trendkanal <a href="#trendkanal" id="trendkanal"></a>

Der Trendkanal kann per Hand gezeichnet werden. Man setzt an einem Tiefpunkt oder Hochpunkt im Chart an und verbindet diesen mit anderen Tiefpunkten bzw. Hochpunkten. Die gegenüberliegende Linie wird dementsprechend angepasst.

<figure><img src="/files/yMZE56ffLOtUZixg37Pv" alt=""><figcaption></figcaption></figure>

#### <img src="/files/gW1X7Y8W2cRtW7OxKMSY" alt="" data-size="line"> Free Hand Drawing <a href="#free-hand-drawing" id="free-hand-drawing"></a>

Mit dem **Free Hand Drawing** kann man diverse Markierungen, Notizen, etc. am Chart machen.

<figure><img src="/files/hSepGKJYBnru20QCiKDb" alt=""><figcaption></figcaption></figure>

#### <img src="/files/2vnisTOQfYI2mnkTFdU7" alt="" data-size="line"> Chart Distanzmesser <a href="#chart-distanzmesser" id="chart-distanzmesser"></a>

Mit dem **Chart Distanzmesser** kann man sich den Abstand vom Preis, Bars & Prozent anzeigen lassen.

<figure><img src="/files/lUe8yKm8wfDxW8gtzWmw" alt=""><figcaption></figcaption></figure>

## <img src="/files/J9Rb3TVuOPAgC2RBXmg2" alt="" data-size="line"> Indikatoren

Dieses Kapitel beschreibt, wie man verschiedene Indikatoren erstellen, bearbeiten und am Chart anzeigen lassen kann. Eine ausführliche Beschreibung der Indikatoren finden Sie auf unserer [Github Indikatoren Hilfe](https://indicators.agenatrader.com/)

*Indikatoren können dem Chart folgendermaßen zugewiesen werden:*

1. Ein Klick auf das Symbol <img src="/files/J9Rb3TVuOPAgC2RBXmg2" alt="" data-size="line"> in der Chart-Toolbar oder
2. Klicken Sie mit der rechten Maustaste im Chart und wählen Sie **Einstellungen -> Indikatoren** aus.

Danach öffnet sich das Popup, das in 5 Bereiche gegliedert ist:

<figure><img src="/files/CxOBnZ1pS0mEqYnzh3fd" alt=""><figcaption></figcaption></figure>

| Name                                                                                                                 | Beschreibung                                      |
| -------------------------------------------------------------------------------------------------------------------- | ------------------------------------------------- |
| Indicators                                                                                                           | Standard-Indikatoren von AgenaTrader              |
| Premium indicators                                                                                                   | Indikatoren aus der Add-On Paketen                |
| [Custom](/german/pakete/agenascript-anwendung-von-addon-und-package-indikatoren-in-selbstprogrammierten-komponenten) | Selbst programmierte oder importierte Indikatoren |
| [Conditions](/german/erstellen-sie-ihre-eigene-handelsstrategie/signal-builder)                                      | Mit dem Signal Builder erstellte Bedingungen      |
| [Scripted conditions](/german/erstellen-sie-ihre-eigene-handelsstrategie/programmierung)                             | Selbst programmierte Bedingungen                  |

{% hint style="info" %}
**Wichtig!** Wenn Sie mehr über die Indikatoren wissen möchten, dann gibt es eine ausführliche Beschreibung [hier](https://agenatrader.github.io/AgenaIndicator-documentation-de)
{% endhint %}

#### **Das Dialogfenster besteht aus drei Bereichen:**

* Liste der verfügbaren Indikatoren
* Liste der ausgewählten Indikatoren
* Parameterfeld

Button-Funktionen:

* Über den **OK**-Button übernimmt man alle getätigten Einstellungen und schließt den Dialog.
* **Übernehmen**: übernimmt alle Einstellungen, der Dialog wird jedoch nicht geschlossen.
* **Abbrechen**: schließt den Dialog. Alle Veränderungen werden verworfen.

Hinweis:

<figure><img src="/files/epmIwtRcKZOAcY7dPoEW" alt=""><figcaption></figcaption></figure>

Show Candles At Front: wenn diese Funktion aktiviert ist, werden alle Indikatoren hinter den Kerzen oder anderen Charttypen angezeigt.

### Indikator-Auswahlliste <a href="#list_of_available_indicators" id="list_of_available_indicators"></a>

Die Indikator-Auswahlliste befindet sich an der linken Seite des **Indikatoren-Fenster**s.

Für eine schnellere Handhabung können Sie die Indikator-Suchfunktion nutzen. Sie können Indikatoren in Unterkategorien durchsuchen:

<figure><img src="/files/Lsq73PCsFG8QqqRtviKk" alt=""><figcaption></figcaption></figure>

*Diese Liste ist unterteilt in die folgenden Kategorien:*

* **Die Standard-Systemindikatoren** (AgenaTrader bietet knapp 100 Standard-Indikatoren an),

**Kumulative Indizes.** Wird im Indikatorenfenster nur angezeigt, wenn Sie mit einem der folgenden Datenfeeds verbunden sind: Taipna, Teletrader, Barchart, IQFeed. Sie zeigen einen Oszillator von kumulierten Daten des spezifischen Index an.

<figure><img src="/files/g4od14FMZicDqbMpZ8Ty" alt=""><figcaption></figcaption></figure>

* **Premium Indikatoren**
* **Scripted Indikatoren** (selbst programmierte Indikatoren),
* **Conditions im Condition-Builder**
* **Scripted Conditions** (selbst programmierte Conditions).

<figure><img src="/files/mz9UXfWGd3vf54RJf98l" alt=""><figcaption></figcaption></figure>

Ein Doppelklick auf einen ausgewählten Indikator fügt diesen zur Indikatorenliste hinzu.

### Indikator-Liste <a href="#list_of_selected_indicators" id="list_of_selected_indicators"></a>

In der Indikatorliste befinden sich alle Indikatoren und Conditions wieder, die sich auch am Chart befinden bzw. gerade aus der Auswahl-Liste übernommen worden sind.

<figure><img src="/files/LCvKdwQdACdKlbaGCW32" alt=""><figcaption></figcaption></figure>

Über den **Löschen**-Button können die Indikatoren aus dieser Liste entfernt werden. Wählt man einen Eintrag in dieser Liste aus, so werden die Einstellungen in der Parameter-Box angezeigt und können dort auch verändert werden. Mit **Übernehmen** bzw. **OK** werden die Indikatoren und deren Einstellungen in den Chart übernommen.

### Indikator-ParameterBox <a href="#parameters_box" id="parameters_box"></a>

In der Parameter-Box können die Basiseinstellungen der Indikatoren eingegeben bzw. verändert werden. Ebenso können darin Darstellungs- und Schwellwerteinstellungen vorgenommen werden.​

<figure><img src="/files/WHvMmzWl9ENo7BoZbogp" alt=""><figcaption></figcaption></figure>

In diesem Kapitel beschreiben wir wichtige Attribute der Indikatoren.

#### Allgemeine Einstellungen <a href="#general-settings" id="general-settings"></a>

Hierbei handelt es sich um generelle Einstellungen wie:

* **Autoskalierung:** dieses Attribut ist wichtig für Indikatoren, die direkt im Chart und nicht in einer separaten Panel unter dem Chart angezeigt werden. Der Standardwert für "Auto scale" ist 'False'. Wird "Auto scale" auf 'True' gesetzt, so wird dieser Indikator immer vollständig im Chart angezeigt. D.h. sollten Extrempunkte des Indikators weit vom Markt entfernt sein, so wird die Ansicht des ausgewählten 'Price Styles' z.B. den Kerzen so angepasst, dass der Indikator voll angezeigt werden kann.<br>

  <figure><img src="/files/z4dG85hGvwarCRKxp3Q6" alt=""><figcaption></figcaption></figure>
* **Auf Bar Close berechnen:** Bei der Einstellung auf „true“, berechnet AgenaTrader den indikatoren jedes Mal eine Bar geschlossen und die nächste Zecke wird gesendet. Wenn "False" eingestellt ist, dann erscheint der **Calculation Updates Time Frame** Parameter, welcher es ermöglicht, einen Zeitraum auszuwählen, in dem der Indikator neu berechnet wird."

{% hint style="warning" %}
**ACHTUNG!** Die Berechnung der Indikatoren kann teils recht aufwendig sein - speziell im Falle selbst programmierter Indikatoren. Befinden sich im gesamten Arbeitsbereich zu viele Indikatoren mit **Auf Bar Close berechnen** = false, so kann das die Performance von AgenaTrader beeinflussen.
{% endhint %}

* **Beschriftung:** dabei handelt es sich um die Bezeichnung des Indikators. Hier wird standardmäßig die technische Bezeichnung des Indikators angezeigt. Möchte man jedoch auf den Charts einen anderen - vielleicht verkürzten - Namen sehen, so kann man diesen Parameter abändern (z. B. BBWidth(Close, 2, 20) -> BB-W)
* **Im Data Box anzeigen:** dieser Parameter (True) veranlasst, dass die Ausgabewerte des Indikators beim Klick des linken Maus-Buttons auf dem Chart angezeigt werden.\ <br>

  <figure><img src="/files/Pdz6WugsUlCQbXKnTGpW" alt=""><figcaption></figcaption></figure>
* **Verschiebung:** mit dieser Einstellung können Sie den Indikator nach Rechts bzw. Links verschieben.
* **Bars benötigt:** dabei handelt es sich um die Anzahl Perioden, ab welcher der Indikator gezeichnet werden kann. D.h ein SMA(20) braucht zumindest 20 Perioden der Zeiteinheit um den Gleitenden Durchschnitt richtig berechnen zu können.
* **Preismarker:** damit wird gesteuert, ob in der Preis-Skala auf der rechten Seite des Charts die Ausgabewerte der Indikatoren farblich angezeigt werden.\ <br>

  <figure><img src="/files/erc3ciQUJuQrC77RlZRc" alt=""><figcaption></figcaption></figure>

#### Input-Einstellungen <a href="#input-settings" id="input-settings"></a>

Hier bekommen Sie die Möglichkeit für diverse zusätzlichen Input wie:

* **Eingabe Serie** Dabei handelt es sich um die Datenserie, zu welcher dieser Indikator berechnet werden soll. Der Standardwert ist Close d.h. der Indikator wird aufgrund der Schlusskurse der jeweiligen Perioden errechnet. Es gibt folgende Auswahlmöglichkeiten:\
  \
  ![](/files/MAzEKj1hZa7PMTB2QDd1)

Dadurch kann man sich z.B.: ein Bollinger-Band mit den Input-Werten des RSI anzeigen lassen:

<figure><img src="/files/wfkWeBLJjxMqCbVB8aL4" alt=""><figcaption></figcaption></figure>

Nachdem man diese Einstellung vorgenommen hat, kann man einen zusätzlichen RSI-Indiaktor im gleichen Panel wie das Bollinger-Band anzeigen lassen:\ <br>

<figure><img src="/files/UxAEZXgcXBHgLknTNCxH" alt=""><figcaption></figcaption></figure>

* **Instrument:** dabei können Sie von einem anderen Instrument die Datenserie, zu welcher dieser Indikator berechnet werden soll, auswählen. Der Standardwert ist das Instrument in welchen Sie den Indikator ausgewählt haben.
* **Zeiteinheit** Sie haben nun die Möglichkeit sich den Indikator aus einer anderen Zeiteinheit in Ihrem aktuellen Instrument anzeigen zu lassen. Als Beispiel zeigen wir Ihnen das Tages-Chart des EURUSD mit dem Indikator SMA(14) auf 1 Stunden- & 1 Wochen Basis:\ <br>

  <figure><img src="/files/3ErBAAPnOb3vxuXd8wae" alt=""><figcaption></figcaption></figure>

#### Input-Parameters Einstellungen <a href="#parameters-settings" id="parameters-settings"></a>

In dieser Sektion können die indikatorenspezifischen Parameter eingegeben werden. Verändert man diese Werte, so verändert sich auch das Verhalten des Indikators.

<figure><img src="/files/OKqVUCT4lVgvSyTexswU" alt=""><figcaption></figcaption></figure>

#### Visuale Einstellungen <a href="#visual-settings" id="visual-settings"></a>

Darüber wird die visuelle Darstellung des Indikators gesteuert:

* **Linien:** verfügt der Indikator über Schwellwert-Linien, so kann man hierüber die Einstellungen für diese Linien tätigen. Folgende Werte können verändert werden:
  * Aussehen der Linie (gepunktet, strichliert,..)
  * Farbe
  * Breite der Linie
  * Wert der Linie

<figure><img src="/files/L3tvKcx7zlTg8ZNujHS9" alt=""><figcaption></figcaption></figure>

* **Feld:** hier kann man auswählen, ob der Indikator im Chart oder in einem separaten Bereich angezeigt werden soll.

<figure><img src="/files/euxzCWyYzlaCNzanJA1W" alt=""><figcaption></figcaption></figure>

Über die Auswahl wird es auch ermöglicht zwei Indikatoren in einem Indikatoren-Bereich (Panel) anzuzeigen. Dadurch kann man sich z.B.: den RSI im gleichen Panel wie das Bollinger-Band anzeigen lassen.

* **Ausgaben:** Hierbei handelt es sich um die visuelle Darstellung der Ausgabewerte. Es können folgende Werte eingegeben werden:
  * Bezeichnung
  * Aussehen der Linie (gepunktet, strichliert,..)
  * Farbe
  * Breite der Linie

<figure><img src="/files/7VOfGyIWASq2MqvEh4jt" alt=""><figcaption></figcaption></figure>

#### Visualization-Einstellungen <a href="#visualization-einstellungen" id="visualization-einstellungen"></a>

Hier können Sie z.B. beim Bollingerband die Zwischenräume zwischen den Bändern farbig gestalten.

<figure><img src="/files/CdhbCXTDtc7NiEw011NH" alt=""><figcaption></figcaption></figure>

#### Outputs Display Style <a href="#outputs-display-style" id="outputs-display-style"></a>

Hier können Sie zwischen 3 verschiedenen Ausgabemöglichkeiten wählen:

<figure><img src="/files/00dzEekhEFnFastUhwx9" alt=""><figcaption></figcaption></figure>

## <img src="/files/Ex9ui3C1E8qoPZqVjBko" alt="" data-size="line"> Strategien

*Selbst programmierte bzw. 3rd-Party Strategien können dem Chart folgendermaßen zugewiesen werden:*

1. Ein Klick auf das Symbol <img src="/files/Ex9ui3C1E8qoPZqVjBko" alt="" data-size="line"> in der Chart-Toolbar oder
2. Klicken Sie mit der rechten Maustaste in den Chart und wählen Sie **Einstellungen -> Strategien** aus.

Danach öffnet sich der Strategien-Dialog:

<figure><img src="https://docs.agenatrader.com/~gitbook/image?url=https%3A%2F%2F1347375179-files.gitbook.io%2F%7E%2Ffiles%2Fv0%2Fb%2Fgitbook-legacy-files%2Fo%2Fassets%252F-MKZSsJBtSP9L4sqIe_q%252F-MP9UgwSdi0YqVlTnGRX%252F-MP9WC8naSJUU007L4UN%252FStrategies.png%3Falt%3Dmedia%26token%3D5e60eb31-1bb0-4e86-a554-f9e866a53d82&#x26;width=768&#x26;dpr=4&#x26;quality=100&#x26;sign=438e60dc&#x26;sv=1" alt=""><figcaption></figcaption></figure>

Der Dialog besteht aus drei Teilen:

1. Strategie-Auswahlliste
2. Strategie-Liste
3. Strategie-ParameterBox

Button-Funktionen:

* Über den **OK**-Button übernimmt man alle getätigten Einstellungen und schließt den Dialog.
* **Übernehmen**: übernimmt alle Einstellungen, der Dialog wird jedoch nicht geschlossen.
* **Abbrechen**: schließt den Dialog. Alle Veränderungen werden verworfen.

Strategien können grundsätzlich wie folgt gestartet werden:

* aus dem Chart,
* aus der Watchliste (Scanner),
* aus der ListChartGruppe und
* aus dem StrategieEscort selbst.

### Strategie-Auswahlliste <a href="#strategie-auswahlliste" id="strategie-auswahlliste"></a>

Die Srategie-Auswahlliste befindet sich an der linken Seite des **Strategie-Fenster**s. Für eine schnellere Handhabung können Sie die Srategie-Suchfunktion nutzen.

Mittels Doppelklick bzw. dem **Neu**-Button wird die Strategie in die Strategie-Liste übernommen.

**Im Moment kann nur eine Strategie pro Chart verarbeitet werden.**

<figure><img src="https://docs.agenatrader.com/~gitbook/image?url=https%3A%2F%2F1347375179-files.gitbook.io%2F%7E%2Ffiles%2Fv0%2Fb%2Fgitbook-legacy-files%2Fo%2Fassets%252F-MKZSsJBtSP9L4sqIe_q%252F-MP9UgwSdi0YqVlTnGRX%252F-MP9WN7nWxXo6hEpCfgm%252FStrategies%2520%281%29.png%3Falt%3Dmedia%26token%3D05abdce3-eebb-485e-b8a2-88be887d9d83&#x26;width=768&#x26;dpr=4&#x26;quality=100&#x26;sign=5af4241a&#x26;sv=1" alt=""><figcaption></figcaption></figure>

#### Strategie-Liste <a href="#strategie-liste" id="strategie-liste"></a>

In der Strategie-Liste kann sich eine Strategie befinden, die z.b. gerade am Chart aktiv ist bzw. aus der Auswahlliste übernommen wurde.

<figure><img src="https://docs.agenatrader.com/~gitbook/image?url=https%3A%2F%2F1347375179-files.gitbook.io%2F%7E%2Ffiles%2Fv0%2Fb%2Fgitbook-legacy-files%2Fo%2Fassets%252F-MKZSsJBtSP9L4sqIe_q%252F-MP9UgwSdi0YqVlTnGRX%252F-MP9WPnOpIg-jQvYRzmr%252Flist1.PNG%3Falt%3Dmedia%26token%3D217d7efc-0365-4ba0-b6aa-d93aa545cc04&#x26;width=768&#x26;dpr=4&#x26;quality=100&#x26;sign=721acec1&#x26;sv=1" alt=""><figcaption></figcaption></figure>

Über den **Löschen**-Button kann die Strategie aus dieser Liste entfernt werden. Wählt man einen Eintrag in dieser Liste aus, so werden die Einstellungen in der Parameter-Box angezeigt und können dort auch verändert werden. Mit **Übernehmen** bzw. **OK** werden die Indikatoren und deren Einstellungen in den Chart übernommen.

#### Strategie-ParameterBox <a href="#strategie-parameterbox" id="strategie-parameterbox"></a>

In der **Parameter-Box** können die Basiseinstellungen der Strategien eingegeben bzw. verändert werden.

<figure><img src="https://docs.agenatrader.com/~gitbook/image?url=https%3A%2F%2F1347375179-files.gitbook.io%2F%7E%2Ffiles%2Fv0%2Fb%2Fgitbook-legacy-files%2Fo%2Fassets%252F-MKZSsJBtSP9L4sqIe_q%252F-MP9UgwSdi0YqVlTnGRX%252F-MP9WSwXroBLUNSeIrxr%252FparameterBox_strategy1.png%3Falt%3Dmedia%26token%3D92c56a4a-2204-486e-8ad1-3207675e10d5&#x26;width=768&#x26;dpr=4&#x26;quality=100&#x26;sign=ce668f02&#x26;sv=1" alt=""><figcaption></figcaption></figure>

In diesem Kapitel beschreiben wir wichtige Attribute der Strategien.

**Allgemeine Einstellungen**

Hierbei handelt es sich um generelle Einstellungen, die für alle Strategien gelten:

* Bars required: dabei handelt es sich um die Anzahl Perioden, ab welcher die Strategie richtig berechnet werden kann. D.h verwendet die Strategie z.B. einen SMA(20) so braucht die Strategie zumindest 20 Perioden der Zeiteinheit um den Gleitenden Durchschnitt richtig berechnen zu können und somit die richtigen Rückschlüsse für die Strategieberechnung ziehen zu können. Dies ist insbesondere wichtig für die Backtests.
* Calculate on bar close: dieser Parameter gibt an, ob die Strategie bei jedem ankommenden Tick berechnet wird (false) oder erst dann wenn die Periode abgeschlossen und der nächste Tick gesendet wird.

{% hint style="warning" %}
**ACHTUNG!** die Berechnung der Strategien kann teils recht aufwendig sein. Befinden sich im gesamten Arbeitsbereich zuviele Strategien mit **Calculate On Bar Close** = false, dann kann das die Performance von AgenaTrader beträchtlich beeinflussen. Speziell deswegen, weil es in AgenaTrader möglich ist viele Strategien parallel laufen zu lassen.
{% endhint %}

* Caption: dabei handelt es sich um die Bezeichnung der Strategie. Hier wird standardmässig die technische Bezeichnung der Strategie angezeigt. Möchte man jedoch auf den Charts eine andere - vielleicht verkürzte - Bezeichnung sehen, so kann man diesen Parameter abändern (z.B. MakeMeRichStrategy -> MMR)
* Input Price Type: Dabei handelt es sich um die Datenserie, zu welcher diese Strategie berechnet werden soll. Der Standardwert ist Close d.h. die Strategie wird aufgrund der Schlusskurse der jeweiligen Perioden errechnet. Es gibt folgende Auswahlmöglichkeiten:

<figure><img src="https://docs.agenatrader.com/~gitbook/image?url=https%3A%2F%2F1347375179-files.gitbook.io%2F%7E%2Ffiles%2Fv0%2Fb%2Fgitbook-legacy-files%2Fo%2Fassets%252F-MKZSsJBtSP9L4sqIe_q%252F-MP9UgwSdi0YqVlTnGRX%252F-MP9WYxLtoXHFseAIADV%252FparameterBox_strategy2.png%3Falt%3Dmedia%26token%3Dc774b866-15cb-43e5-ba3a-fa32b215b37f&#x26;width=768&#x26;dpr=4&#x26;quality=100&#x26;sign=f18d4772&#x26;sv=1" alt=""><figcaption></figcaption></figure>

**Parameters-Einstellungen**

In dieser Sektion können die strategiespezifischen Parameter eingegeben werden. Verändert man diese Werte, so verändert sich auch das Verhalten der Strategie.

<figure><img src="https://docs.agenatrader.com/~gitbook/image?url=https%3A%2F%2F1347375179-files.gitbook.io%2F%7E%2Ffiles%2Fv0%2Fb%2Fgitbook-legacy-files%2Fo%2Fassets%252F-MKZSsJBtSP9L4sqIe_q%252F-MP9UgwSdi0YqVlTnGRX%252F-MP9Wc9uzMu0l3ICGnmR%252FparameterBox_strategy3.png%3Falt%3Dmedia%26token%3D6c36cd86-2c1d-43db-b345-431057e3ea12&#x26;width=768&#x26;dpr=4&#x26;quality=100&#x26;sign=10d3e7ff&#x26;sv=1" alt=""><figcaption></figcaption></figure>

**Strategie-Einstellungen**

Die folgenden Parameter können geändert sein:

* DefaultQuantity: Wird in der Strategie kein Overruling der Ordergröße vorgenommen, so wird die DefaultQuantity aus der Instrument-Spezifikation aus dem [Instrument-Editor](https://docs.agenatrader.com/v/german/menue-erklaerungen-and-inhalt/tool-menue/instrument-escort) geholt. Die DefaultQuantity kann hier nicht eingegeben werden.
* TraceOrders: Wird TraceOrders auf "true" gesetzt, so werden im [Nachrichten](https://docs.agenatrader.com/v/german/menue-erklaerungen-and-inhalt/tool-menue/system-information#Nachrichten) die getätigten Orders dokumentiert. Diese Funktionalität dient also rein zur Information. Im [Handelsinformationen: Order-Manager](https://docs.agenatrader.com/v/german/menue-erklaerungen-and-inhalt/tool-menue/handelsinformationen#Handelsinformationen__Order_Manager) sieht man die getätigten Orders darüber hinaus ebenfalls..

<figure><img src="https://docs.agenatrader.com/~gitbook/image?url=https%3A%2F%2F1347375179-files.gitbook.io%2F%7E%2Ffiles%2Fv0%2Fb%2Fgitbook-legacy-files%2Fo%2Fassets%252F-MKZSsJBtSP9L4sqIe_q%252F-MP9UgwSdi0YqVlTnGRX%252F-MP9WfkGYKwai5jI_K6o%252FparameterBox_strategy4.png%3Falt%3Dmedia%26token%3D9fdced5f-531d-421d-8898-a97f70b20ec6&#x26;width=768&#x26;dpr=4&#x26;quality=100&#x26;sign=db1cc1a6&#x26;sv=1" alt=""><figcaption></figcaption></figure>

## <img src="/files/lTikqWOjMWAUYyp6O6Ow" alt="" data-size="line"> Start AgenaTrader++ (plusplus)

*AgenaTrader++ (plusplus) kann in der ausgewählten Zeiteinheit folgendermaßen aktiviert werden:*

1. Ein Klick auf das Symbol <img src="/files/lTikqWOjMWAUYyp6O6Ow" alt="" data-size="line"> in der Chart-Toolbar oder
2. Klicken Sie mit der rechten Maustaste in den Chart und wählen Sie **Einstellungen -> Start AgenaTrader++** aus.

Zur besseren Visualisierung von aktiven AT++ Strategien wird, sobald AT++ aktiviert ist, unten links im Chart neben dem Logo zwei Pluszeichen ("++") angezeigt. Dadurch erkennt man, daß man sich in dem Chart befindet in dem die Strategie läuft.

<figure><img src="https://docs.agenatrader.com/~gitbook/image?url=https%3A%2F%2F1347375179-files.gitbook.io%2F%7E%2Ffiles%2Fv0%2Fb%2Fgitbook-legacy-files%2Fo%2Fassets%252F-MKZSsJBtSP9L4sqIe_q%252F-MP9WizlMGepocaibx8N%252F-MP9aRkX0HtOBKQ7EMSA%252FAT%252B%252B.png%3Falt%3Dmedia%26token%3Db4a3d991-b542-4818-be48-d1c860ac4c64&#x26;width=768&#x26;dpr=4&#x26;quality=100&#x26;sign=fc83b681&#x26;sv=1" alt=""><figcaption></figcaption></figure>

Welche Strategien gerade laufen, kann man mit dem [Strategie-Escort](https://docs.agenatrader.com/v/german/erstellen-sie-ihre-eigene-handelsstrategie/strategie-escort) nachverfolgen. Durch klicken dieses Symbols ![Icon23](https://docs.agenatrader.com/~gitbook/image?url=https%3A%2F%2F1347375179-files.gitbook.io%2F%7E%2Ffiles%2Fv0%2Fb%2Fgitbook-legacy-files%2Fo%2Fassets%252F-MKZSsJBtSP9L4sqIe_q%252F-MP9WizlMGepocaibx8N%252F-MP9aV1UQrbCvpRAiz_i%252Ficon23.png%3Falt%3Dmedia%26token%3Df0661892-c192-4a25-94c8-23336af11f90\&width=300\&dpr=4\&quality=100\&sign=96fb07aa\&sv=1) kann man selektieren nach welcher [**Analyzer Session**](https://docs.agenatrader.com/v/german/menue-erklaerungen-and-inhalt/tool-menue/konfigurations-escort/setup-escort#analyzer-sessions) gescannt werden soll.

Weitere Informationen finden Sie im Kapitel: [AGENATRADER++ und die weiteren Versionen](https://docs.agenatrader.com/v/german/help).

## <img src="/files/tiEEWdFsjY9Op3GtsewZ" alt="" data-size="line"><img src="/files/3gFKvS6VtxYAOm0gBCxr" alt="" data-size="line"> Zoomen

Über die Zoom-Icons <img src="/files/tiEEWdFsjY9Op3GtsewZ" alt="" data-size="line"><img src="/files/3gFKvS6VtxYAOm0gBCxr" alt="" data-size="line"> kann der Chart hinaus und herein-gezoomed werden.

<figure><img src="https://docs.agenatrader.com/~gitbook/image?url=https%3A%2F%2F1347375179-files.gitbook.io%2F%7E%2Ffiles%2Fv0%2Fb%2Fgitbook-legacy-files%2Fo%2Fassets%252F-MKZSsJBtSP9L4sqIe_q%252F-MP9WizlMGepocaibx8N%252F-MP9ajN3m2Op7IGj_ouy%252FZoom%281%29.jpg%3Falt%3Dmedia%26token%3D2f9d4869-ff76-43fd-8802-5a6b127a5908&#x26;width=768&#x26;dpr=4&#x26;quality=100&#x26;sign=bddd5b86&#x26;sv=1" alt=""><figcaption></figcaption></figure>

**Chart Auszug**

Mit gedrückter rechter Maustaste kann man sich einen Chart Bereich markieren.

<figure><img src="https://docs.agenatrader.com/~gitbook/image?url=https%3A%2F%2F1347375179-files.gitbook.io%2F%7E%2Ffiles%2Fv0%2Fb%2Fgitbook-legacy-files%2Fo%2Fassets%252F-MKZSsJBtSP9L4sqIe_q%252F-MP9WizlMGepocaibx8N%252F-MP9amgIKo73Lgy9VfHh%252FZoom%282%29.jpg%3Falt%3Dmedia%26token%3D2a0c74a1-731e-4308-9ffc-8133848000d6&#x26;width=768&#x26;dpr=4&#x26;quality=100&#x26;sign=ae0b82b7&#x26;sv=1" alt=""><figcaption></figcaption></figure>

Lässt man die rechte Maustaste los, so wird dieser Bereich im Chart dargestellt.

<figure><img src="https://docs.agenatrader.com/~gitbook/image?url=https%3A%2F%2F1347375179-files.gitbook.io%2F%7E%2Ffiles%2Fv0%2Fb%2Fgitbook-legacy-files%2Fo%2Fassets%252F-MKZSsJBtSP9L4sqIe_q%252F-MP9WizlMGepocaibx8N%252F-MP9aqK3Mt_dbo4v9GxW%252FZoom%283%29.jpg%3Falt%3Dmedia%26token%3D415dea0a-eab1-4e4d-9ad3-99c89a577a96&#x26;width=768&#x26;dpr=4&#x26;quality=100&#x26;sign=145c25a8&#x26;sv=1" alt=""><figcaption></figcaption></figure>

Mit Doppelklick auf die Zeit-Skala (untere Leiste im Chart) bzw. einem Klick auf den Pfeil rechts oben wird der vorherige Zustand wieder hergestellt.

## <img src="/files/3JU36ou7rZz5T7se9cBy" alt="" data-size="line"> Komplette Historie anzeigen

Mit einem einzigen Mausklick kann die gesamte geladene Historien im Chart angezeigt werden.

*Die Historien können folgendermaßen geladen werden:*

1. Ein Klick auf das Symbol <img src="/files/3JU36ou7rZz5T7se9cBy" alt="" data-size="line"> in der Chart-Toolbar oder
2. Klicken Sie mit der rechten Maustaste in den Chart und wählen Sie **Einstellungen -> Show all history** aus.

<figure><img src="https://docs.agenatrader.com/~gitbook/image?url=https%3A%2F%2F1347375179-files.gitbook.io%2F%7E%2Ffiles%2Fv0%2Fb%2Fgitbook-legacy-files%2Fo%2Fassets%252F-MKZSsJBtSP9L4sqIe_q%252F-MP9WizlMGepocaibx8N%252F-MP9b-__n_-TV_Ao2D2d%252Fshow_all_history_custom.png%3Falt%3Dmedia%26token%3Dbd5199d0-7f28-4b96-a2e2-645d089c57a6&#x26;width=768&#x26;dpr=4&#x26;quality=100&#x26;sign=be932603&#x26;sv=1" alt=""><figcaption></figcaption></figure>

## <img src="/files/u4WLPmtbSDSiWcbNcZLX" alt="" data-size="line"> Zeiger

*Öffnen sie die Mauszeiger-Optionen wie folgt:*

1. Ein Klick auf das Symbol <img src="/files/u4WLPmtbSDSiWcbNcZLX" alt="" data-size="line"> in der Chart-Toolbar oder
2. Klicken Sie mit der rechten Maustaste in den Chart und wählen Sie **Einstellungen -> Zeiger** aus.

Als Mauszeiger stehen Ihnen 5 Darstellungsmöglichkeiten zu Verfügung:

<img src="/files/2SexcJeMiPWwhPZj3AU2" alt="" data-size="line"> Pfeil

<img src="/files/cSweGXd96NhCNXmdifyC" alt="" data-size="line"> Pfeil mit Anzeigen

<img src="/files/ULmeRaduCwGeHIpolkm8" alt="" data-size="line">FadenKreuz

<img src="/files/u4WLPmtbSDSiWcbNcZLX" alt="" data-size="line">Global Cross Hair

<img src="/files/X9JJvaAaWlb59QiHvKHK" alt="" data-size="line">Global Cross Hair with Scrolling

<figure><img src="https://docs.agenatrader.com/~gitbook/image?url=https%3A%2F%2F1347375179-files.gitbook.io%2F%7E%2Ffiles%2Fv0%2Fb%2Fgitbook-legacy-files%2Fo%2Fassets%252F-MKZSsJBtSP9L4sqIe_q%252F-MP9WizlMGepocaibx8N%252F-MP9bHYMJ9aNf3unhocD%252Fcursor_type3.png%3Falt%3Dmedia%26token%3D198c3b7d-0c72-4f1b-aac3-922b89298c52&#x26;width=768&#x26;dpr=4&#x26;quality=100&#x26;sign=98c48bc&#x26;sv=1" alt=""><figcaption></figcaption></figure>

* Pfeil: es wird nur der Mauszeiger dargestellt.
* Pfeil mit Anzeigen: es werden zusätzlich die Zeit & der Preis angezeigt.

<figure><img src="https://docs.agenatrader.com/~gitbook/image?url=https%3A%2F%2F1347375179-files.gitbook.io%2F%7E%2Ffiles%2Fv0%2Fb%2Fgitbook-legacy-files%2Fo%2Fassets%252F-MKZSsJBtSP9L4sqIe_q%252F-MP9WizlMGepocaibx8N%252F-MP9bJzv8whn7XxC_oQ7%252Farrow.jpg%3Falt%3Dmedia%26token%3Dbf58083c-7cb3-4115-926e-6b263c0b5ff4&#x26;width=768&#x26;dpr=4&#x26;quality=100&#x26;sign=66521777&#x26;sv=1" alt=""><figcaption></figcaption></figure>

* Fadenkreuz: stellt den Zeiger als eine Überkreuzung einer vertikalen und einer horozontalen Linie dar.

<figure><img src="https://docs.agenatrader.com/~gitbook/image?url=https%3A%2F%2F1347375179-files.gitbook.io%2F%7E%2Ffiles%2Fv0%2Fb%2Fgitbook-legacy-files%2Fo%2Fassets%252F-MKZSsJBtSP9L4sqIe_q%252F-MP9WizlMGepocaibx8N%252F-MP9bPesSJVF0j1Y2hNC%252Fcrosshaair.jpg%3Falt%3Dmedia%26token%3Df79aebb2-4828-4a8f-831a-814f25cd2e47&#x26;width=768&#x26;dpr=4&#x26;quality=100&#x26;sign=fb237c07&#x26;sv=1" alt=""><figcaption></figcaption></figure>

* Global Cross Hair: wird diese Funktion ausgewählt, so wird das **Fadenkreuz** in anderen Zeiteinheiten des gleichen Instruments gleichzeitig angezeigt.
* Global Cross Hair with Scrolling: wird diese Funktion ausgewählt, so wird das **Fadenkreuz** in anderen Zeiteinheiten, des gleichen Instruments, gleichzeitig angezeigt und auch der Chart der untergeordneten Zeiteinheit wird mit bewegt.

## <img src="/files/Df48x3L5MaNP3WX5YJQm" alt="" data-size="line"> Öffentlicher Modus

Der **Public Mode** erlaubt das Teilen von Trade Ideen und Trading Strategien mit anderen Usern ohne seine Kontodaten preiszugebben.

*Aktivieren Sie den Trading Mode wie folgt:*

1. Ein Klick auf das Symbol <img src="/files/Df48x3L5MaNP3WX5YJQm" alt="" data-size="line"> in der Chart-Toolbar oder
2. Klicken Sie mit der rechten Maustaste im Chart und wählen Sie **Einstellungen -> Public Mode** aus.

<figure><img src="https://docs.agenatrader.com/~gitbook/image?url=https%3A%2F%2F1347375179-files.gitbook.io%2F%7E%2Ffiles%2Fv0%2Fb%2Fgitbook-legacy-files%2Fo%2Fassets%252F-MKZSsJBtSP9L4sqIe_q%252F-MP9WizlMGepocaibx8N%252F-MP9bYuHuI9CBk74EOq1%252Fpublic_mode_custom_2.png%3Falt%3Dmedia%26token%3D1f9ad99e-d530-44d2-95dd-ee07e1c1dfc8&#x26;width=768&#x26;dpr=4&#x26;quality=100&#x26;sign=caef8bf5&#x26;sv=1" alt=""><figcaption></figcaption></figure>

Wenn diese Funktion aktiviert wurde, wird die Ordergröße sowie die Gewinn\&Verlust Kalkulation nicht angezeigt.

<figure><img src="https://docs.agenatrader.com/~gitbook/image?url=https%3A%2F%2F1347375179-files.gitbook.io%2F%7E%2Ffiles%2Fv0%2Fb%2Fgitbook-legacy-files%2Fo%2Fassets%252F-MKZSsJBtSP9L4sqIe_q%252F-MP9WizlMGepocaibx8N%252F-MP9bbW47zuQ0_ejx2-A%252Fpublic_mode_custom.png%3Falt%3Dmedia%26token%3D22922424-1af6-4e6f-ad4d-164b0df78e5c&#x26;width=768&#x26;dpr=4&#x26;quality=100&#x26;sign=e500e7c2&#x26;sv=1" alt=""><figcaption></figcaption></figure>

Es gibt die Möglichkeit, **Strict Public Modus** auszuführen. Linker Mausklick ![Public Mode](https://docs.agenatrader.com/~gitbook/image?url=https%3A%2F%2F1347375179-files.gitbook.io%2F%7E%2Ffiles%2Fv0%2Fb%2Fgitbook-legacy-files%2Fo%2Fassets%252F-MKZSsJBtSP9L4sqIe_q%252F-MP9WizlMGepocaibx8N%252F-MP9bfpOFvSC7g8kFXnL%252Fpublic%2520mode.PNG%3Falt%3Dmedia%26token%3D1c13beca-1f7e-4be6-b400-e2d93e04d334\&width=300\&dpr=4\&quality=100\&sign=459978d1\&sv=1) Schaltfläche der Hauptsymbolleiste. In diesem Modus waren Ihre Trades nicht teilen.

## <img src="/files/JeVExEt5RfX5T0qxdeJQ" alt="" data-size="line"> Bar Timer

Mit diesem button lässt sich einstellen ob ein Bar Timer angezeigt wird, welche Position dieser am Chart erhält und der Style des Timers (Text oder Bar).

*Das kann folgendermaßen geändert werden:*

1. Ein Klick auf das Symbol <img src="/files/JeVExEt5RfX5T0qxdeJQ" alt="" data-size="line"> in der Chart-Toolbar oder
2. Klicken Sie mit der rechten Maustaste in den Chart und wählen Sie **Einstellungen -> Bar Timer** aus.

<br>

<figure><img src="https://docs.agenatrader.com/~gitbook/image?url=https%3A%2F%2F1347375179-files.gitbook.io%2F%7E%2Ffiles%2Fv0%2Fb%2Fgitbook-legacy-files%2Fo%2Fassets%252F-MKZSsJBtSP9L4sqIe_q%252F-MP9WizlMGepocaibx8N%252F-MP9bpVkuwH_zOHkllNT%252Fbar_timer_custom.png%3Falt%3Dmedia%26token%3Ddbbdf821-3334-4cfc-9977-ea489194c7b0&#x26;width=768&#x26;dpr=4&#x26;quality=100&#x26;sign=2e40d017&#x26;sv=1" alt=""><figcaption></figcaption></figure>

## <img src="/files/hLvrvMGjcGs3i8FLxJq2" alt="" data-size="line"> Wechsel (außerbörslicher Modus)

*Außerbörsliche Aktivitäten können am Chart angezeigt werden. Dafür:*

1. Ein Klick mit der linken Maustaste auf das Symbol <img src="/files/bsdSJMZFnozrYZdlZeZE" alt="" data-size="line"> in der Chart-Toolbar oder
2. Klicken Sie mit der rechten Maustaste in den Chart und wählen Sie **Einstellungen -> Wechsel: außerbörslicher Modus** aus.

Jedoch ist es nur dann möglich, wenn Sie von Ihrem Datenfeed-Anbieter dafür Daten bekommen. Die Perioden der außerbörslichen Handelszeiten können [farblich](https://docs.agenatrader.com/v/german/menue-erklaerungen-and-inhalt/hauptmenue/chart-toolbar/farbe) individuell dargestellt werden.

**Hinweis!** im außerbörslichen Handel kann **KEIN AT++ Setup** gestartet werden.

**Hinweis!** Für **Barchart, Teletrader, TaiPan** bekomme ich keine Pre/Post-Daten im Chart angezeigt. und für **IQ-Feed,InteractiveBrokers** bekomme ich Pre/Post-Daten im Chart angezeigt.

<figure><img src="https://docs.agenatrader.com/~gitbook/image?url=https%3A%2F%2F1347375179-files.gitbook.io%2F%7E%2Ffiles%2Fv0%2Fb%2Fgitbook-legacy-files%2Fo%2Fassets%252F-MKZSsJBtSP9L4sqIe_q%252F-MP9WizlMGepocaibx8N%252F-MP9c9S7WoMTQTHE11Je%252FPostMarket.jpg%3Falt%3Dmedia%26token%3D351059c0-7c5d-48b5-b4c3-12d7f66f50ea&#x26;width=768&#x26;dpr=4&#x26;quality=100&#x26;sign=73f5dd40&#x26;sv=1" alt=""><figcaption></figcaption></figure>

Die außerbörslichen Zeiten werden im [Allgemeine Einstellungen: Marktplatz-Escort](https://docs.agenatrader.com/v/german/menue-erklaerungen-and-inhalt/tool-menue/konfigurations-escort#Konfigurations_Escort__Marktplatz_Escort) verwaltet.

<figure><img src="https://docs.agenatrader.com/~gitbook/image?url=https%3A%2F%2F1347375179-files.gitbook.io%2F%7E%2Ffiles%2Fv0%2Fb%2Fgitbook-legacy-files%2Fo%2Fassets%252F-MKZSsJBtSP9L4sqIe_q%252F-MP9WizlMGepocaibx8N%252F-MP9cCIGvuLw9FS62hdU%252FTrading_Hours.png%3Falt%3Dmedia%26token%3D7564e7b3-7d0a-44d5-9230-143fc4f19055&#x26;width=768&#x26;dpr=4&#x26;quality=100&#x26;sign=15ad08e2&#x26;sv=1" alt=""><figcaption></figcaption></figure>

## <img src="/files/k06RcSjpiIgFmYNVneZi" alt="" data-size="line"> Сhart-Gruppe

*Öffnen sie die Chartgruppe-Funktionen wie folgt:*

1. Ein Klick auf das Symbol <img src="/files/k06RcSjpiIgFmYNVneZi" alt="" data-size="line"> in der Chart-Toolbar oder
2. Klicken Sie mit der rechten Maustaste in den Chart und wählen Sie **Einstellungen -> Chart-Gruppe** aus.

Je nachdem, ob Sie sich in einer ListChart Gruppe (LCG) oder TabChartGruppe (TCG) befinden, erhalten Sie spezielle Möglichkeiten.

* ListChart-Gruppe (LCG)

<figure><img src="https://docs.agenatrader.com/~gitbook/image?url=https%3A%2F%2F1347375179-files.gitbook.io%2F%7E%2Ffiles%2Fv0%2Fb%2Fgitbook-legacy-files%2Fo%2Fassets%252F-MKZSsJBtSP9L4sqIe_q%252F-MP9WizlMGepocaibx8N%252F-MP9cJdOHKbpI5kWSiiC%252FtoolbarChartGroup.png%3Falt%3Dmedia%26token%3Dd1c0fe2f-ba3b-4c26-a82a-827adbdecd2e&#x26;width=768&#x26;dpr=4&#x26;quality=100&#x26;sign=86c57e67&#x26;sv=1" alt=""><figcaption></figcaption></figure>

* TabChart-Gruppe (TCG)

<figure><img src="https://docs.agenatrader.com/~gitbook/image?url=https%3A%2F%2F1347375179-files.gitbook.io%2F%7E%2Ffiles%2Fv0%2Fb%2Fgitbook-legacy-files%2Fo%2Fassets%252F-MKZSsJBtSP9L4sqIe_q%252F-MP9WizlMGepocaibx8N%252F-MP9cMJ5ayY588QKIe7z%252FtoolbarChartGroup2.png%3Falt%3Dmedia%26token%3De743df92-98e1-4978-8eaa-17e10b07b54c&#x26;width=768&#x26;dpr=4&#x26;quality=100&#x26;sign=90c72edc&#x26;sv=1" alt=""><figcaption></figcaption></figure>

### Chart hinzufügen <a href="#chart_hinzuf_gen" id="chart_hinzuf_gen"></a>

**Chart hinzufügen** fügt einen Chart zum Container hinzu. Der neue Chart ist mit einer im Container bereits existierenden Zeiteinheit vor eingestellt, welche danach manuell geändert werden kann.

![](https://docs.agenatrader.com/~gitbook/image?url=https%3A%2F%2F1347375179-files.gitbook.io%2F%7E%2Ffiles%2Fv0%2Fb%2Fgitbook-legacy-files%2Fo%2Fassets%252F-MKZSsJBtSP9L4sqIe_q%252F-MP9WizlMGepocaibx8N%252F-MP9cOvLmueu6aYMdc1l%252FChart_groups3.png%3Falt%3Dmedia%26token%3D05d6fe48-79b7-46ec-81fa-3c09de41ca4b\&width=768\&dpr=4\&quality=100\&sign=358c6514\&sv=1)![](https://docs.agenatrader.com/~gitbook/image?url=https%3A%2F%2F1347375179-files.gitbook.io%2F%7E%2Ffiles%2Fv0%2Fb%2Fgitbook-legacy-files%2Fo%2Fassets%252F-MKZSsJBtSP9L4sqIe_q%252F-MP9WizlMGepocaibx8N%252F-MP9cRxken0ABtwFXG_M%252FChartGroup%281%29.jpg%3Falt%3Dmedia%26token%3Dd0c76324-ffe1-4319-9172-ebb06e8d6c09\&width=768\&dpr=4\&quality=100\&sign=d0df2cff\&sv=1)

### Chart löschen <a href="#chart_l_schen" id="chart_l_schen"></a>

Wählt man den Menü-Eintrag **Chart löschen** aus, so erscheint ein Untermenü mit allen Zeiteinheiten der Chartgruppe.

Bei Selektion eines dieser Einträge verfärbt sich der Rand und der Actionbar des Charts rot (siehe Bild unten). Bestätigt man die Auswahl, so wird der Chart entfernt.

<figure><img src="https://docs.agenatrader.com/~gitbook/image?url=https%3A%2F%2F1347375179-files.gitbook.io%2F%7E%2Ffiles%2Fv0%2Fb%2Fgitbook-legacy-files%2Fo%2Fassets%252F-MKZSsJBtSP9L4sqIe_q%252F-MP9WizlMGepocaibx8N%252F-MP9cUVQS1nGiloTucvw%252FDeleteChart.jpg%3Falt%3Dmedia%26token%3Df65651ac-0f1a-4114-aaea-a33539c9a24f&#x26;width=768&#x26;dpr=4&#x26;quality=100&#x26;sign=70eb015f&#x26;sv=1" alt=""><figcaption></figcaption></figure>

### Container Style setzen <a href="#container_style_setzen" id="container_style_setzen"></a>

Wählt man z.B. im List-/TabChart-Gruppen Dialog drei Zeiteinheiten aus, ohne dass eine Chart-Gruppenvorlage selektiert wurde, so erscheint die Chart-Gruppe mit horizontal verteilten Charts.

<figure><img src="https://docs.agenatrader.com/~gitbook/image?url=https%3A%2F%2F1347375179-files.gitbook.io%2F%7E%2Ffiles%2Fv0%2Fb%2Fgitbook-legacy-files%2Fo%2Fassets%252F-MKZSsJBtSP9L4sqIe_q%252F-MP9WizlMGepocaibx8N%252F-MP9cXGIofjrJFNweAX8%252FCreateListaChartGroup.png%3Falt%3Dmedia%26token%3De9d668be-0eff-40df-bef0-cde17f09d59d&#x26;width=768&#x26;dpr=4&#x26;quality=100&#x26;sign=26eae4f0&#x26;sv=1" alt=""><figcaption></figcaption></figure>

Über den Eintrag **Container Style setzen** kann man sich die Charts anders anordnen. Bei z.B. drei Charts stehen folgende Auswahlmöglichkeiten zur Verfügung:

* Horizontal
* Vertikal
* Rechts (1 großer Chart links und 2 kleine Charts rechts)
* Links (1 großer Chart rechts und 2 kleine Charts links)

<figure><img src="https://docs.agenatrader.com/~gitbook/image?url=https%3A%2F%2F1347375179-files.gitbook.io%2F%7E%2Ffiles%2Fv0%2Fb%2Fgitbook-legacy-files%2Fo%2Fassets%252F-MKZSsJBtSP9L4sqIe_q%252F-MP9WizlMGepocaibx8N%252F-MP9cdl9oiqCM1uUbqWF%252FSetContainer%2520Style.jpg%3Falt%3Dmedia%26token%3D26a7554a-6339-4cd2-8f07-233381d592f5&#x26;width=768&#x26;dpr=4&#x26;quality=100&#x26;sign=e2be6ba7&#x26;sv=1" alt=""><figcaption></figcaption></figure>

### Drucken <a href="#drucken" id="drucken"></a>

Über das Kontextmenü ist es möglich die ganze TCG/LCG zu drucken

Es stehen zwei Druckoptionen zur Verfügung:

* Chartgruppe drucken: druckt nur die aktuelle Chart Gruppe.
* Chartgruppen-Liste drucken: druckt alle Werte aus der LCG / TCG.

<figure><img src="https://docs.agenatrader.com/~gitbook/image?url=https%3A%2F%2F1347375179-files.gitbook.io%2F%7E%2Ffiles%2Fv0%2Fb%2Fgitbook-legacy-files%2Fo%2Fassets%252F-MKZSsJBtSP9L4sqIe_q%252F-MP9WizlMGepocaibx8N%252F-MP9cgyVDucNT4W57j-2%252FPrintChartGroup.jpg%3Falt%3Dmedia%26token%3D9eef8ff5-1613-404f-91c5-0e60860a1d86&#x26;width=768&#x26;dpr=4&#x26;quality=100&#x26;sign=e60f38fa&#x26;sv=1" alt=""><figcaption></figcaption></figure>

### Als Bild speichern <a href="#als_bid_speichern" id="als_bid_speichern"></a>

Wählen Sie im Kontextmenü **Einstellungen -> ChartGruppe -> Save as Image**, um die aktuelle Chart Gruppe als Bild abzuspeichern.

<figure><img src="https://docs.agenatrader.com/~gitbook/image?url=https%3A%2F%2F1347375179-files.gitbook.io%2F%7E%2Ffiles%2Fv0%2Fb%2Fgitbook-legacy-files%2Fo%2Fassets%252F-MKZSsJBtSP9L4sqIe_q%252F-MP9WizlMGepocaibx8N%252F-MP9cjTo_9x0GcbQz4UF%252Fchartgroup_save_as_image.png%3Falt%3Dmedia%26token%3Dbd6ee698-67d1-4c80-8f2e-a69ed8c12a87&#x26;width=768&#x26;dpr=4&#x26;quality=100&#x26;sign=9e14e977&#x26;sv=1" alt=""><figcaption></figcaption></figure>

### Vorlage <a href="#vorlage" id="vorlage"></a>

Je nachdem ob man sich in einer ListChart-Gruppe (LCG) oder einer TabChart-Gruppe (TCG) befindet, kann man für den jeweiligen ChartContainer wieder verwendbare Vorlagen speichern.

| Symbol                                                                                                                                                                                                                                                                                                                                                                                             | Feature                                                                                                                                 | Vorlage speichern                                                                                                                                                                                                                                                                                                                                                                                |   |
| -------------------------------------------------------------------------------------------------------------------------------------------------------------------------------------------------------------------------------------------------------------------------------------------------------------------------------------------------------------------------------------------------- | --------------------------------------------------------------------------------------------------------------------------------------- | ------------------------------------------------------------------------------------------------------------------------------------------------------------------------------------------------------------------------------------------------------------------------------------------------------------------------------------------------------------------------------------------------ | - |
| -                                                                                                                                                                                                                                                                                                                                                                                                  | [AktionBar Einstellung](https://docs.agenatrader.com/v/german/menue-erklaerungen-and-inhalt/tool-menue/konfigurations-escort#actionbar) | ![Blue Checkmark Ms](https://docs.agenatrader.com/~gitbook/image?url=https%3A%2F%2F1347375179-files.gitbook.io%2F%7E%2Ffiles%2Fv0%2Fb%2Fgitbook-legacy-files%2Fo%2Fassets%252F-MKZSsJBtSP9L4sqIe_q%252F-MP9WizlMGepocaibx8N%252F-MP9f0QADTzU2G_TrecR%252Fblue_checkmark_ms.png%3Falt%3Dmedia%26token%3D1e3023c3-2922-4a3c-aec6-b3e42d0019f9\&width=300\&dpr=4\&quality=100\&sign=5b4e90a1\&sv=1) |   |
| -                                                                                                                                                                                                                                                                                                                                                                                                  | Anzahl der Charts                                                                                                                       | ![Blue Checkmark Ms](https://docs.agenatrader.com/~gitbook/image?url=https%3A%2F%2F1347375179-files.gitbook.io%2F%7E%2Ffiles%2Fv0%2Fb%2Fgitbook-legacy-files%2Fo%2Fassets%252F-MKZSsJBtSP9L4sqIe_q%252F-MP9WizlMGepocaibx8N%252F-MP9f0QADTzU2G_TrecR%252Fblue_checkmark_ms.png%3Falt%3Dmedia%26token%3D1e3023c3-2922-4a3c-aec6-b3e42d0019f9\&width=300\&dpr=4\&quality=100\&sign=5b4e90a1\&sv=1) |   |
| <img src="/files/2yuJ7IsXDh8F21nLku5A" alt="" data-size="line">                                                                                                                                                                                                                                                                                                                                    | Bar timer                                                                                                                               | ![Blue Checkmark Ms](https://docs.agenatrader.com/~gitbook/image?url=https%3A%2F%2F1347375179-files.gitbook.io%2F%7E%2Ffiles%2Fv0%2Fb%2Fgitbook-legacy-files%2Fo%2Fassets%252F-MKZSsJBtSP9L4sqIe_q%252F-MP9WizlMGepocaibx8N%252F-MP9f0QADTzU2G_TrecR%252Fblue_checkmark_ms.png%3Falt%3Dmedia%26token%3D1e3023c3-2922-4a3c-aec6-b3e42d0019f9\&width=300\&dpr=4\&quality=100\&sign=5b4e90a1\&sv=1) |   |
| <img src="/files/KcVEAQ8xwIXXhP8Z2ENu" alt="" data-size="line">                                                                                                                                                                                                                                                                                                                                    | Chart-Netz                                                                                                                              | ![Blue Checkmark Ms](https://docs.agenatrader.com/~gitbook/image?url=https%3A%2F%2F1347375179-files.gitbook.io%2F%7E%2Ffiles%2Fv0%2Fb%2Fgitbook-legacy-files%2Fo%2Fassets%252F-MKZSsJBtSP9L4sqIe_q%252F-MP9WizlMGepocaibx8N%252F-MP9f0QADTzU2G_TrecR%252Fblue_checkmark_ms.png%3Falt%3Dmedia%26token%3D1e3023c3-2922-4a3c-aec6-b3e42d0019f9\&width=300\&dpr=4\&quality=100\&sign=5b4e90a1\&sv=1) |   |
| <img src="/files/NRGmyGE2Yo9b3vZGoU8F" alt="" data-size="line">                                                                                                                                                                                                                                                                                                                                    | DOM                                                                                                                                     | -                                                                                                                                                                                                                                                                                                                                                                                                |   |
| ![Icon19](https://docs.agenatrader.com/~gitbook/image?url=https%3A%2F%2F1347375179-files.gitbook.io%2F%7E%2Ffiles%2Fv0%2Fb%2Fgitbook-legacy-files%2Fo%2Fassets%252F-MKZSsJBtSP9L4sqIe_q%252F-MP9WizlMGepocaibx8N%252F-MP9d6fzeCWud-aBxUdU%252Ficon19.png%3Falt%3Dmedia%26token%3D0fb320f2-9d3d-4acb-9a07-9fa2c01586ae\&width=300\&dpr=4\&quality=100\&sign=8191c1a9\&sv=1)                         | Farbe                                                                                                                                   | ![Blue Checkmark Ms](https://docs.agenatrader.com/~gitbook/image?url=https%3A%2F%2F1347375179-files.gitbook.io%2F%7E%2Ffiles%2Fv0%2Fb%2Fgitbook-legacy-files%2Fo%2Fassets%252F-MKZSsJBtSP9L4sqIe_q%252F-MP9WizlMGepocaibx8N%252F-MP9f0QADTzU2G_TrecR%252Fblue_checkmark_ms.png%3Falt%3Dmedia%26token%3D1e3023c3-2922-4a3c-aec6-b3e42d0019f9\&width=300\&dpr=4\&quality=100\&sign=5b4e90a1\&sv=1) |   |
| <img src="/files/MXIeMXRgN6BAXUU5V6gb" alt="" data-size="line">                                                                                                                                                                                                                                                                                                                                    | Indicatoren                                                                                                                             | ![Blue Checkmark Ms](https://docs.agenatrader.com/~gitbook/image?url=https%3A%2F%2F1347375179-files.gitbook.io%2F%7E%2Ffiles%2Fv0%2Fb%2Fgitbook-legacy-files%2Fo%2Fassets%252F-MKZSsJBtSP9L4sqIe_q%252F-MP9WizlMGepocaibx8N%252F-MP9f0QADTzU2G_TrecR%252Fblue_checkmark_ms.png%3Falt%3Dmedia%26token%3D1e3023c3-2922-4a3c-aec6-b3e42d0019f9\&width=300\&dpr=4\&quality=100\&sign=5b4e90a1\&sv=1) |   |
| ![Es](https://docs.agenatrader.com/~gitbook/image?url=https%3A%2F%2F1347375179-files.gitbook.io%2F%7E%2Ffiles%2Fv0%2Fb%2Fgitbook-legacy-files%2Fo%2Fassets%252F-MKZSsJBtSP9L4sqIe_q%252F-MP9P3vFZH_eTVbqUMdh%252F-MP9P73YPqyaXat_aQGc%252Fes.png%3Falt%3Dmedia%26token%3D10a51f78-7994-40ab-8481-a9d296524f22\&width=300\&dpr=4\&quality=100\&sign=357241be\&sv=1)                                 | Instrument                                                                                                                              | -                                                                                                                                                                                                                                                                                                                                                                                                |   |
| <img src="/files/4CHX1Foo6SUo6rYlx1Dw" alt="" data-size="line">                                                                                                                                                                                                                                                                                                                                    | Komplete Historie anzeigen                                                                                                              | -                                                                                                                                                                                                                                                                                                                                                                                                |   |
| <img src="/files/YrN5H7sqQzfuyTAaKVhM" alt="" data-size="line">                                                                                                                                                                                                                                                                                                                                    | Öffentlicher Modus                                                                                                                      | -                                                                                                                                                                                                                                                                                                                                                                                                |   |
| <img src="/files/PvEFVvoaeMftRa2zGlR3" alt="" data-size="line">                                                                                                                                                                                                                                                                                                                                    | Preis style                                                                                                                             | ![Blue Checkmark Ms](https://docs.agenatrader.com/~gitbook/image?url=https%3A%2F%2F1347375179-files.gitbook.io%2F%7E%2Ffiles%2Fv0%2Fb%2Fgitbook-legacy-files%2Fo%2Fassets%252F-MKZSsJBtSP9L4sqIe_q%252F-MP9WizlMGepocaibx8N%252F-MP9f0QADTzU2G_TrecR%252Fblue_checkmark_ms.png%3Falt%3Dmedia%26token%3D1e3023c3-2922-4a3c-aec6-b3e42d0019f9\&width=300\&dpr=4\&quality=100\&sign=5b4e90a1\&sv=1) |   |
| <img src="/files/6MEPszimzRcky0WAxA6H" alt="" data-size="line">                                                                                                                                                                                                                                                                                                                                    | Preismarkierungen Linien                                                                                                                | ![Blue Checkmark Ms](https://docs.agenatrader.com/~gitbook/image?url=https%3A%2F%2F1347375179-files.gitbook.io%2F%7E%2Ffiles%2Fv0%2Fb%2Fgitbook-legacy-files%2Fo%2Fassets%252F-MKZSsJBtSP9L4sqIe_q%252F-MP9WizlMGepocaibx8N%252F-MP9f0QADTzU2G_TrecR%252Fblue_checkmark_ms.png%3Falt%3Dmedia%26token%3D1e3023c3-2922-4a3c-aec6-b3e42d0019f9\&width=300\&dpr=4\&quality=100\&sign=5b4e90a1\&sv=1) |   |
| ![Quicktrader Button](https://docs.agenatrader.com/~gitbook/image?url=https%3A%2F%2F1347375179-files.gitbook.io%2F%7E%2Ffiles%2Fv0%2Fb%2Fgitbook-legacy-files%2Fo%2Fassets%252F-MKZSsJBtSP9L4sqIe_q%252F-MP9WizlMGepocaibx8N%252F-MP9dyUH9J2wX53XpT8a%252Fquicktrader_button.png%3Falt%3Dmedia%26token%3D121125f9-1d39-4e29-b9d3-75c3bb0f2e4a\&width=300\&dpr=4\&quality=100\&sign=aa4ccb10\&sv=1) | Quick Trader                                                                                                                            | -                                                                                                                                                                                                                                                                                                                                                                                                |   |
| ![Icon8](https://docs.agenatrader.com/~gitbook/image?url=https%3A%2F%2F1347375179-files.gitbook.io%2F%7E%2Ffiles%2Fv0%2Fb%2Fgitbook-legacy-files%2Fo%2Fassets%252F-MKZSsJBtSP9L4sqIe_q%252F-MP9WizlMGepocaibx8N%252F-MP9e2uNohzNYUWHo7aX%252Ficon8.png%3Falt%3Dmedia%26token%3Df5b0a069-68df-400e-8c03-5a05462bc0ad\&width=300\&dpr=4\&quality=100\&sign=4037bd12\&sv=1)                           | Rein/Raus-Zoomen                                                                                                                        | ![Blue Checkmark Ms](https://docs.agenatrader.com/~gitbook/image?url=https%3A%2F%2F1347375179-files.gitbook.io%2F%7E%2Ffiles%2Fv0%2Fb%2Fgitbook-legacy-files%2Fo%2Fassets%252F-MKZSsJBtSP9L4sqIe_q%252F-MP9WizlMGepocaibx8N%252F-MP9f0QADTzU2G_TrecR%252Fblue_checkmark_ms.png%3Falt%3Dmedia%26token%3D1e3023c3-2922-4a3c-aec6-b3e42d0019f9\&width=300\&dpr=4\&quality=100\&sign=5b4e90a1\&sv=1) |   |
| <img src="/files/TL1EqB2DPmbBPGhfYQkM" alt="" data-size="line">                                                                                                                                                                                                                                                                                                                                    | Start AT++                                                                                                                              | -                                                                                                                                                                                                                                                                                                                                                                                                |   |
| <img src="/files/rjFt5Ak3ZNBCLPbi5BWT" alt="" data-size="line">                                                                                                                                                                                                                                                                                                                                    | Strategien                                                                                                                              | -                                                                                                                                                                                                                                                                                                                                                                                                |   |
| <img src="/files/1rrOKVWOfrbqC6gWdCrN" alt="" data-size="line">                                                                                                                                                                                                                                                                                                                                    | Trade Visualisierung                                                                                                                    | ![Blue Checkmark Ms](https://docs.agenatrader.com/~gitbook/image?url=https%3A%2F%2F1347375179-files.gitbook.io%2F%7E%2Ffiles%2Fv0%2Fb%2Fgitbook-legacy-files%2Fo%2Fassets%252F-MKZSsJBtSP9L4sqIe_q%252F-MP9WizlMGepocaibx8N%252F-MP9f0QADTzU2G_TrecR%252Fblue_checkmark_ms.png%3Falt%3Dmedia%26token%3D1e3023c3-2922-4a3c-aec6-b3e42d0019f9\&width=300\&dpr=4\&quality=100\&sign=5b4e90a1\&sv=1) |   |
| <img src="/files/9q7l5klJLo7NYXyEH77D" alt="" data-size="line">                                                                                                                                                                                                                                                                                                                                    | Trading pad                                                                                                                             | -                                                                                                                                                                                                                                                                                                                                                                                                |   |
| <img src="/files/f4n6wN9RmGwTnn67DWjY" alt="" data-size="line">                                                                                                                                                                                                                                                                                                                                    | Wechsel: allgemeine Handelszeit                                                                                                         | -                                                                                                                                                                                                                                                                                                                                                                                                |   |
| <img src="/files/Xu6Eh7BB79wE0tkeeHR6" alt="" data-size="line">                                                                                                                                                                                                                                                                                                                                    | Zeichenwerkzeuge                                                                                                                        | -                                                                                                                                                                                                                                                                                                                                                                                                |   |
| <img src="/files/jTfXSKzSAFfblOK0cC0N" alt="" data-size="line">                                                                                                                                                                                                                                                                                                                                    | Zeiger                                                                                                                                  | ![Blue Checkmark Ms](https://docs.agenatrader.com/~gitbook/image?url=https%3A%2F%2F1347375179-files.gitbook.io%2F%7E%2Ffiles%2Fv0%2Fb%2Fgitbook-legacy-files%2Fo%2Fassets%252F-MKZSsJBtSP9L4sqIe_q%252F-MP9WizlMGepocaibx8N%252F-MP9f0QADTzU2G_TrecR%252Fblue_checkmark_ms.png%3Falt%3Dmedia%26token%3D1e3023c3-2922-4a3c-aec6-b3e42d0019f9\&width=300\&dpr=4\&quality=100\&sign=5b4e90a1\&sv=1) |   |
| ![Icon2](https://docs.agenatrader.com/~gitbook/image?url=https%3A%2F%2F1347375179-files.gitbook.io%2F%7E%2Ffiles%2Fv0%2Fb%2Fgitbook-legacy-files%2Fo%2Fassets%252F-MKZSsJBtSP9L4sqIe_q%252F-MP9P3vFZH_eTVbqUMdh%252F-MP9PFYGedXyenZtZ9We%252Ficon2.png%3Falt%3Dmedia%26token%3D7dfc4d18-ac59-46bd-abf6-dcf793379e07\&width=300\&dpr=4\&quality=100\&sign=cd8593da\&sv=1)                           | Zeiteinheit                                                                                                                             | -                                                                                                                                                                                                                                                                                                                                                                                                |   |

Diese aktuellen Chartinformationen werden gespeichert:

Zeichenobjekte wie z. B. Trendlinien, Fibonacci usw. werden nicht gespeichert.

{% hint style="info" %}
**HINWEIS!** TCG-Vorlagen kann man im **Allgemeine Einstellungen** als [Schnappschuss-Vorlage](https://docs.agenatrader.com/v/german/menue-erklaerungen-and-inhalt/tool-menue/konfigurations-escort#chart) verwenden (wenn ein Trade geschlossen wird, wird dieser als Bild erfasst).
{% endhint %}

Für ListChart-Gruppen werden zusätzlich die aktuellen Einstellungen des Scanners mit in die Vorlage aufgenommen.

<figure><img src="https://docs.agenatrader.com/~gitbook/image?url=https%3A%2F%2F1347375179-files.gitbook.io%2F%7E%2Ffiles%2Fv0%2Fb%2Fgitbook-legacy-files%2Fo%2Fassets%252F-MKZSsJBtSP9L4sqIe_q%252F-MP9WizlMGepocaibx8N%252F-MP9fKLBq2vuyc98oMOB%252FChartSaveAs.png%3Falt%3Dmedia%26token%3Dc28b8212-fe30-44d5-a24b-b45979f98ca0&#x26;width=768&#x26;dpr=4&#x26;quality=100&#x26;sign=918296a6&#x26;sv=1" alt=""><figcaption></figcaption></figure>

Möchte man eine neue List-/bzw. TabChartGruppe öffnen, so kann man die gespeicherte Vorlage auswählen, sodass der Aufbau des Chart-Containers wieder gleich aussieht.

<figure><img src="https://docs.agenatrader.com/~gitbook/image?url=https%3A%2F%2F1347375179-files.gitbook.io%2F%7E%2Ffiles%2Fv0%2Fb%2Fgitbook-legacy-files%2Fo%2Fassets%252F-MKZSsJBtSP9L4sqIe_q%252F-MP9WizlMGepocaibx8N%252F-MP9fNLIZ_IQyS-UjG7o%252FCreateListaChartGroup1.png%3Falt%3Dmedia%26token%3D98ca05b5-f4d1-42a5-bd37-42b5e428f604&#x26;width=768&#x26;dpr=4&#x26;quality=100&#x26;sign=20c64ae5&#x26;sv=1" alt=""><figcaption></figcaption></figure>

### **ListChartGruppen-Vorlagen**

Für ListChartGruppen werden folgende Informationen in der Vorlage abgelegt:

* Aktuelle [Einstellungen des Scanners](https://docs.agenatrader.com/v/german/menue-erklaerungen-and-inhalt/hauptmenue/realtime-scanner/kontextmenue-des-scanners#scanner-vorlagen) (blau)
* Aktuelle [Chart-Einstellungen](https://docs.agenatrader.com/v/german/menue-erklaerungen-and-inhalt/hauptmenue/chart-toolbar/chart-vorlagen) der Charts der Chartgruppe (violett)
* Einstellungen der Chartgruppe (rot). Hierzu kommen folgende Informationen in die Vorlage:
  * Anzahl der Charts
  * deren Zeiteinheit
  * Containerstyle (Positionen der Splitterbars)
  * Größe der einzelnen Charts

<figure><img src="https://docs.agenatrader.com/~gitbook/image?url=https%3A%2F%2F1347375179-files.gitbook.io%2F%7E%2Ffiles%2Fv0%2Fb%2Fgitbook-legacy-files%2Fo%2Fassets%252F-MKZSsJBtSP9L4sqIe_q%252F-MP9WizlMGepocaibx8N%252F-MP9fnlcdXZzTP-4Kugf%252FChartGroup.jpg%3Falt%3Dmedia%26token%3D395ce2a7-c6c8-451b-9546-20552e1a4add&#x26;width=768&#x26;dpr=4&#x26;quality=100&#x26;sign=7fa5e79a&#x26;sv=1" alt=""><figcaption></figcaption></figure>

Möchte man eine ListChartGruppen-Vorlage laden so funktioniert dies:

* Mit einem Linksklick auf das Symbol <img src="/files/k06RcSjpiIgFmYNVneZi" alt="" data-size="line"> in der Chart-Toolbar und danach **Vorlage -> Laden** oder
* Mit einem Rechtsklick auf eine Zeile oder einen Chart der **ListChartGruppe** und danach **Einstellungen -> ChartGruppe -> Vorlage -> Laden**.

<figure><img src="https://docs.agenatrader.com/~gitbook/image?url=https%3A%2F%2F1347375179-files.gitbook.io%2F%7E%2Ffiles%2Fv0%2Fb%2Fgitbook-legacy-files%2Fo%2Fassets%252F-MKZSsJBtSP9L4sqIe_q%252F-MP9WizlMGepocaibx8N%252F-MP9ftqRR1bAZ4vRFSFP%252FChart_groups_templates6.png%3Falt%3Dmedia%26token%3Da55b366d-29e2-4680-9aa1-0bcb0d179ece&#x26;width=768&#x26;dpr=4&#x26;quality=100&#x26;sign=107f5925&#x26;sv=1" alt=""><figcaption></figcaption></figure>

*Kontext Menü:*

* Laden: damit kann eine gespeicherte Vorlage geladen werden.
* Speichern: Wurde z.B. an der aktuellen Darstellung der ListChartgruppe etwas geändert (neuer Indikator, anderer Farbe usw.) so können diese Änderungen in die Vorlage gespeichert werden.
* Speichern unter: Eine neue Vorlage kann damit angelegt werden.
* Als Standard speichern: hier wird die Vorlage als Standard gespeichert. Wählt man bei der Erstellung der ListChartGruppe keine Vorlage aus, so werden diese Standard-Einstellungen herangezogen.
* Entfernen: löscht eine Vorlage.

Wählen Sie aus dem Kontextmenü **Load** und danach **Select...** aus, um die gewünschte ListChartGruppen-Vorlage auszuwählen.

<figure><img src="https://docs.agenatrader.com/~gitbook/image?url=https%3A%2F%2F1347375179-files.gitbook.io%2F%7E%2Ffiles%2Fv0%2Fb%2Fgitbook-legacy-files%2Fo%2Fassets%252F-MKZSsJBtSP9L4sqIe_q%252F-MP9WizlMGepocaibx8N%252F-MP9fxWOREZ1_EzTzizm%252FSelectTemplate.png%3Falt%3Dmedia%26token%3D36ef4e91-bdc8-4574-87b6-7c90603ae417&#x26;width=768&#x26;dpr=4&#x26;quality=100&#x26;sign=861ce7c8&#x26;sv=1" alt=""><figcaption></figcaption></figure>

Die ListChartGruppen-Vorlage kann auch bei der Neuanlage einer ListChartGruppe direkt ausgewählt werden.

<figure><img src="https://docs.agenatrader.com/~gitbook/image?url=https%3A%2F%2F1347375179-files.gitbook.io%2F%7E%2Ffiles%2Fv0%2Fb%2Fgitbook-legacy-files%2Fo%2Fassets%252F-MKZSsJBtSP9L4sqIe_q%252F-MP9WizlMGepocaibx8N%252F-MP9fzx2oE7TQWjh-0RN%252FSelectTemplate1.png%3Falt%3Dmedia%26token%3D0dafc408-e4c6-4418-82fd-9e330ceab0b7&#x26;width=768&#x26;dpr=4&#x26;quality=100&#x26;sign=2f5ab729&#x26;sv=1" alt=""><figcaption></figcaption></figure>

### **TabChartGruppen-Vorlagen**

Für TabChartGruppen werden folgende Informationen in der Vorlage abgelegt:

* Aktuelle [Chart-Einstellungen](https://docs.agenatrader.com/v/german/menue-erklaerungen-and-inhalt/hauptmenue/chart-toolbar/chart-vorlagen) der Charts der Chartgruppe (violett)
* Einstellungen der Chartgruppe (rot). Hierzu kommen folgende Informationen in die Vorlage
  * Anzahl der Charts
  * deren Zeiteinheit
  * Containerstyle (Positionen der Splitterbars)
  * Größe der einzelnen Charts.

<figure><img src="https://docs.agenatrader.com/~gitbook/image?url=https%3A%2F%2F1347375179-files.gitbook.io%2F%7E%2Ffiles%2Fv0%2Fb%2Fgitbook-legacy-files%2Fo%2Fassets%252F-MKZSsJBtSP9L4sqIe_q%252F-MP9WizlMGepocaibx8N%252F-MP9g36xgtMZOPGxmqZG%252FtabChartGroupTemplate.jpg%3Falt%3Dmedia%26token%3D2c884519-4af3-4538-9c6e-43e26a28a355&#x26;width=768&#x26;dpr=4&#x26;quality=100&#x26;sign=14f2b30a&#x26;sv=1" alt=""><figcaption></figcaption></figure>

Möchte man eine TabChartGruppen-Vorlage laden so funktioniert dies:

* Mit einem Linksklick auf das Symbol <img src="/files/k06RcSjpiIgFmYNVneZi" alt="" data-size="line"> in der Chart-Toolbar und danach **Vorlage -> Laden** oder
* Mit einem Rechtsklick auf eine Zeile oder einen Chart der **ListChartGruppe** und danach **Einstellungen -> ChartGruppe -> Vorlage -> Laden**.

<figure><img src="https://docs.agenatrader.com/~gitbook/image?url=https%3A%2F%2F1347375179-files.gitbook.io%2F%7E%2Ffiles%2Fv0%2Fb%2Fgitbook-legacy-files%2Fo%2Fassets%252F-MKZSsJBtSP9L4sqIe_q%252F-MP9WizlMGepocaibx8N%252F-MP9gDLJhqXmnvyF5sDe%252FTCG_Load.png%3Falt%3Dmedia%26token%3De89639a1-1166-4cd3-9f54-8f892e7a2fb1&#x26;width=768&#x26;dpr=4&#x26;quality=100&#x26;sign=1d83034e&#x26;sv=1" alt=""><figcaption></figcaption></figure>

*Kontext Menü:*

* Laden: damit kann eine gespeicherte Vorlage geladen werden.
* Speichern: Wurde z.B. an der aktuellen Darstellung der ListChartgruppe etwas geändert (neuer Indikator, anderer Farbe usw.) so können diese Änderungen in die Vorlage gespeichert werden.
* Speichern unter: Eine neue Vorlage kann damit angelegt werden.
* Als Standard speichern: hier wird die Vorlage als Standard gespeichert. Wählt man bei der Erstellung der ListChartGruppe keine Vorlage aus, so werden diese Standard-Einstellungen herangezogen.
* Entfernen: löscht eine Vorlage.

Wählen Sie aus dem Kontextmenü **Load** und danach **Select...** aus, um die gewünschte TabChartGruppen-Vorlage auszuwählen.

<figure><img src="https://docs.agenatrader.com/~gitbook/image?url=https%3A%2F%2F1347375179-files.gitbook.io%2F%7E%2Ffiles%2Fv0%2Fb%2Fgitbook-legacy-files%2Fo%2Fassets%252F-MKZSsJBtSP9L4sqIe_q%252F-MP9WizlMGepocaibx8N%252F-MP9gHx0S2jARDoIAJZv%252FSelectTab.png%3Falt%3Dmedia%26token%3D09136a2d-d189-4c94-ad75-df42c13434c6&#x26;width=768&#x26;dpr=4&#x26;quality=100&#x26;sign=df3ce4c&#x26;sv=1" alt=""><figcaption></figcaption></figure>

Die TabChartGruppen-Vorlage kann auch bei der Neuanlage einer TabChartGruppe direkt ausgewählt werden.

<figure><img src="https://docs.agenatrader.com/~gitbook/image?url=https%3A%2F%2F1347375179-files.gitbook.io%2F%7E%2Ffiles%2Fv0%2Fb%2Fgitbook-legacy-files%2Fo%2Fassets%252F-MKZSsJBtSP9L4sqIe_q%252F-MP9WizlMGepocaibx8N%252F-MP9gKlvzAYHkZ4pDmlh%252FCreatTab.png%3Falt%3Dmedia%26token%3D6a2e2af8-4709-48fe-bb5a-7bc165cf7fc5&#x26;width=768&#x26;dpr=4&#x26;quality=100&#x26;sign=2f90349&#x26;sv=1" alt=""><figcaption></figcaption></figure>

### Synchronisieren (TCG) <a href="#synchronisieren_tcg" id="synchronisieren_tcg"></a>

Diese Menü-Funktion erscheint nur auf einem Chart in einer TabChart-Gruppe, sofern die Option **TabChart-Gruppe Autosynchronisation** im **Allgemeine Einstellungen -> Generell ->** [**Chart**](https://docs.agenatrader.com/v/german/menue-erklaerungen-and-inhalt/tool-menue/konfigurations-escort#chart) nicht gecheckt ist.

Wird diese Funktion vom Menü aus ausgewählt, so werden alle Einstellungen wie Farben, Zoom, Chartgrößen, SplitterBar-Positionen, usw. über alle sich im Container befindlichen Chartgruppen synchronisiert. Weiters werden alle Indikatoren bzw. Oszillatoren über die Chartgruppen im Container synchronisiert.

Ist im **Allgemeine Einstellungen** **TabChart-Gruppe Autosynchronisation** ausgewählt worden, so wird jede einzelne Veränderung sofort nach jeder Veränderung auf alle Chartgruppen innerhalb des Containers synchronisiert.

Falls eine Strategie läuft und man klickt auf **Synchronize** so wird abgefragt, ob die Strategie auch synchronisiert werden möchte.

<figure><img src="https://docs.agenatrader.com/~gitbook/image?url=https%3A%2F%2F1347375179-files.gitbook.io%2F%7E%2Ffiles%2Fv0%2Fb%2Fgitbook-legacy-files%2Fo%2Fassets%252F-MKZSsJBtSP9L4sqIe_q%252F-MP9WizlMGepocaibx8N%252F-MP9gP6n6LST3MD4-OI2%252FTCG_synchronize1.png%3Falt%3Dmedia%26token%3D5de24a07-a73e-446f-adb5-164aeaa64d38&#x26;width=768&#x26;dpr=4&#x26;quality=100&#x26;sign=493d1472&#x26;sv=1" alt=""><figcaption></figcaption></figure>

## <img src="/files/QmH3TXbR0b4uw2oGUg7G" alt="" data-size="line"> Chart Vorlagen

Mit einer Chart-Vorlage kann man das Aussehen eines Charts abspeichern und anschließend auf andere Charts, durch ein Laden der Vorlage, übertragen.

Speichert man eine Chart-Vorlage so werden u.a. folgende Chart-Einstellungen abgelegt:

| Symbol                                                                                                                                                                                                                                                                                                                                                                                             | Feature                                                                                                                                 | Vorlage speichern                                                                                                                                                                                                                                                                                                                                                                                |   |
| -------------------------------------------------------------------------------------------------------------------------------------------------------------------------------------------------------------------------------------------------------------------------------------------------------------------------------------------------------------------------------------------------- | --------------------------------------------------------------------------------------------------------------------------------------- | ------------------------------------------------------------------------------------------------------------------------------------------------------------------------------------------------------------------------------------------------------------------------------------------------------------------------------------------------------------------------------------------------ | - |
| -                                                                                                                                                                                                                                                                                                                                                                                                  | [AktionBar Einstellung](https://docs.agenatrader.com/v/german/menue-erklaerungen-and-inhalt/tool-menue/konfigurations-escort#actionbar) | ![Blue Checkmark Ms](https://docs.agenatrader.com/~gitbook/image?url=https%3A%2F%2F1347375179-files.gitbook.io%2F%7E%2Ffiles%2Fv0%2Fb%2Fgitbook-legacy-files%2Fo%2Fassets%252F-MKZSsJBtSP9L4sqIe_q%252F-MP9WizlMGepocaibx8N%252F-MP9f0QADTzU2G_TrecR%252Fblue_checkmark_ms.png%3Falt%3Dmedia%26token%3D1e3023c3-2922-4a3c-aec6-b3e42d0019f9\&width=300\&dpr=4\&quality=100\&sign=5b4e90a1\&sv=1) |   |
| <img src="/files/2yuJ7IsXDh8F21nLku5A" alt="" data-size="line">                                                                                                                                                                                                                                                                                                                                    | Bar timer                                                                                                                               | ![Blue Checkmark Ms](https://docs.agenatrader.com/~gitbook/image?url=https%3A%2F%2F1347375179-files.gitbook.io%2F%7E%2Ffiles%2Fv0%2Fb%2Fgitbook-legacy-files%2Fo%2Fassets%252F-MKZSsJBtSP9L4sqIe_q%252F-MP9WizlMGepocaibx8N%252F-MP9f0QADTzU2G_TrecR%252Fblue_checkmark_ms.png%3Falt%3Dmedia%26token%3D1e3023c3-2922-4a3c-aec6-b3e42d0019f9\&width=300\&dpr=4\&quality=100\&sign=5b4e90a1\&sv=1) |   |
| <img src="/files/KcVEAQ8xwIXXhP8Z2ENu" alt="" data-size="line">                                                                                                                                                                                                                                                                                                                                    | Chart-Netz                                                                                                                              | ![Blue Checkmark Ms](https://docs.agenatrader.com/~gitbook/image?url=https%3A%2F%2F1347375179-files.gitbook.io%2F%7E%2Ffiles%2Fv0%2Fb%2Fgitbook-legacy-files%2Fo%2Fassets%252F-MKZSsJBtSP9L4sqIe_q%252F-MP9WizlMGepocaibx8N%252F-MP9f0QADTzU2G_TrecR%252Fblue_checkmark_ms.png%3Falt%3Dmedia%26token%3D1e3023c3-2922-4a3c-aec6-b3e42d0019f9\&width=300\&dpr=4\&quality=100\&sign=5b4e90a1\&sv=1) |   |
| <img src="/files/NRGmyGE2Yo9b3vZGoU8F" alt="" data-size="line">                                                                                                                                                                                                                                                                                                                                    | DOM                                                                                                                                     | -                                                                                                                                                                                                                                                                                                                                                                                                |   |
| <img src="/files/Xu6Eh7BB79wE0tkeeHR6" alt="" data-size="line">                                                                                                                                                                                                                                                                                                                                    | Farbe                                                                                                                                   | ![Blue Checkmark Ms](https://docs.agenatrader.com/~gitbook/image?url=https%3A%2F%2F1347375179-files.gitbook.io%2F%7E%2Ffiles%2Fv0%2Fb%2Fgitbook-legacy-files%2Fo%2Fassets%252F-MKZSsJBtSP9L4sqIe_q%252F-MP9WizlMGepocaibx8N%252F-MP9f0QADTzU2G_TrecR%252Fblue_checkmark_ms.png%3Falt%3Dmedia%26token%3D1e3023c3-2922-4a3c-aec6-b3e42d0019f9\&width=300\&dpr=4\&quality=100\&sign=5b4e90a1\&sv=1) |   |
| <img src="/files/MXIeMXRgN6BAXUU5V6gb" alt="" data-size="line">                                                                                                                                                                                                                                                                                                                                    | Indicatoren                                                                                                                             | ![Blue Checkmark Ms](https://docs.agenatrader.com/~gitbook/image?url=https%3A%2F%2F1347375179-files.gitbook.io%2F%7E%2Ffiles%2Fv0%2Fb%2Fgitbook-legacy-files%2Fo%2Fassets%252F-MKZSsJBtSP9L4sqIe_q%252F-MP9WizlMGepocaibx8N%252F-MP9f0QADTzU2G_TrecR%252Fblue_checkmark_ms.png%3Falt%3Dmedia%26token%3D1e3023c3-2922-4a3c-aec6-b3e42d0019f9\&width=300\&dpr=4\&quality=100\&sign=5b4e90a1\&sv=1) |   |
| ![Es](https://docs.agenatrader.com/~gitbook/image?url=https%3A%2F%2F1347375179-files.gitbook.io%2F%7E%2Ffiles%2Fv0%2Fb%2Fgitbook-legacy-files%2Fo%2Fassets%252F-MKZSsJBtSP9L4sqIe_q%252F-MP9P3vFZH_eTVbqUMdh%252F-MP9P73YPqyaXat_aQGc%252Fes.png%3Falt%3Dmedia%26token%3D10a51f78-7994-40ab-8481-a9d296524f22\&width=300\&dpr=4\&quality=100\&sign=357241be\&sv=1)                                 | Instrument                                                                                                                              | -                                                                                                                                                                                                                                                                                                                                                                                                |   |
| <img src="/files/4CHX1Foo6SUo6rYlx1Dw" alt="" data-size="line">                                                                                                                                                                                                                                                                                                                                    | Komplete Historie anzeigen                                                                                                              | -                                                                                                                                                                                                                                                                                                                                                                                                |   |
| <img src="/files/96oUseBaUvaUTsPxDW3P" alt="" data-size="line">                                                                                                                                                                                                                                                                                                                                    | Location Point                                                                                                                          | -                                                                                                                                                                                                                                                                                                                                                                                                |   |
| <img src="/files/YrN5H7sqQzfuyTAaKVhM" alt="" data-size="line">                                                                                                                                                                                                                                                                                                                                    | Öffentlicher Modus                                                                                                                      | -                                                                                                                                                                                                                                                                                                                                                                                                |   |
| <img src="/files/PvEFVvoaeMftRa2zGlR3" alt="" data-size="line">                                                                                                                                                                                                                                                                                                                                    | Preis style                                                                                                                             | ![Blue Checkmark Ms](https://docs.agenatrader.com/~gitbook/image?url=https%3A%2F%2F1347375179-files.gitbook.io%2F%7E%2Ffiles%2Fv0%2Fb%2Fgitbook-legacy-files%2Fo%2Fassets%252F-MKZSsJBtSP9L4sqIe_q%252F-MP9WizlMGepocaibx8N%252F-MP9f0QADTzU2G_TrecR%252Fblue_checkmark_ms.png%3Falt%3Dmedia%26token%3D1e3023c3-2922-4a3c-aec6-b3e42d0019f9\&width=300\&dpr=4\&quality=100\&sign=5b4e90a1\&sv=1) |   |
| <img src="/files/6MEPszimzRcky0WAxA6H" alt="" data-size="line">                                                                                                                                                                                                                                                                                                                                    | Preismarkierungen Linien                                                                                                                | ![Blue Checkmark Ms](https://docs.agenatrader.com/~gitbook/image?url=https%3A%2F%2F1347375179-files.gitbook.io%2F%7E%2Ffiles%2Fv0%2Fb%2Fgitbook-legacy-files%2Fo%2Fassets%252F-MKZSsJBtSP9L4sqIe_q%252F-MP9WizlMGepocaibx8N%252F-MP9f0QADTzU2G_TrecR%252Fblue_checkmark_ms.png%3Falt%3Dmedia%26token%3D1e3023c3-2922-4a3c-aec6-b3e42d0019f9\&width=300\&dpr=4\&quality=100\&sign=5b4e90a1\&sv=1) |   |
| ![Quicktrader Button](https://docs.agenatrader.com/~gitbook/image?url=https%3A%2F%2F1347375179-files.gitbook.io%2F%7E%2Ffiles%2Fv0%2Fb%2Fgitbook-legacy-files%2Fo%2Fassets%252F-MKZSsJBtSP9L4sqIe_q%252F-MP9WizlMGepocaibx8N%252F-MP9dyUH9J2wX53XpT8a%252Fquicktrader_button.png%3Falt%3Dmedia%26token%3D121125f9-1d39-4e29-b9d3-75c3bb0f2e4a\&width=300\&dpr=4\&quality=100\&sign=aa4ccb10\&sv=1) | Quick Trader                                                                                                                            | -                                                                                                                                                                                                                                                                                                                                                                                                |   |
| ![Icon8](https://docs.agenatrader.com/~gitbook/image?url=https%3A%2F%2F1347375179-files.gitbook.io%2F%7E%2Ffiles%2Fv0%2Fb%2Fgitbook-legacy-files%2Fo%2Fassets%252F-MKZSsJBtSP9L4sqIe_q%252F-MP9WizlMGepocaibx8N%252F-MP9e2uNohzNYUWHo7aX%252Ficon8.png%3Falt%3Dmedia%26token%3Df5b0a069-68df-400e-8c03-5a05462bc0ad\&width=300\&dpr=4\&quality=100\&sign=4037bd12\&sv=1)                           | Rein/Raus-Zoomen                                                                                                                        | ![Blue Checkmark Ms](https://docs.agenatrader.com/~gitbook/image?url=https%3A%2F%2F1347375179-files.gitbook.io%2F%7E%2Ffiles%2Fv0%2Fb%2Fgitbook-legacy-files%2Fo%2Fassets%252F-MKZSsJBtSP9L4sqIe_q%252F-MP9WizlMGepocaibx8N%252F-MP9f0QADTzU2G_TrecR%252Fblue_checkmark_ms.png%3Falt%3Dmedia%26token%3D1e3023c3-2922-4a3c-aec6-b3e42d0019f9\&width=300\&dpr=4\&quality=100\&sign=5b4e90a1\&sv=1) |   |
| <img src="/files/TL1EqB2DPmbBPGhfYQkM" alt="" data-size="line">                                                                                                                                                                                                                                                                                                                                    | Start AT++                                                                                                                              | -                                                                                                                                                                                                                                                                                                                                                                                                |   |
| <img src="/files/rjFt5Ak3ZNBCLPbi5BWT" alt="" data-size="line">                                                                                                                                                                                                                                                                                                                                    | Strategien                                                                                                                              | -                                                                                                                                                                                                                                                                                                                                                                                                |   |
| <img src="/files/1rrOKVWOfrbqC6gWdCrN" alt="" data-size="line">                                                                                                                                                                                                                                                                                                                                    | Trade Visualisierung                                                                                                                    | ![Blue Checkmark Ms](https://docs.agenatrader.com/~gitbook/image?url=https%3A%2F%2F1347375179-files.gitbook.io%2F%7E%2Ffiles%2Fv0%2Fb%2Fgitbook-legacy-files%2Fo%2Fassets%252F-MKZSsJBtSP9L4sqIe_q%252F-MP9WizlMGepocaibx8N%252F-MP9f0QADTzU2G_TrecR%252Fblue_checkmark_ms.png%3Falt%3Dmedia%26token%3D1e3023c3-2922-4a3c-aec6-b3e42d0019f9\&width=300\&dpr=4\&quality=100\&sign=5b4e90a1\&sv=1) |   |
| <img src="/files/9q7l5klJLo7NYXyEH77D" alt="" data-size="line">                                                                                                                                                                                                                                                                                                                                    | Trading pad                                                                                                                             | -                                                                                                                                                                                                                                                                                                                                                                                                |   |
| <img src="/files/f4n6wN9RmGwTnn67DWjY" alt="" data-size="line">                                                                                                                                                                                                                                                                                                                                    | Wechsel: allgemeine Handelszeit                                                                                                         | -                                                                                                                                                                                                                                                                                                                                                                                                |   |
| <img src="/files/WziMfnFHIwWR7e5NzP1Y" alt="" data-size="line">                                                                                                                                                                                                                                                                                                                                    | Zweite Datenserie                                                                                                                       | -                                                                                                                                                                                                                                                                                                                                                                                                |   |
| <img src="/files/yrb3UGys6zWpdvvIdys0" alt="" data-size="line">                                                                                                                                                                                                                                                                                                                                    | Zeichenwerkzeuge                                                                                                                        | -                                                                                                                                                                                                                                                                                                                                                                                                |   |
| <img src="/files/jTfXSKzSAFfblOK0cC0N" alt="" data-size="line">                                                                                                                                                                                                                                                                                                                                    | Zeiger                                                                                                                                  | ![Blue Checkmark Ms](https://docs.agenatrader.com/~gitbook/image?url=https%3A%2F%2F1347375179-files.gitbook.io%2F%7E%2Ffiles%2Fv0%2Fb%2Fgitbook-legacy-files%2Fo%2Fassets%252F-MKZSsJBtSP9L4sqIe_q%252F-MP9WizlMGepocaibx8N%252F-MP9f0QADTzU2G_TrecR%252Fblue_checkmark_ms.png%3Falt%3Dmedia%26token%3D1e3023c3-2922-4a3c-aec6-b3e42d0019f9\&width=300\&dpr=4\&quality=100\&sign=5b4e90a1\&sv=1) |   |
| ![Icon2](https://docs.agenatrader.com/~gitbook/image?url=https%3A%2F%2F1347375179-files.gitbook.io%2F%7E%2Ffiles%2Fv0%2Fb%2Fgitbook-legacy-files%2Fo%2Fassets%252F-MKZSsJBtSP9L4sqIe_q%252F-MP9P3vFZH_eTVbqUMdh%252F-MP9PFYGedXyenZtZ9We%252Ficon2.png%3Falt%3Dmedia%26token%3D7dfc4d18-ac59-46bd-abf6-dcf793379e07\&width=300\&dpr=4\&quality=100\&sign=cd8593da\&sv=1)                           | Zeiteinheit                                                                                                                             | -                                                                                                                                                                                                                                                                                                                                                                                                |   |

Da Zeichenwerkzeuge Instrumenten-spezifisch sind, werden diese nicht in eine Vorlage mit aufgenommen.

<figure><img src="https://docs.agenatrader.com/~gitbook/image?url=https%3A%2F%2F1347375179-files.gitbook.io%2F%7E%2Ffiles%2Fv0%2Fb%2Fgitbook-legacy-files%2Fo%2Fassets%252F-MKZSsJBtSP9L4sqIe_q%252F-MP9hCcwEY3GiB8M11YV%252F-MP9ivD1INpK3gk4_4x-%252Fchart.png%3Falt%3Dmedia%26token%3D2a9b8b21-e7f1-4de2-a1aa-51095c58cbc3&#x26;width=768&#x26;dpr=4&#x26;quality=100&#x26;sign=763af899&#x26;sv=1" alt=""><figcaption></figcaption></figure>

*Möchte man eine Vorlage-Liste öffen so funktioniert dies:*

1. Mit einem Linksklick auf das Symbol <img src="/files/QmH3TXbR0b4uw2oGUg7G" alt="" data-size="line"> in der Chart-Toolbar oder
2. Mit einem Rechtsklick in einem Chart und danach **Einstellungen -> Chart Vorlage -> Lade**.

<figure><img src="https://docs.agenatrader.com/~gitbook/image?url=https%3A%2F%2F1347375179-files.gitbook.io%2F%7E%2Ffiles%2Fv0%2Fb%2Fgitbook-legacy-files%2Fo%2Fassets%252F-MKZSsJBtSP9L4sqIe_q%252F-MP9hCcwEY3GiB8M11YV%252F-MP9j0nseLPXveh7IkE8%252Ftemplate.png%3Falt%3Dmedia%26token%3Dc6fbb0ae-6eea-4ad3-b54f-c8a4b739c3ae&#x26;width=768&#x26;dpr=4&#x26;quality=100&#x26;sign=3e6efe6b&#x26;sv=1" alt=""><figcaption></figcaption></figure>

Möchte man eine gespeicherte Chart-Vorlage laden, muss man diese aus der Liste auswählen.

<figure><img src="https://docs.agenatrader.com/~gitbook/image?url=https%3A%2F%2F1347375179-files.gitbook.io%2F%7E%2Ffiles%2Fv0%2Fb%2Fgitbook-legacy-files%2Fo%2Fassets%252F-MKZSsJBtSP9L4sqIe_q%252F-MP9hCcwEY3GiB8M11YV%252F-MP9j3f6uWDKoGi7bFJV%252Fcontext.png%3Falt%3Dmedia%26token%3Dda5d9e10-ce1c-4fd8-86fb-ba50f15a7f3a&#x26;width=768&#x26;dpr=4&#x26;quality=100&#x26;sign=e4adb26&#x26;sv=1" alt=""><figcaption></figcaption></figure>

Wählen Sie aus dem Kontextmenü **Lade** und danach **Select...**, um die Auswahlfenster für Vorlagen zu öffnen.

<figure><img src="https://docs.agenatrader.com/~gitbook/image?url=https%3A%2F%2F1347375179-files.gitbook.io%2F%7E%2Ffiles%2Fv0%2Fb%2Fgitbook-legacy-files%2Fo%2Fassets%252F-MKZSsJBtSP9L4sqIe_q%252F-MP9hCcwEY3GiB8M11YV%252F-MP9j6mjlH_gZr_Xk4zm%252FSelectTemplateCreateChart.png%3Falt%3Dmedia%26token%3Dcaefcdce-f262-4b3d-8ee8-0d724e1ebab6&#x26;width=768&#x26;dpr=4&#x26;quality=100&#x26;sign=9425ca50&#x26;sv=1" alt=""><figcaption></figcaption></figure>

Die Chart-Vorlage kann auch beim Neuanlegen eines Charts direkt ausgewählt werden:

<figure><img src="https://docs.agenatrader.com/~gitbook/image?url=https%3A%2F%2F1347375179-files.gitbook.io%2F%7E%2Ffiles%2Fv0%2Fb%2Fgitbook-legacy-files%2Fo%2Fassets%252F-MKZSsJBtSP9L4sqIe_q%252F-MP9hCcwEY3GiB8M11YV%252F-MP9j9TYNc2Xyhdvq4Ed%252FCreateChart.png%3Falt%3Dmedia%26token%3D3831abad-cca4-467f-b7bf-b7a153768a1f&#x26;width=768&#x26;dpr=4&#x26;quality=100&#x26;sign=ed39fdf6&#x26;sv=1" alt=""><figcaption></figcaption></figure>

## <img src="/files/2szYfrz037dEx9N5H47u" alt="" data-size="line"> Zu Instrumentliste hinzufügen

Das gegenwärtige Instrument am Chart kann in eine bestehende Instrumentliste folgendermaßen eingefügt werden:

* Ein Klick mit der linken Maustaste auf das Symbol <img src="/files/2szYfrz037dEx9N5H47u" alt="" data-size="line"> in der Chart-Toolbar oder
* Klicken Sie mit der rechten Maustaste in den Chart und wählen Sie **Einstellungen -> Zu Instrumentliste hinzufügen** aus.

<figure><img src="https://docs.agenatrader.com/~gitbook/image?url=https%3A%2F%2F1347375179-files.gitbook.io%2F%7E%2Ffiles%2Fv0%2Fb%2Fgitbook-legacy-files%2Fo%2Fassets%252F-MKZSsJBtSP9L4sqIe_q%252F-MP9jBfff_q-RNYzAWcG%252F-MP9jJIZMamPUYhfNFIF%252FAdd_toUnstrumentList.png%3Falt%3Dmedia%26token%3Dafed0db3-4b65-4b0b-8323-bf396ad16f36&#x26;width=768&#x26;dpr=4&#x26;quality=100&#x26;sign=4e4318e4&#x26;sv=1" alt=""><figcaption></figcaption></figure>

Diese Instrumentlisten können über den [Instrument-Editor](https://docs.agenatrader.com/v/german/menue-erklaerungen-and-inhalt/tool-menue/instrument-escort) verwaltet werden.

## <img src="/files/3hrPwzTCFordKzNTnlHk" alt="" data-size="line"> Chart-Netz

Über die Grid-Funktion kann man die horizontalen, die vertikalen und die Tagesende Grid-Linien im Chart ein- bzw. ausschalten.

*Öffnen sie die ChartNetz-Optionen wie folgt:*

1. Ein Klick auf das Symbol <img src="/files/3hrPwzTCFordKzNTnlHk" alt="" data-size="line"> in der Chart-Toolbar oder
2. Klicken Sie mit der rechten Maustaste in den Chart und wählen Sie **Einstellungen -> Chatz-Netz** aus.

<figure><img src="https://docs.agenatrader.com/~gitbook/image?url=https%3A%2F%2F1347375179-files.gitbook.io%2F%7E%2Ffiles%2Fv0%2Fb%2Fgitbook-legacy-files%2Fo%2Fassets%252F-MKZSsJBtSP9L4sqIe_q%252F-MP9jBfff_q-RNYzAWcG%252F-MP9jW-T9J8-vACznYvv%252FchartGrid.png%3Falt%3Dmedia%26token%3D97131100-ea43-4789-940a-e5ff3a080cc8&#x26;width=768&#x26;dpr=4&#x26;quality=100&#x26;sign=2d4b7d20&#x26;sv=1" alt=""><figcaption></figcaption></figure>

## <img src="/files/oDNdMeZSs7h4xFkrrcCo" alt="" data-size="line"> Preismarkierungen Linien

*Öffnen sie die Markierungsoptionen wie folgt:*

1. Ein Klick auf das Symbol <img src="/files/oDNdMeZSs7h4xFkrrcCo" alt="" data-size="line"> in der Chart-Toolbar oder
2. Klicken Sie mit der rechten Maustaste in den Chart und wählen Sie **Einstellungen -> Preismarkierungen** aus.

Die folgenden Einstellungen sind verfügbar:

* Preismarkierung anzeigen: mit dieser Option kann man die Preismarkierung ein- oder ausblenden.
* Preislinie anzeigen: man kann die Preislinie ein- oder ausblenden. Die Preislinie richtet sich immer nach dem Last-Preis, sofern das Instrument einen solchen liefert.
* Preisalarm-Linien anzeigen: Anzeige Preisalarm Linien auf einem Chart.
* Spread-Markierungen anzeigen: man kann die Spread-Markerierungen ein- oder ausblenden.
* Spread-Linien anzeigen: man kann die Spread-Linien ein- oder ausblenden.

<figure><img src="https://docs.agenatrader.com/~gitbook/image?url=https%3A%2F%2F1347375179-files.gitbook.io%2F%7E%2Ffiles%2Fv0%2Fb%2Fgitbook-legacy-files%2Fo%2Fassets%252F-MKZSsJBtSP9L4sqIe_q%252F-MP9jBfff_q-RNYzAWcG%252F-MP9jchqN-eOvRxX6Y2L%252Fprice%2520markers.png%3Falt%3Dmedia%26token%3D2faf0806-da4e-4a98-ae2b-4609b0929500&#x26;width=768&#x26;dpr=4&#x26;quality=100&#x26;sign=f1464f20&#x26;sv=1" alt=""><figcaption></figcaption></figure>

Die**Ask-Linie bzw. der Ask-Marker** wird standardmäßig in Grün dargestellt. Die**Bid-Linie bzw. der Bid-Marker** wird standardmäßig in Rot dargestellt.

Weiter [Farbeinstellungen](https://docs.agenatrader.com/v/german/menue-erklaerungen-and-inhalt/hauptmenue/chart-toolbar/farbe) können vorgenommen werden.

<figure><img src="https://docs.agenatrader.com/~gitbook/image?url=https%3A%2F%2F1347375179-files.gitbook.io%2F%7E%2Ffiles%2Fv0%2Fb%2Fgitbook-legacy-files%2Fo%2Fassets%252F-MKZSsJBtSP9L4sqIe_q%252F-MP9jBfff_q-RNYzAWcG%252F-MP9jfWZ49r8OiECr9dU%252Fpreismarkierungen_DE.png%3Falt%3Dmedia%26token%3D880a10c9-411d-4ada-87a1-c6432d2451ed&#x26;width=768&#x26;dpr=4&#x26;quality=100&#x26;sign=9d760da1&#x26;sv=1" alt=""><figcaption></figcaption></figure>

Kurzer Hinweis, um die Begriffe "ASK / VERKÄUFER / BRIEF" & "BID / KÄUFER / GELD" in Zusammenhang zu bringen.

Wenn Sie z.B. **Market Long** gehen, dann kaufen Sie zum **"ASK"** Preis (Ihnen tritt ein "VERKÄUFER" gegenüber, sie bekommen einen "BRIEF" dafür). Wenn Sie dann diesen Wert wieder verkaufen wollen, verkaufen Sie Ihn zum **"BID"** Preis (Ihnen tritt ein "KÄUFER" gegenüber, Sie bekommen "GELD")

<figure><img src="https://docs.agenatrader.com/~gitbook/image?url=https%3A%2F%2F1347375179-files.gitbook.io%2F%7E%2Ffiles%2Fv0%2Fb%2Fgitbook-legacy-files%2Fo%2Fassets%252F-MKZSsJBtSP9L4sqIe_q%252F-MP9jBfff_q-RNYzAWcG%252F-MP9jiPY4bb8L-H2nU7H%252FPrice%2520markers2.png%3Falt%3Dmedia%26token%3D347bd396-327b-403e-85f2-ec8642c90763&#x26;width=768&#x26;dpr=4&#x26;quality=100&#x26;sign=bf37d645&#x26;sv=1" alt=""><figcaption></figcaption></figure>

## <img src="/files/haPnhJ2dwRXcHOYBwn3X" alt="" data-size="line"> Trade Visualisierung

*Die TradeVisualisierung-Optionen können folgendermaßen geöffnet werden:*

1. Ein Klick auf das Symbol <img src="/files/haPnhJ2dwRXcHOYBwn3X" alt="" data-size="line"> in der Chart-Toolbar oder
2. Klicken Sie mit der rechten Maustaste in den Chart und wählen Sie **Einstellungen -> Trade Visualisierung** aus.

<figure><img src="https://docs.agenatrader.com/~gitbook/image?url=https%3A%2F%2F1347375179-files.gitbook.io%2F%7E%2Ffiles%2Fv0%2Fb%2Fgitbook-legacy-files%2Fo%2Fassets%252F-MKZSsJBtSP9L4sqIe_q%252F-MP9jBfff_q-RNYzAWcG%252F-MP9jqQT6RwIvwlJTWPW%252FTrade%2520visualization.png%3Falt%3Dmedia%26token%3D1af30130-f2c5-4fcf-9659-adaff89a2ad7&#x26;width=768&#x26;dpr=4&#x26;quality=100&#x26;sign=db7c824f&#x26;sv=1" alt=""><figcaption></figcaption></figure>

**Über die Trade-Visualisierung kann folgendes eingestellt werden:**

* Traderbars anzeigen: hiermit kann festgelegt werden, ob die CharttraderBars im selektierten Chart angezeigt werden sollen. Wenn deaktiviert, dann sehen Sie eine entsprechende Anmerkung am linken unteren Rand des Charts:

&#x20;​​

<figure><img src="https://docs.agenatrader.com/~gitbook/image?url=https%3A%2F%2F1347375179-files.gitbook.io%2F%7E%2Ffiles%2Fv0%2Fb%2Fgitbook-legacy-files%2Fo%2Fassets%252F-MKZSsJBtSP9L4sqIe_q%252F-MP9jBfff_q-RNYzAWcG%252F-MP9junoWrdW6x8Gbq24%252FOrderbar.png%3Falt%3Dmedia%26token%3Dcb509a29-5fb9-4ae3-9e33-e270299841f6&#x26;width=300&#x26;dpr=4&#x26;quality=100&#x26;sign=308e9c96&#x26;sv=1" alt=""><figcaption></figcaption></figure>

* Ein-/Ausstiegsmarkierungen:
  * grüne aufwärts gerichtete Pfeile stellen Kauf Orders dar;
  * rote abwärts gerichtete Pfeile stellen Verkaufs Orders dar.
* Trade-Linien: ob die Einstiegs- und Ausstiegsmarken mit Linien verbunden werden sollen (können nur angezeigt werden, wenn Ein-/Ausstiegsmarkierungen ebenfalls angezeigt werden):
  * rote Linien kennzeichnen Verlust-Trades;
  * grüne Linien stellen GewinnTrades dar.
* Show Executions: Wenn das Feature aktiv ist, dann sehen Sie für jede Ausführung die Sie vom Broker erhalten haben einen Text „Ordergröße @ Preis“ (z.B. 50 @ 78,52).
* Stop-Linien: ob Stop-Linien (HardTrail und SoftTrail) am Chart sichtbar sein sollen. Diese Funktionalität kommt erst ab AgenaTrader++ zur Anwendung.

<figure><img src="https://docs.agenatrader.com/~gitbook/image?url=https%3A%2F%2F1347375179-files.gitbook.io%2F%7E%2Ffiles%2Fv0%2Fb%2Fgitbook-legacy-files%2Fo%2Fassets%252F-MKZSsJBtSP9L4sqIe_q%252F-MP9jBfff_q-RNYzAWcG%252F-MP9jxW3XNF1wzynOIF5%252FMarekrs.jpg%3Falt%3Dmedia%26token%3D25b2658a-cd91-420e-b9e6-6379de41d583&#x26;width=768&#x26;dpr=4&#x26;quality=100&#x26;sign=6a0c317b&#x26;sv=1" alt=""><figcaption></figcaption></figure>

### Ausführungen anzeigen <a href="#show_executions" id="show_executions"></a>

Wenn das Feature „Ausführungen anzeigen – Show Executions“ aktiv ist, dann sehen Sie für jede Ausführung die Sie vom Broker erhalten haben einen Text „Ordergröße @ Preis“ (z.B. 50 @ 78,52). Sie können diese Preise mit dem Ausführungsmanager im Trading Center vergleichen. Jetzt sehen Sie sehr übersichtlich, bereits im Chart, zu welchen Preisen Sie Ihre Position aufgebaut haben und können einen Gewinn oder Verlust besser einschätzen und Ihre Strategie dementsprechend anpassen.

<figure><img src="https://docs.agenatrader.com/~gitbook/image?url=https%3A%2F%2F1347375179-files.gitbook.io%2F%7E%2Ffiles%2Fv0%2Fb%2Fgitbook-legacy-files%2Fo%2Fassets%252F-MKZSsJBtSP9L4sqIe_q%252F-MP9jBfff_q-RNYzAWcG%252F-MP9k0hcfVqFYdPUdEq4%252Fexecutions.png%3Falt%3Dmedia%26token%3Dfab52268-2247-4d62-b248-8f7571aa9f56&#x26;width=768&#x26;dpr=4&#x26;quality=100&#x26;sign=4cf6fe75&#x26;sv=1" alt=""><figcaption></figcaption></figure>

### Chart trader bar <a href="#chart_trader_bar" id="chart_trader_bar"></a>

Die Gewinn und Verlust Anzeige errechnet ebenfalls bereits den möglichen Gewinn oder Verlust, wenn Sie zum aktuellen Preis aus dem Markt aussteigen. Beachten Sie jedoch, dass wir nicht mit einkalkuliert haben, welche Ausführungen Sie beim Ausstieg erhalten werden und der Gewinn und Verlust dennoch leicht abweichen kann.

<figure><img src="https://docs.agenatrader.com/~gitbook/image?url=https%3A%2F%2F1347375179-files.gitbook.io%2F%7E%2Ffiles%2Fv0%2Fb%2Fgitbook-legacy-files%2Fo%2Fassets%252F-MKZSsJBtSP9L4sqIe_q%252F-MP9jBfff_q-RNYzAWcG%252F-MP9k3YNEv2OfZXz4I0P%252FChart%2520trader%2520bar.png%3Falt%3Dmedia%26token%3D54938249-7b31-4ab0-b3be-24c5fe7ae7e1&#x26;width=768&#x26;dpr=4&#x26;quality=100&#x26;sign=cbd399ae&#x26;sv=1" alt=""><figcaption></figcaption></figure>

### Entry/Exit Chart Markierungen und Trade Linien <a href="#entry_exit_chart_markierungen_und_trade_linien" id="entry_exit_chart_markierungen_und_trade_linien"></a>

Wenn Sie die Entry/Exit Chart Markierungen aktivieren, dann wird Ihnen auffallen, dass die Einstieg Chart Markierung zwar am richtigen Zeitpunkt stehen bleibt (Y Achse), jedoch sich ähnlich wie der Chart Traderbar verschiebt. Wir berechnen für alle Ausführungen, die Sie im Laufe der Position erhalten, wiederum den Durschnittspreis und lassen diesen Preis mit den Entry Chart Markierungen anzeigen. Sie werden sehen, dass der Pfeil oftmals in der Luft schweben wird und sich weit weg von den Chart Kursen befindet.

<figure><img src="https://docs.agenatrader.com/~gitbook/image?url=https%3A%2F%2F1347375179-files.gitbook.io%2F%7E%2Ffiles%2Fv0%2Fb%2Fgitbook-legacy-files%2Fo%2Fassets%252F-MKZSsJBtSP9L4sqIe_q%252F-MP9jBfff_q-RNYzAWcG%252F-MP9k6dXTnpPt4RDv4At%252Fchart%2520entry.png%3Falt%3Dmedia%26token%3D3050cc69-5200-48d1-b4e2-dfe7de3c44ec&#x26;width=768&#x26;dpr=4&#x26;quality=100&#x26;sign=ce662ca6&#x26;sv=1" alt=""><figcaption></figcaption></figure>

Die grünen Linien zeigen Ihnen die Gewinne der Teilpositionen an und die roten Linien die Verluste. Der rote (Short) Einstiegspfeil liegt genau am Zeitpunkt der Positionseröffnung jedoch fast 1 Euro unter dem Einstiegskurs. Sie sehen hier einen Durschnittspreis aller Ausführungen (Short) und multiple Exit Chart Markierungen.

<figure><img src="https://docs.agenatrader.com/~gitbook/image?url=https%3A%2F%2F1347375179-files.gitbook.io%2F%7E%2Ffiles%2Fv0%2Fb%2Fgitbook-legacy-files%2Fo%2Fassets%252F-MKZSsJBtSP9L4sqIe_q%252F-MP9jBfff_q-RNYzAWcG%252F-MP9k9yVsD5Nil1zoBtW%252Fchart%2520entry%2520green%2520line.png%3Falt%3Dmedia%26token%3D5feeaf42-a079-4421-8bb2-e0c938ab4fa3&#x26;width=768&#x26;dpr=4&#x26;quality=100&#x26;sign=fbc7b4c2&#x26;sv=1" alt=""><figcaption></figcaption></figure>

## <img src="/files/13tdUuzYy4LTxWv7bs3j" alt="" data-size="line"> Als Bild speichern

*Ein Abzug des Charts kann folgendermaßen gespeichert werden:*

1. Ein Klick auf das Symbol <img src="/files/13tdUuzYy4LTxWv7bs3j" alt="" data-size="line"> in der Chart-Toolbar oder
2. Klicken Sie mit der rechten Maustaste in den Chart und wählen Sie **Einstellungen -> Als Bild speichern** aus.

<figure><img src="https://docs.agenatrader.com/~gitbook/image?url=https%3A%2F%2F1347375179-files.gitbook.io%2F%7E%2Ffiles%2Fv0%2Fb%2Fgitbook-legacy-files%2Fo%2Fassets%252F-MKZSsJBtSP9L4sqIe_q%252F-MP9kDT9zA2O-o1q3pIu%252F-MP9qek04cxmwmvlMmKn%252Fsave%2520as%2520image.png%3Falt%3Dmedia%26token%3D7a4a4aa1-f0a1-48f1-9dca-9fc5d68bb876&#x26;width=768&#x26;dpr=4&#x26;quality=100&#x26;sign=2c05005f&#x26;sv=1" alt=""><figcaption></figcaption></figure>

Einen kurzen Videobeitrag sehen Sie im [Chart-Vorlagen](https://docs.agenatrader.com/v/german/menue-erklaerungen-and-inhalt/hauptmenue/chart-toolbar/chart-vorlagen).

## <img src="/files/VLsAprKL5gUamuBBEq81" alt="" data-size="line"> Drucken

*Öffnen Sie den Druck-Dialog, wodurch Sie dann Ihr Chart ausdrucken lassen können, wie folgt:*

1. Ein Klick auf das Symbol <img src="/files/VLsAprKL5gUamuBBEq81" alt="" data-size="line"> in der Chart-Toolbar oder
2. Klicken Sie mit der rechten Maustaste in den Chart und wählen Sie **Einstellungen -> Drucken** aus.

<figure><img src="https://docs.agenatrader.com/~gitbook/image?url=https%3A%2F%2F1347375179-files.gitbook.io%2F%7E%2Ffiles%2Fv0%2Fb%2Fgitbook-legacy-files%2Fo%2Fassets%252F-MKZSsJBtSP9L4sqIe_q%252F-MP9kDT9zA2O-o1q3pIu%252F-MP9qrawatSehvvA91G4%252FChart_print.png%3Falt%3Dmedia%26token%3D214879fd-ade3-4567-a290-259981e79819&#x26;width=768&#x26;dpr=4&#x26;quality=100&#x26;sign=5cd3a512&#x26;sv=1" alt=""><figcaption></figcaption></figure>

Einen kurzen Videobeitrag sehen Sie im [Chart-Vorlagen](https://docs.agenatrader.com/v/german/menue-erklaerungen-and-inhalt/hauptmenue/chart-toolbar/chart-vorlagen).

## <img src="/files/SaFjzixdCBQ4UpfQ1Z5R" alt="" data-size="line"> Export nach MS-Excel

Diese Funktion ermöglicht es, historische Daten des jeweiligen Instruments in eine CSV-Datei zu exportieren (beschränkt durch die Anzahl der geladenen Kerzen bzw. des angegebenen Zeitraums am Chart).

*Exportieren Sie die Daten wie folgt:*

1. Ein Klick auf das Symbol <img src="/files/SaFjzixdCBQ4UpfQ1Z5R" alt="" data-size="line"> in der Chart-Toolbar oder
2. Klicken Sie mit der rechten Maustaste in den Chart und wählen Sie **Einstellungen -> Export nach MS-Excel** aus.

*Gespeichert werden unter anderem:*

* Timestamp
* Open
* High
* Low
* Close
* Diverse Indikatorenbezeichnungen mit Werten

## <img src="/files/Tn6dMx8nzi4tF3GtkmVr" alt="" data-size="line"> Farbe

*Es können unterschiedlichste Farb- bzw. Font-Einstellungen getroffen werden. Öffnen Sie die Optionen wie folgt:*

1. Ein Klick auf das Symbol <img src="/files/Tn6dMx8nzi4tF3GtkmVr" alt="" data-size="line"> in der Chart-Toolbar oder
2. Klicken Sie mit der rechten Maustaste in den Chart und wählen Sie **Einstellungen -> Farbe** aus.\ <br>

   <figure><img src="/files/on3BfPwN3nnHeFJBQEZh" alt=""><figcaption></figcaption></figure>

*Beschreibung der Funktionen:*

* Hintergrundfarbe: hier können Sie die Chart Hintergrundfarbe ändern.
* Verlaufende Farbe oben/untern: hier können Sie Ihre, für den Chart gewählte Hintergrundfarbe, von oben nach unten, Richtung weiß verlaufend, darstellen lassen.
* Verlaufende Farbe unten/oben: hier können Sie Ihre, für den Chart gewählte Hintergrundfarbe, von unten nach oben, Richtung weiß verlaufend, darstellen lassen.
* Datums Font: hier können Sie die Schriftart der Zeitachse ändern.
* Preis Font: hier können Sie die Schriftart der Preisachse ändern.
* Chart Font: hier können Sie die Schriftart des Charts ändern.
* Execution Font: hier können Sie die Schriftart des Execution ändern.
* X-Netzlinie: hier können Sie die Farbe der X-Netzlinie im Chart ändern.
* Chart-Netz Y Farbe: hier können Sie die Farbe der Y-Netzlinie im Chart ändern.
* Tagesumbruch-Linie Farbe: hier können Sie die Farbe der Tagesumbruch-Linie im Chart ändern.
* Candle Properties: Sie können zu den verschiedenen Periodendarstellungsmöglichkeiten unterschiedliche Einstellungen wie z.b. Auf- und Abwärtsfarben u. dgl. definieren.

<figure><img src="https://docs.agenatrader.com/~gitbook/image?url=https%3A%2F%2F1347375179-files.gitbook.io%2F%7E%2Ffiles%2Fv0%2Fb%2Fgitbook-legacy-files%2Fo%2Fassets%252F-MKZSsJBtSP9L4sqIe_q%252F-MP9kDT9zA2O-o1q3pIu%252F-MP9rGldksbV6D2Lk2T-%252FCandleProperties.png%3Falt%3Dmedia%26token%3Dee6af0bf-5d35-45df-b187-e74cb505d571&#x26;width=768&#x26;dpr=4&#x26;quality=100&#x26;sign=5b504437&#x26;sv=1" alt=""><figcaption></figcaption></figure>

* Show Candles At Front: wenn Sie diese Funktion aktivieren, wird der von Ihnen verwendete “PriceStyle” vor die Indikatoren gelegt. Alle Indikatoren werden hinter den Kerzen oder anderen Charttypen angezeigt.
* Show Bar Timer: hier können Sie den Bar Timer, welcher sich im Chart im unteren rechten Eck befindet, aktivieren. Er zeigt an, wie weit der aktuelle “PriceStyle” vorangeschritten ist.
* Preis Linien & Markierungen: hier können Sie die Preismarkierungen/-linien bzw. die ASK/BID Preismarkierungen/-linien einstellen.

<figure><img src="https://docs.agenatrader.com/~gitbook/image?url=https%3A%2F%2F1347375179-files.gitbook.io%2F%7E%2Ffiles%2Fv0%2Fb%2Fgitbook-legacy-files%2Fo%2Fassets%252F-MKZSsJBtSP9L4sqIe_q%252F-MP9kDT9zA2O-o1q3pIu%252F-MP9rJk8FHu3-wpFJQcp%252FPriceLines.png%3Falt%3Dmedia%26token%3D9139c237-8132-4d84-acf5-0e3c5cf34dd3&#x26;width=768&#x26;dpr=4&#x26;quality=100&#x26;sign=95c7abd&#x26;sv=1" alt=""><figcaption></figcaption></figure>

Nach Auswahl eines Menü-Eintrages öffnet sich der Farbauswahl-Dialog über den die Farbeinstellungen vorgenommen werden können:

<figure><img src="https://docs.agenatrader.com/~gitbook/image?url=https%3A%2F%2F1347375179-files.gitbook.io%2F%7E%2Ffiles%2Fv0%2Fb%2Fgitbook-legacy-files%2Fo%2Fassets%252F-MKZSsJBtSP9L4sqIe_q%252F-MP9kDT9zA2O-o1q3pIu%252F-MP9rMcZok6euf5r_YDD%252FColorPriceLines.png%3Falt%3Dmedia%26token%3Dd517e694-12ff-4c5e-b5d2-4e7d286470ea&#x26;width=768&#x26;dpr=4&#x26;quality=100&#x26;sign=d96f19cc&#x26;sv=1" alt=""><figcaption></figcaption></figure>

* QuickTrader settings: Einstellungen für QuickTrader anzeigen, z.B. Farbe

<figure><img src="https://docs.agenatrader.com/~gitbook/image?url=https%3A%2F%2F1347375179-files.gitbook.io%2F%7E%2Ffiles%2Fv0%2Fb%2Fgitbook-legacy-files%2Fo%2Fassets%252F-MKZSsJBtSP9L4sqIe_q%252F-MP9kDT9zA2O-o1q3pIu%252F-MP9rPP5a1nSg6jarLKW%252Fquicktrader.png%3Falt%3Dmedia%26token%3D0b6a4ce8-b1c9-43e6-a361-e76556d5367f&#x26;width=768&#x26;dpr=4&#x26;quality=100&#x26;sign=ac22b0d6&#x26;sv=1" alt=""><figcaption></figcaption></figure>

## <img src="/files/YBKlCfUk0RpUgiEjlXDN" alt="" data-size="line"> DOM Trading Pad

Sie können DOM als Trading Pad verwenden. *Das DOM kann folgendermaßen geöffnet werden:*

1. Ein Klick auf das Symbol <img src="/files/YBKlCfUk0RpUgiEjlXDN" alt="" data-size="line"> in der Chart-Toolbar oder
2. Klicken Sie mit der rechten Maustaste in den Chart und wählen Sie **Einstellungen -> DOM** aus.

Mehr zum DOM siehe im Kapitel [DOM](https://docs.agenatrader.com/v/german/menue-erklaerungen-and-inhalt/hauptmenue/depth-of-market-dom).


# Chart Menu

Rechtsklick ins Chart öffnet das Chart Menu:

<figure><img src="https://docs.agenatrader.com/~gitbook/image?url=https%3A%2F%2F1347375179-files.gitbook.io%2F%7E%2Ffiles%2Fv0%2Fb%2Fgitbook-legacy-files%2Fo%2Fassets%252F-MKZSsJBtSP9L4sqIe_q%252F-MP9kDT9zA2O-o1q3pIu%252F-MP9smaqfPPZX26wioLY%252FChartContext.jpg%3Falt%3Dmedia%26token%3D0c754046-f826-4c47-8cb6-aea92296983f&#x26;width=768&#x26;dpr=4&#x26;quality=100&#x26;sign=bd3b4cb7&#x26;sv=1" alt=""><figcaption></figcaption></figure>

## <img src="/files/k00C7HNUIsscYkCVNHzw" alt="" data-size="line">Daten neu laden

Durch diverse Umstände, kann es passieren, dass der Chart falsche Daten anzeigt (Fehl-Prints und ähnliches).

Mit **Daten neu laden** werden die Datenserien vom DatenFeed-Anbieter erneut geladen.

<figure><img src="https://docs.agenatrader.com/~gitbook/image?url=https%3A%2F%2F1347375179-files.gitbook.io%2F%7E%2Ffiles%2Fv0%2Fb%2Fgitbook-legacy-files%2Fo%2Fassets%252F-MKZSsJBtSP9L4sqIe_q%252F-MP9kDT9zA2O-o1q3pIu%252F-MP9uvRWXVroQwTuoYfw%252FchartMenuReloadData.png%3Falt%3Dmedia%26token%3D0740e185-be99-4e4a-881e-c9bbd9f2c18c&#x26;width=768&#x26;dpr=4&#x26;quality=100&#x26;sign=f985f829&#x26;sv=1" alt=""><figcaption></figcaption></figure>

## <img src="/files/KV5q8nQjgJPUesV6Wm7l" alt="" data-size="line"> Skripts neu laden

Diese Funktion erlaubt es, die Indikatoren neu zu berechnen.

Drücken Sie die rechte Maustaste im Chart und wählen **Skripts neu laden** aus.

<figure><img src="https://docs.agenatrader.com/~gitbook/image?url=https%3A%2F%2F1347375179-files.gitbook.io%2F%7E%2Ffiles%2Fv0%2Fb%2Fgitbook-legacy-files%2Fo%2Fassets%252F-MKZSsJBtSP9L4sqIe_q%252F-MP9kDT9zA2O-o1q3pIu%252F-MP9uzbvJscWmHRya4yG%252FchartMenuReloadScripts.png%3Falt%3Dmedia%26token%3D759e54bc-c2fe-4b0c-bf35-d83ad48c9be3&#x26;width=768&#x26;dpr=4&#x26;quality=100&#x26;sign=dcdad227&#x26;sv=1" alt=""><figcaption></figcaption></figure>

Einen kurzen Videobeitrag sehen Sie im Kapitel [Chart Menu: Daten neu laden](https://docs.agenatrader.com/v/german/menue-erklaerungen-and-inhalt/hauptmenue/chart-menu/daten-neu-laden).

## <img src="/files/C0jcdVoG96YajEQpmM6R" alt="" data-size="line"> Preis-Alarm hinzufügen

*Ein Preis-Alarm kann im* [*Preis-Alarm Manager*](https://docs.agenatrader.com/v/german/menue-erklaerungen-and-inhalt/tool-menue/alarme) *Tab folgendermaßen hinzugefügt werden:*

1. Mit dem Rechtsklick im Chart wählen Sie **Preis-Alarm hinzufügen** aus oder
2. Klicken Sie in der Hauptmenüleiste auf **Tools** und wählen dort **Alarme -> Preis Alarm** aus.

<figure><img src="https://docs.agenatrader.com/~gitbook/image?url=https%3A%2F%2F1347375179-files.gitbook.io%2F%7E%2Ffiles%2Fv0%2Fb%2Fgitbook-legacy-files%2Fo%2Fassets%252F-MKZSsJBtSP9L4sqIe_q%252F-MP9kDT9zA2O-o1q3pIu%252F-MP9v4qi2Tijt-5sZUu_%252FchartMenuAddPriceAltert.png%3Falt%3Dmedia%26token%3Dc446bb1d-9d7d-4e83-a0ca-074c64a7e4f3&#x26;width=768&#x26;dpr=4&#x26;quality=100&#x26;sign=29768714&#x26;sv=1" alt=""><figcaption></figcaption></figure>

Die spezifischen Einstellungen können durch klicken des markierten Symbols aufgerufen werden.

<figure><img src="https://docs.agenatrader.com/~gitbook/image?url=https%3A%2F%2F1347375179-files.gitbook.io%2F%7E%2Ffiles%2Fv0%2Fb%2Fgitbook-legacy-files%2Fo%2Fassets%252F-MKZSsJBtSP9L4sqIe_q%252F-MP9kDT9zA2O-o1q3pIu%252F-MP9v9pUvd-vFjNh8_ol%252FEditPriceAlert.png%3Falt%3Dmedia%26token%3D29da59fb-ed4c-43da-9812-62d0ae9afced&#x26;width=768&#x26;dpr=4&#x26;quality=100&#x26;sign=e7c122d1&#x26;sv=1" alt=""><figcaption></figcaption></figure>

Der Ton kann direkt in dem PreisBox Auswahlfenster selektiert werden.

<figure><img src="https://docs.agenatrader.com/~gitbook/image?url=https%3A%2F%2F1347375179-files.gitbook.io%2F%7E%2Ffiles%2Fv0%2Fb%2Fgitbook-legacy-files%2Fo%2Fassets%252F-MKZSsJBtSP9L4sqIe_q%252F-MP9kDT9zA2O-o1q3pIu%252F-MP9vbtyjMusVV87FXxb%252FChartMenuAddPriceAlert3.png%3Falt%3Dmedia%26token%3D64c6b530-995d-49f5-8134-9ec205190726&#x26;width=768&#x26;dpr=4&#x26;quality=100&#x26;sign=834a20e9&#x26;sv=1" alt=""><figcaption></figcaption></figure>

Durch **Choose other** gelangt man in die Sound Sammlung:

<figure><img src="https://docs.agenatrader.com/~gitbook/image?url=https%3A%2F%2F1347375179-files.gitbook.io%2F%7E%2Ffiles%2Fv0%2Fb%2Fgitbook-legacy-files%2Fo%2Fassets%252F-MKZSsJBtSP9L4sqIe_q%252F-MP9kDT9zA2O-o1q3pIu%252F-MP9vkYTspUXtVz45KR1%252FChartMenuAddPriceAlert4-german.png%3Falt%3Dmedia%26token%3D9edbdb0d-7106-4653-97ee-46131129b00e&#x26;width=768&#x26;dpr=4&#x26;quality=100&#x26;sign=75445f8e&#x26;sv=1" alt=""><figcaption></figcaption></figure>

Wird der Preis-Alarm vom Markt berührt, so wird der angegebene Ton einmalig abgespielt. Es ist auch möglich sich eine e-mail senden zu lassen:

* entweder stellt man es sich generell im **Allgemeine Einstellungen** ein,
* oder individuell je Alarm im Preisalarm Tab. Durch Rechtsklick auf den gewünschten Preisalarm und danach **Alarm bearbeiten**.

Preis-Alarme können im [Preis-Alarm Manager](https://docs.agenatrader.com/v/german/menue-erklaerungen-and-inhalt/tool-menue/alarme#Preis-Alarm) mit zusätzlichen Informationen versehen werden. **Beispiel 1. Orderlöschung mit einem Preisalarm (OCO-Verknüpfung mit Strg-Taste).**

<figure><img src="https://docs.agenatrader.com/~gitbook/image?url=https%3A%2F%2F1347375179-files.gitbook.io%2F%7E%2Ffiles%2Fv0%2Fb%2Fgitbook-legacy-files%2Fo%2Fassets%252F-MKZSsJBtSP9L4sqIe_q%252F-MP9kDT9zA2O-o1q3pIu%252F-MP9vnivghGm8q838dt-%252Fpreis_alarm_hinzufugen1_DE.png%3Falt%3Dmedia%26token%3D7d523b78-061c-47a8-a124-12bcfcf3ea47&#x26;width=768&#x26;dpr=4&#x26;quality=100&#x26;sign=a9b331bd&#x26;sv=1" alt=""><figcaption></figcaption></figure>

**Beispiel 2. Orderaktivierung mit einem Preisalarm (IfDone-Verknüpfung mit Alt-Taste).**

<figure><img src="https://docs.agenatrader.com/~gitbook/image?url=https%3A%2F%2F1347375179-files.gitbook.io%2F%7E%2Ffiles%2Fv0%2Fb%2Fgitbook-legacy-files%2Fo%2Fassets%252F-MKZSsJBtSP9L4sqIe_q%252F-MP9kDT9zA2O-o1q3pIu%252F-MP9vqXLF405tAsMIQNh%252Fpreis_alarm_hinzufugen2_DE.png%3Falt%3Dmedia%26token%3D3ad2a19c-8f4c-446f-a46e-6b2ddaa1647b&#x26;width=768&#x26;dpr=4&#x26;quality=100&#x26;sign=48beb83a&#x26;sv=1" alt=""><figcaption></figcaption></figure>

Sehen Sie mehr dazu im [Beispiel mit dynamischen Orders](https://docs.agenatrader.com/v/german/menue-erklaerungen-and-inhalt/hauptmenue/order-escort#Dynamische_Orders) und die weiteren Möglichkeiten im Kapitel: [Chart Trading: Orderverknüpfungen](https://docs.agenatrader.com/v/german/menue-erklaerungen-and-inhalt/hauptmenue/chart-menu/chart-trading#orderverknuepfungen).

**Achtung!** "Um den Preisalarm sichtbar zu machen, aktivieren Sie bitte **Preisalarm-Linien anzeigen**. Details finden Sie auf der Seite [Chart Toolbar: Preismarkierungen Linien](https://docs.agenatrader.com/v/german/menue-erklaerungen-and-inhalt/hauptmenue/chart-toolbar/preismarkierungen-linien)

## <img src="/files/XcGo64PbI2YpC0gRuIYJ" alt="" data-size="line"> Indikator-Alarm hinzufügen

*Ein Indicator-Alarm kann im Indicator-Alarm Manager Tab folgendermaßen hinzugefügt werden:*

1. Mit dem Rechtsklick im Chart wählen Sie **Indikator-Alarm hinzufügen** aus oder
2. Klicken Sie in der Hauptmenüleiste auf **Tools** und wählen dort **Alarme -> Indikator Alarm** aus.

Mit dieser Funktionalität können Sie sich einen Alarm ausgeben lassen, wenn der ausgewählte Indikator einen von Ihnen definierten Preis durchbricht.

<figure><img src="https://docs.agenatrader.com/~gitbook/image?url=https%3A%2F%2F1347375179-files.gitbook.io%2F%7E%2Ffiles%2Fv0%2Fb%2Fgitbook-legacy-files%2Fo%2Fassets%252F-MKZSsJBtSP9L4sqIe_q%252F-MP9kDT9zA2O-o1q3pIu%252F-MP9vzMzLF3S74sIIuA4%252Findicatoralert.png%3Falt%3Dmedia%26token%3Df0e734d8-d21a-4a84-91be-6943a08e96e6&#x26;width=768&#x26;dpr=4&#x26;quality=100&#x26;sign=1f84e694&#x26;sv=1" alt=""><figcaption></figcaption></figure>

Die spezifischen Einstellungen können durch klicken des markierten Symbols aufgerufen werden.

<figure><img src="https://docs.agenatrader.com/~gitbook/image?url=https%3A%2F%2F1347375179-files.gitbook.io%2F%7E%2Ffiles%2Fv0%2Fb%2Fgitbook-legacy-files%2Fo%2Fassets%252F-MKZSsJBtSP9L4sqIe_q%252F-MP9kDT9zA2O-o1q3pIu%252F-MP9w1cy4ypyxfL51LVV%252FChartMenuAddPriceAlert1%2520%281%29.png%3Falt%3Dmedia%26token%3D54e2adee-bf8c-4a66-b661-fd63e12ef2d9&#x26;width=768&#x26;dpr=4&#x26;quality=100&#x26;sign=efecc33b&#x26;sv=1" alt=""><figcaption></figcaption></figure>

Der Ton kann direkt in dem PreisBox Auswahlfenster selektiert werden.

<figure><img src="https://docs.agenatrader.com/~gitbook/image?url=https%3A%2F%2F1347375179-files.gitbook.io%2F%7E%2Ffiles%2Fv0%2Fb%2Fgitbook-legacy-files%2Fo%2Fassets%252F-MKZSsJBtSP9L4sqIe_q%252F-MP9kDT9zA2O-o1q3pIu%252F-MP9w3yAdmbZRa4y6BCt%252FChartMenuAddPriceAlert3%2520%281%29.png%3Falt%3Dmedia%26token%3D312a7987-ccb2-447f-a685-12993cc09d86&#x26;width=768&#x26;dpr=4&#x26;quality=100&#x26;sign=b9eba332&#x26;sv=1" alt=""><figcaption></figcaption></figure>

Durch **Choose other...** gelangt man in die Sound Sammlung:

<figure><img src="https://docs.agenatrader.com/~gitbook/image?url=https%3A%2F%2F1347375179-files.gitbook.io%2F%7E%2Ffiles%2Fv0%2Fb%2Fgitbook-legacy-files%2Fo%2Fassets%252F-MKZSsJBtSP9L4sqIe_q%252F-MP9kDT9zA2O-o1q3pIu%252F-MP9w6eo2ki3hD6GLiLS%252FChartMenuAddPriceAlert4-german%2520%281%29.png%3Falt%3Dmedia%26token%3Df3efe036-efee-4495-97f7-0d944a398789&#x26;width=768&#x26;dpr=4&#x26;quality=100&#x26;sign=c0d95601&#x26;sv=1" alt=""><figcaption></figcaption></figure>

Wird der Indikator-Alarm vom Markt berührt, so wird der angegebene Ton einmalig abgespielt.

*Es ist auch möglich sich eine e-mail senden zu lassen:*

* entweder stellt man es sich generell im **Allgemeine Einstellungen** ein,
* oder individuell je Alarm im Preisalarm Tab. Durch Rechtsklick auf den gewünschten Preisalarm und danach **Alarm bearbeiten**.

## Einstellungen

Durch klicken mit der rechten Maustaste im Chart öffnet sich das Kontextmenü mit Einstellungen.

<figure><img src="https://docs.agenatrader.com/~gitbook/image?url=https%3A%2F%2F1347375179-files.gitbook.io%2F%7E%2Ffiles%2Fv0%2Fb%2Fgitbook-legacy-files%2Fo%2Fassets%252F-MKZSsJBtSP9L4sqIe_q%252F-MP9kDT9zA2O-o1q3pIu%252F-MP9weo9V_h_vn8wJW4_%252FchartMenuSettings.png%3Falt%3Dmedia%26token%3D1ec02032-51d6-4e61-91ee-bf9a209c2bdc&#x26;width=768&#x26;dpr=4&#x26;quality=100&#x26;sign=8bc8980d&#x26;sv=1" alt=""><figcaption></figcaption></figure>

| Icon                                                                                                                                                                                                                                                                                                                                                                                    | Name                                                                                                                                                                           |
| --------------------------------------------------------------------------------------------------------------------------------------------------------------------------------------------------------------------------------------------------------------------------------------------------------------------------------------------------------------------------------------- | ------------------------------------------------------------------------------------------------------------------------------------------------------------------------------ |
|                                                                                                                                                                                                                                                                                                                                                                                         |                                                                                                                                                                                |
| ![Ok](https://docs.agenatrader.com/~gitbook/image?url=https%3A%2F%2F1347375179-files.gitbook.io%2F%7E%2Ffiles%2Fv0%2Fb%2Fgitbook-legacy-files%2Fo%2Fassets%252F-MKZSsJBtSP9L4sqIe_q%252F-MP9kDT9zA2O-o1q3pIu%252F-MP9wkPmZCUPCwwOCYSd%252Fok.png%3Falt%3Dmedia%26token%3D1f0aeb34-4c01-4d8f-8030-fe29cd9a4a2b\&width=300\&dpr=4\&quality=100\&sign=1f8308e8\&sv=1)                      | [Instrument-Auswahl](https://docs.agenatrader.com/v/german/menue-erklaerungen-and-inhalt/tool-menue/instrument-escort)                                                         |
| ![Time](https://docs.agenatrader.com/~gitbook/image?url=https%3A%2F%2F1347375179-files.gitbook.io%2F%7E%2Ffiles%2Fv0%2Fb%2Fgitbook-legacy-files%2Fo%2Fassets%252F-MKZSsJBtSP9L4sqIe_q%252F-MP9WizlMGepocaibx8N%252F-MP9bx727IvXlgJL6aoE%252Ficon10.png%3Falt%3Dmedia%26token%3D9322c0da-7cd0-4022-83d2-a0849b079668\&width=300\&dpr=4\&quality=100\&sign=d1d9ca4f\&sv=1)                | [Chart Toolbar: Zeiteinheit](https://docs.agenatrader.com/v/german/menue-erklaerungen-and-inhalt/hauptmenue/chart-toolbar/zeiteinheit)                                         |
| ![Set](https://docs.agenatrader.com/~gitbook/image?url=https%3A%2F%2F1347375179-files.gitbook.io%2F%7E%2Ffiles%2Fv0%2Fb%2Fgitbook-legacy-files%2Fo%2Fassets%252F-MKZSsJBtSP9L4sqIe_q%252F-MP9P3vFZH_eTVbqUMdh%252F-MP9R4o_7hwSVxbwjaC1%252Ficon3.png%3Falt%3Dmedia%26token%3Dd167afb8-ed65-41c5-b02b-a92f6a121092\&width=300\&dpr=4\&quality=100\&sign=327f7815\&sv=1)                  | [Chart Toolbar: Preis Style](https://docs.agenatrader.com/v/german/menue-erklaerungen-and-inhalt/hauptmenue/chart-toolbar/preis-style)                                         |
| ![Set1](https://docs.agenatrader.com/~gitbook/image?url=https%3A%2F%2F1347375179-files.gitbook.io%2F%7E%2Ffiles%2Fv0%2Fb%2Fgitbook-legacy-files%2Fo%2Fassets%252F-MKZSsJBtSP9L4sqIe_q%252F-MP9P3vFZH_eTVbqUMdh%252F-MP9RX778dE8cM3qpQJ-%252Ficon4.png%3Falt%3Dmedia%26token%3D46a6184a-9db7-4daa-9760-9bc74c4ed644\&width=300\&dpr=4\&quality=100\&sign=9f77b524\&sv=1)                 | [Chart Toolbar: Zeichenwerkzeuge](https://docs.agenatrader.com/v/german/menue-erklaerungen-and-inhalt/hauptmenue/chart-toolbar/zeichenwerkzeuge)                               |
| ![Set2](https://docs.agenatrader.com/~gitbook/image?url=https%3A%2F%2F1347375179-files.gitbook.io%2F%7E%2Ffiles%2Fv0%2Fb%2Fgitbook-legacy-files%2Fo%2Fassets%252F-MKZSsJBtSP9L4sqIe_q%252F-MP9WizlMGepocaibx8N%252F-MP9d6fzeCWud-aBxUdU%252Ficon19.png%3Falt%3Dmedia%26token%3D0fb320f2-9d3d-4acb-9a07-9fa2c01586ae\&width=300\&dpr=4\&quality=100\&sign=8191c1a9\&sv=1)                | [Chart Toolbar: Farbe](https://docs.agenatrader.com/v/german/menue-erklaerungen-and-inhalt/hauptmenue/chart-toolbar/farbe)                                                     |
| ![Set3](https://docs.agenatrader.com/~gitbook/image?url=https%3A%2F%2F1347375179-files.gitbook.io%2F%7E%2Ffiles%2Fv0%2Fb%2Fgitbook-legacy-files%2Fo%2Fassets%252F-MKZSsJBtSP9L4sqIe_q%252F-MP9WizlMGepocaibx8N%252F-MP9d0lgp6vb78E789ug%252Ficon15.png%3Falt%3Dmedia%26token%3Dc6459eb9-fd19-486d-a273-1ed4122467c4\&width=300\&dpr=4\&quality=100\&sign=baa60962\&sv=1)                | [Chart Toolbar: Chart-Netz](https://docs.agenatrader.com/v/german/menue-erklaerungen-and-inhalt/hauptmenue/chart-toolbar/chart-netz)                                           |
| ![Set4](https://docs.agenatrader.com/~gitbook/image?url=https%3A%2F%2F1347375179-files.gitbook.io%2F%7E%2Ffiles%2Fv0%2Fb%2Fgitbook-legacy-files%2Fo%2Fassets%252F-MKZSsJBtSP9L4sqIe_q%252F-MP9WizlMGepocaibx8N%252F-MP9b5eSKlMLXNHL1Nvl%252Ficon9.png%3Falt%3Dmedia%26token%3D0d53103d-0c35-4191-b5aa-bd2f68b2b533\&width=300\&dpr=4\&quality=100\&sign=2bfd0f5d\&sv=1)                 | [Zeiger](https://docs.agenatrader.com/v/german/menue-erklaerungen-and-inhalt/hauptmenue/chart-toolbar/zeiger)                                                                  |
| ![Set5](https://docs.agenatrader.com/~gitbook/image?url=https%3A%2F%2F1347375179-files.gitbook.io%2F%7E%2Ffiles%2Fv0%2Fb%2Fgitbook-legacy-files%2Fo%2Fassets%252F-MKZSsJBtSP9L4sqIe_q%252F-MP9WizlMGepocaibx8N%252F-MP9dtWqAMjuAZjTb2mJ%252Ficon16.png%3Falt%3Dmedia%26token%3D6dde2579-ebf2-4a8f-8876-109805a16e59\&width=300\&dpr=4\&quality=100\&sign=ce24b327\&sv=1)                | [Preismarkierungen](https://docs.agenatrader.com/v/german/menue-erklaerungen-and-inhalt/hauptmenue/chart-toolbar/preismarkierungen-linien)                                     |
| ![Icon5](https://docs.agenatrader.com/~gitbook/image?url=https%3A%2F%2F1347375179-files.gitbook.io%2F%7E%2Ffiles%2Fv0%2Fb%2Fgitbook-legacy-files%2Fo%2Fassets%252F-MKZSsJBtSP9L4sqIe_q%252F-MP9WizlMGepocaibx8N%252F-MP9d9bBpOG6X4L2NuHq%252Ficon5.png%3Falt%3Dmedia%26token%3Db072f86d-b9c8-4f88-a6ac-90c0d46dc4af\&width=300\&dpr=4\&quality=100\&sign=614b3586\&sv=1)                | [Chart Toolbar: Indikatoren](https://docs.agenatrader.com/v/german/menue-erklaerungen-and-inhalt/hauptmenue/chart-toolbar/indikatoren)                                         |
| ![Icon6](https://docs.agenatrader.com/~gitbook/image?url=https%3A%2F%2F1347375179-files.gitbook.io%2F%7E%2Ffiles%2Fv0%2Fb%2Fgitbook-legacy-files%2Fo%2Fassets%252F-MKZSsJBtSP9L4sqIe_q%252F-MP9WizlMGepocaibx8N%252F-MP9eMXm1NL-24KRSViu%252Ficon6%2520%281%29.png%3Falt%3Dmedia%26token%3D34d9d67b-1ff5-4311-b487-b912c61f2f9c\&width=300\&dpr=4\&quality=100\&sign=3b6debf3\&sv=1)    | [Chart Toolbar: Strategien](https://docs.agenatrader.com/v/german/menue-erklaerungen-and-inhalt/hauptmenue/chart-toolbar/strategien)                                           |
| ![Ind.par](https://docs.agenatrader.com/~gitbook/image?url=https%3A%2F%2F1347375179-files.gitbook.io%2F%7E%2Ffiles%2Fv0%2Fb%2Fgitbook-legacy-files%2Fo%2Fassets%252F-MKZSsJBtSP9L4sqIe_q%252F-MP9kDT9zA2O-o1q3pIu%252F-MP9xjyRNJUKmZMtG6Pe%252Find.par.png%3Falt%3Dmedia%26token%3Dd45f0919-4f28-40bf-b1a9-fb706c35ee53\&width=300\&dpr=4\&quality=100\&sign=2ed6a9ff\&sv=1)            | Indikatorenparameter bearbeiten (siehe unten)                                                                                                                                  |
| ![Ind.par1](https://docs.agenatrader.com/~gitbook/image?url=https%3A%2F%2F1347375179-files.gitbook.io%2F%7E%2Ffiles%2Fv0%2Fb%2Fgitbook-legacy-files%2Fo%2Fassets%252F-MKZSsJBtSP9L4sqIe_q%252F-MP9kDT9zA2O-o1q3pIu%252F-MP9xo0dCst43yC-V2U8%252Find.par1.png%3Falt%3Dmedia%26token%3Dc24c7753-5ecf-45ca-850e-75a85e7812e1\&width=300\&dpr=4\&quality=100\&sign=ab827395\&sv=1)          | Indikator bearbeiten (siehe unten)                                                                                                                                             |
| ![Ind.par2](https://docs.agenatrader.com/~gitbook/image?url=https%3A%2F%2F1347375179-files.gitbook.io%2F%7E%2Ffiles%2Fv0%2Fb%2Fgitbook-legacy-files%2Fo%2Fassets%252F-MKZSsJBtSP9L4sqIe_q%252F-MP9kDT9zA2O-o1q3pIu%252F-MP9xrKVYn-BeBeoa335%252Find.par2.png%3Falt%3Dmedia%26token%3D239e1560-f7d6-4392-a9d5-43398bfdb88e\&width=300\&dpr=4\&quality=100\&sign=c7690b1c\&sv=1)          | Indikator löschen (siehe unten)                                                                                                                                                |
| ![Set6](https://docs.agenatrader.com/~gitbook/image?url=https%3A%2F%2F1347375179-files.gitbook.io%2F%7E%2Ffiles%2Fv0%2Fb%2Fgitbook-legacy-files%2Fo%2Fassets%252F-MKZSsJBtSP9L4sqIe_q%252F-MP9WizlMGepocaibx8N%252F-MP9ePXL0xpUZPU_eWCL%252Ficon17.png%3Falt%3Dmedia%26token%3D5de06266-e510-469a-9f6e-d2a94745a6a3\&width=300\&dpr=4\&quality=100\&sign=12d30c3b\&sv=1)                | [Chart Toolbar: Trade Visualisierung](https://docs.agenatrader.com/v/german/menue-erklaerungen-and-inhalt/hauptmenue/chart-toolbar/trade-visualisierung)                       |
| ![Public Mode](https://docs.agenatrader.com/~gitbook/image?url=https%3A%2F%2F1347375179-files.gitbook.io%2F%7E%2Ffiles%2Fv0%2Fb%2Fgitbook-legacy-files%2Fo%2Fassets%252F-MKZSsJBtSP9L4sqIe_q%252F-MP9kDT9zA2O-o1q3pIu%252F-MP9y7eg88o9xyTARrT0%252Fpublic_mode.png%3Falt%3Dmedia%26token%3D3816f9bf-670e-4b73-a6c0-e870be35822d\&width=300\&dpr=4\&quality=100\&sign=1da9d74e\&sv=1)    | [Public mode](https://docs.agenatrader.com/v/german/menue-erklaerungen-and-inhalt/hauptmenue/chart-menu/tradersyard-social-trading)                                            |
| ![Back History](https://docs.agenatrader.com/~gitbook/image?url=https%3A%2F%2F1347375179-files.gitbook.io%2F%7E%2Ffiles%2Fv0%2Fb%2Fgitbook-legacy-files%2Fo%2Fassets%252F-MKZSsJBtSP9L4sqIe_q%252F-MP9kDT9zA2O-o1q3pIu%252F-MP9yCJLXHDumAUOeLo7%252Fback_history.png%3Falt%3Dmedia%26token%3D8bd87e69-6c81-4f21-b292-7122a633e0a1\&width=300\&dpr=4\&quality=100\&sign=3b1ebee2\&sv=1)  | [Show all history](https://docs.agenatrader.com/v/german/menue-erklaerungen-and-inhalt/hauptmenue/chart-toolbar/komplette-historie-anzeigen)                                   |
| ![Icon10](https://docs.agenatrader.com/~gitbook/image?url=https%3A%2F%2F1347375179-files.gitbook.io%2F%7E%2Ffiles%2Fv0%2Fb%2Fgitbook-legacy-files%2Fo%2Fassets%252F-MKZSsJBtSP9L4sqIe_q%252F-MP9WizlMGepocaibx8N%252F-MP9bx727IvXlgJL6aoE%252Ficon10.png%3Falt%3Dmedia%26token%3D9322c0da-7cd0-4022-83d2-a0849b079668\&width=300\&dpr=4\&quality=100\&sign=d1d9ca4f\&sv=1)              | [Chart Toolbar: Wechsel (außerbörslicher Modus](https://docs.agenatrader.com/v/german/menue-erklaerungen-and-inhalt/hauptmenue/chart-toolbar/wechsel-ausserboerslicher-modus)) |
| ![Time Bar](https://docs.agenatrader.com/~gitbook/image?url=https%3A%2F%2F1347375179-files.gitbook.io%2F%7E%2Ffiles%2Fv0%2Fb%2Fgitbook-legacy-files%2Fo%2Fassets%252F-MKZSsJBtSP9L4sqIe_q%252F-MP9WizlMGepocaibx8N%252F-MP9blWrg0tAnDc6wnb3%252Ftime_bar.png%3Falt%3Dmedia%26token%3D0c39f20d-c297-4e9a-9fc8-152730fdfd46\&width=300\&dpr=4\&quality=100\&sign=ddad9439\&sv=1)          | [Bar timer](https://docs.agenatrader.com/v/german/menue-erklaerungen-and-inhalt/hauptmenue/chart-toolbar/bar-timer)                                                            |
| ![Icon20](https://docs.agenatrader.com/~gitbook/image?url=https%3A%2F%2F1347375179-files.gitbook.io%2F%7E%2Ffiles%2Fv0%2Fb%2Fgitbook-legacy-files%2Fo%2Fassets%252F-MKZSsJBtSP9L4sqIe_q%252F-MP9WizlMGepocaibx8N%252F-MP9eSyeSMBysOp9wDU7%252Ficon20.png%3Falt%3Dmedia%26token%3D5878253c-35d3-4a18-a515-81954b1e7662\&width=300\&dpr=4\&quality=100\&sign=7bb55bd1\&sv=1)              | [Standard chart trading pad](https://docs.agenatrader.com/v/german/menue-erklaerungen-and-inhalt/hauptmenue/chart-toolbar/standard-chart-trading-pad)                          |
| ![Icon21](https://docs.agenatrader.com/~gitbook/image?url=https%3A%2F%2F1347375179-files.gitbook.io%2F%7E%2Ffiles%2Fv0%2Fb%2Fgitbook-legacy-files%2Fo%2Fassets%252F-MKZSsJBtSP9L4sqIe_q%252F-MP9WizlMGepocaibx8N%252F-MP9d3n8P357MjnLxqM-%252Ficon21.png%3Falt%3Dmedia%26token%3D3bde9abb-7986-407e-9f38-1320e0b5d07b\&width=300\&dpr=4\&quality=100\&sign=e1329648\&sv=1)              | [DOM](https://docs.agenatrader.com/v/german/menue-erklaerungen-and-inhalt/hauptmenue/depth-of-market-dom)                                                                      |
| ![Icon22](https://docs.agenatrader.com/~gitbook/image?url=https%3A%2F%2F1347375179-files.gitbook.io%2F%7E%2Ffiles%2Fv0%2Fb%2Fgitbook-legacy-files%2Fo%2Fassets%252F-MKZSsJBtSP9L4sqIe_q%252F-MP9kDT9zA2O-o1q3pIu%252F-MP9yXsuYmi6fsxVIPFc%252Ficon22.png%3Falt%3Dmedia%26token%3D0bc2c395-91d5-4914-aa76-b3a9364e753b\&width=300\&dpr=4\&quality=100\&sign=e9b54920\&sv=1)              | [3rd Level box](https://docs.agenatrader.com/v/german/menue-erklaerungen-and-inhalt/hauptmenue/3rd-level-box)                                                                  |
| ![Agena](https://docs.agenatrader.com/~gitbook/image?url=https%3A%2F%2F1347375179-files.gitbook.io%2F%7E%2Ffiles%2Fv0%2Fb%2Fgitbook-legacy-files%2Fo%2Fassets%252F-MKZSsJBtSP9L4sqIe_q%252F-MP9WizlMGepocaibx8N%252F-MP9aOPtau_iCznaZl27%252Ficon7.png%3Falt%3Dmedia%26token%3D71d811a8-d0e8-4be7-b2e7-c9d52031f5fe\&width=300\&dpr=4\&quality=100\&sign=608d59ef\&sv=1)                | [Start AgenaTrader++](https://docs.agenatrader.com/v/german/menue-erklaerungen-and-inhalt/hauptmenue/chart-toolbar/start-agenatrader++-plusplus)                               |
| ![Set7](https://docs.agenatrader.com/~gitbook/image?url=https%3A%2F%2F1347375179-files.gitbook.io%2F%7E%2Ffiles%2Fv0%2Fb%2Fgitbook-legacy-files%2Fo%2Fassets%252F-MKZSsJBtSP9L4sqIe_q%252F-MP9kDT9zA2O-o1q3pIu%252F-MP9yeGWy2-rb8E_dY7a%252Fset7.png%3Falt%3Dmedia%26token%3Dc3d247e1-2b0c-4978-9899-6cfad0bb0df2\&width=300\&dpr=4\&quality=100\&sign=9499a6d8\&sv=1)                  | [Chart Toolbar: Zu Instrumentliste hinzufügen](https://docs.agenatrader.com/v/german/menue-erklaerungen-and-inhalt/hauptmenue/chart-toolbar/zu-instrumentliste-hinzufuegen)    |
| ![Icon25](https://docs.agenatrader.com/~gitbook/image?url=https%3A%2F%2F1347375179-files.gitbook.io%2F%7E%2Ffiles%2Fv0%2Fb%2Fgitbook-legacy-files%2Fo%2Fassets%252F-MKZSsJBtSP9L4sqIe_q%252F-MP9kDT9zA2O-o1q3pIu%252F-MP9yhnwivMjXjxc2KzL%252Ficon25.png%3Falt%3Dmedia%26token%3D77ba7d9f-5250-4a6c-af44-39fad2cbb6a6\&width=300\&dpr=4\&quality=100\&sign=68dcc2e4\&sv=1)              | [Chart Toolbar: Drucken](https://docs.agenatrader.com/v/german/menue-erklaerungen-and-inhalt/hauptmenue/chart-toolbar/drucken)                                                 |
| ![Icon24](https://docs.agenatrader.com/~gitbook/image?url=https%3A%2F%2F1347375179-files.gitbook.io%2F%7E%2Ffiles%2Fv0%2Fb%2Fgitbook-legacy-files%2Fo%2Fassets%252F-MKZSsJBtSP9L4sqIe_q%252F-MP9kDT9zA2O-o1q3pIu%252F-MP9yo00_Rsybyzi0UeR%252Ficon24.png%3Falt%3Dmedia%26token%3D4b87db80-68f6-410f-abb3-eec427b9b012\&width=300\&dpr=4\&quality=100\&sign=5e2d4d6f\&sv=1)              | [Chart Toolbar: Als Bild speichern](https://docs.agenatrader.com/v/german/menue-erklaerungen-and-inhalt/hauptmenue/chart-toolbar/als-bild-speichern)                           |
| ![Icon18](https://docs.agenatrader.com/~gitbook/image?url=https%3A%2F%2F1347375179-files.gitbook.io%2F%7E%2Ffiles%2Fv0%2Fb%2Fgitbook-legacy-files%2Fo%2Fassets%252F-MKZSsJBtSP9L4sqIe_q%252F-MP9kDT9zA2O-o1q3pIu%252F-MP9r5XZ1pQz2rFnm--C%252Ficon18.png%3Falt%3Dmedia%26token%3Dc5fa6af4-162b-4666-91b9-acbbf71b4662\&width=300\&dpr=4\&quality=100\&sign=88c0187c\&sv=1)              | [Chart Toolbar: Export nach MS-Excel](https://docs.agenatrader.com/v/german/menue-erklaerungen-and-inhalt/hauptmenue/chart-toolbar/export-nach-ms-excel)                       |
| ![Set8](https://docs.agenatrader.com/~gitbook/image?url=https%3A%2F%2F1347375179-files.gitbook.io%2F%7E%2Ffiles%2Fv0%2Fb%2Fgitbook-legacy-files%2Fo%2Fassets%252F-MKZSsJBtSP9L4sqIe_q%252F-MP9kDT9zA2O-o1q3pIu%252F-MP9z-ooh5zHRf2LDSM8%252Fset8.png%3Falt%3Dmedia%26token%3Dfa670971-83e1-4fb1-9241-0ecfe78e6c77\&width=300\&dpr=4\&quality=100\&sign=edf378ee\&sv=1)                  | [Orders Templates](https://docs.agenatrader.com/v/german/menue-erklaerungen-and-inhalt/hauptmenue/chart-toolbar/orders-vorlagen)                                               |
| ![Set9](https://docs.agenatrader.com/~gitbook/image?url=https%3A%2F%2F1347375179-files.gitbook.io%2F%7E%2Ffiles%2Fv0%2Fb%2Fgitbook-legacy-files%2Fo%2Fassets%252F-MKZSsJBtSP9L4sqIe_q%252F-MP9hCcwEY3GiB8M11YV%252F-MP9iz3TBpSIFe4PbYMf%252Ficon13.png%3Falt%3Dmedia%26token%3D737bf622-ac25-4a64-a8e1-723cc0ad9ea5\&width=300\&dpr=4\&quality=100\&sign=a7d49fb5\&sv=1)                | [Chart Toolbar: Chart Vorlagen](https://docs.agenatrader.com/v/german/menue-erklaerungen-and-inhalt/hauptmenue/chart-toolbar/chart-vorlagen)                                   |
| ![Ind.par3](https://docs.agenatrader.com/~gitbook/image?url=https%3A%2F%2F1347375179-files.gitbook.io%2F%7E%2Ffiles%2Fv0%2Fb%2Fgitbook-legacy-files%2Fo%2Fassets%252F-MKZSsJBtSP9L4sqIe_q%252F-MP9WizlMGepocaibx8N%252F-MP9frV-qe2WxUuzpdA6%252Ficon11%2520%281%29.png%3Falt%3Dmedia%26token%3D76310f11-0481-4b93-930d-5f68c5680495\&width=300\&dpr=4\&quality=100\&sign=664bc9f\&sv=1) | [Chart Toolbar: Chart-Gruppe](https://docs.agenatrader.com/v/german/menue-erklaerungen-and-inhalt/hauptmenue/chart-toolbar/chart-gruppe)                                       |

Wenn Sie einen Indikator mit Linksklick angewählt haben und dann in das ChartMenu (mit Rechtsklick) wechseln, können Sie ebenfalls den Indikator bearbeiten.

<figure><img src="https://docs.agenatrader.com/~gitbook/image?url=https%3A%2F%2F1347375179-files.gitbook.io%2F%7E%2Ffiles%2Fv0%2Fb%2Fgitbook-legacy-files%2Fo%2Fassets%252F-MKZSsJBtSP9L4sqIe_q%252F-MP9kDT9zA2O-o1q3pIu%252F-MP9zF3YZU0Awl7vFDJw%252FIndikator_bearbeiten%2520-%2520DE.png%3Falt%3Dmedia%26token%3D1408f9d6-9673-41df-a1b5-133221a04457&#x26;width=768&#x26;dpr=4&#x26;quality=100&#x26;sign=6da6dc0b&#x26;sv=1" alt=""><figcaption></figcaption></figure>


---

[Next Page](/llms-full.txt/1)